概要
Amazon Elastic Compute Cloud (Amazon EC2) は、クラウド内でサイズ変更可能なコンピューティング能力を提供する Web サービスです。開発者が Web スケールのコンピューティングを簡単に利用できるように設計されています。
このインテグレーションを有効にすると、すべての EC2 メトリクスと、スケジュール設定されたメンテナンスなどの追加イベントが Datadog に表示されます。
セットアップ
インストール
Amazon Web Services インテグレーションをまだセットアップしていない場合は、最初にセットアップします。
設定
AWS インテグレーションページで、Metric Collection タブの下にある EC2 が有効になっていることを確認します。
Amazon EC2 のメトリクスを収集するには、次の必須アクセス許可を Datadog IAM ポリシーに追加します。詳細については、AWS ウェブサイト上の EC2 ポリシーを参照してください。
| AWS アクセス許可 | 説明 |
|---|
ec2:DescribeInstanceStatus | インスタンスの健全性をアサートするために、ELB インテグレーションによって使用されます。すべてのインスタンスの健全性を記述するために、EC2 インテグレーションによって使用されます。 |
ec2:DescribeSecurityGroups | EC2 インスタンスに SecurityGroup 名とカスタムタグを追加します。 |
ec2:DescribeInstances | EC2 インスタンスと EC2 Cloudwatch メトリクスにタグを追加します。 |
Datadog - Amazon EC2 インテグレーションをインストールします。
注: Datadog で EC2 インスタンスのサブセットを監視したい場合、それらの EC2 インスタンスに datadog:true などの AWS タグを付与します。Datadog AWS インテグレーションページの Metric Collection タブにある Limit metric collection to specific resources テキストボックスで、そのタグを指定します。
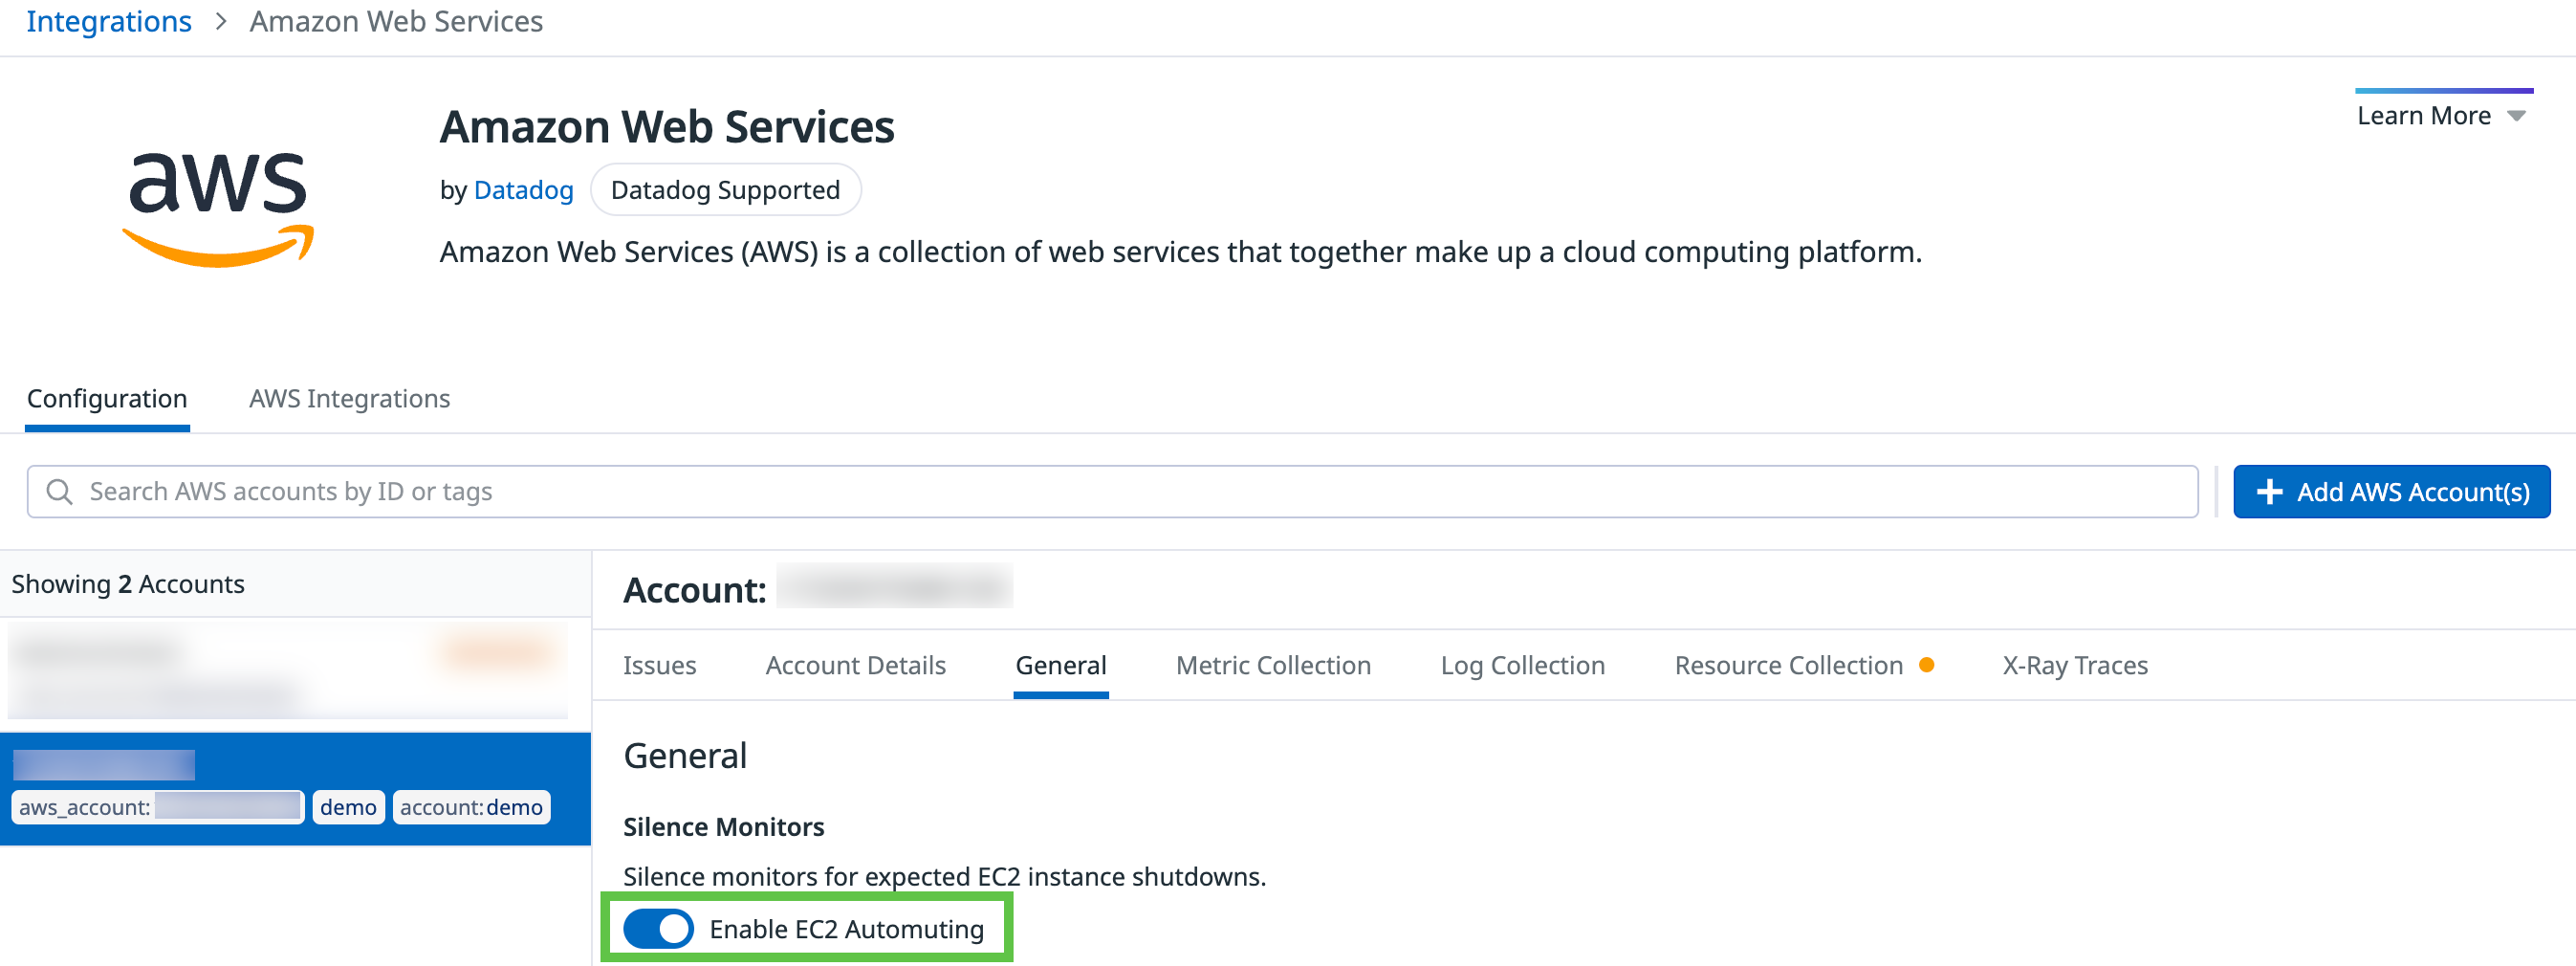
EC2 オートミュート
Datadog は、CloudWatch API からのホストステータスに基づいて、EC2 インスタンスの手動シャットダウンや AWS オートスケーリングによってトリガーされるインスタンスの停止に関連するモニターを事前にミュートすることができます。オートミュートされた EC2 インスタンスは、[モニターのダウンタイム][6ページで Show automatically muted hosts をオンにするとリストされます。
オートミュートを有効にするには、EC2 インテグレーションをインストールする必要があります。メトリクスの収集が何らかのタグが付いたホストに限られている場合は、それらのタグと一致するインスタンスだけがオートミュートされます。
EC2 インスタンスのシャットダウンが予期される場合にモニターをオフにするには、AWS インテグレーションページで EC2 automuting チェックボックスをオンにします。
Agent のインストール
Datadog では、EC2 インスタンスに Datadog Agent をセットアップする方法を 2 通り用意しています。クラウド インスタンスに Datadog Agent をインストールする理由 では、Amazon EC2 インスタンスに Datadog Agent を導入するメリットを確認できます。
Amazon Systems Manager UI による Agent のインストール (推奨)
AWS Systems Manager を使用して EC2 インスタンスに Datadog Agent をインストールするには、以下の手順に従ってください。
EC2 インスタンス上の IAM ロール を構成し、AmazonSSMManagedInstanceCore permission が有効になっていることを確認します。
AWS SSM の Documents タブ に移動します。
datadog を検索します。注: 上記のリンクは US East-1 リージョンのものです。AWS Management コンソールのトップナビゲーションバーでリージョンを切り替えて、自分のリージョンに合ったドキュメントを見つける必要があるかもしれません。
ニーズに応じて Linux または Windows のドキュメントを選択します。
- Linux: datadog-agent-installation-linux
- Windows: datadog-agent-installation-windows
- コマンドパラメーターを入力します。
- Agent をインストールする対象のインスタンスを選択します。
- Run をクリックします。
- 確認ステータスが終了するまで待ち、Datadog のインフラストラクチャーリストを確認します。
カスタム Agent の代替インストール
パラメーターストア
パラメーターストア (Parameter Store) で以下の内容を持つパラメーターを作成します。
- 名前:
dd-api-key-for-ssm - 説明: (オプション)
- タイプ:
安全な文字列 - KMS の主要なソース:
現在のアカウント - KMS キー ID: 選択されているデフォルト値を使用します
- 値: お使いの Datadog API キー
ドキュメント
Systems Manager で新しい ドキュメント (Document) を作成します。
- 名前:
dd-agent-install - ターゲットタイプ: (オプション)
- ドキュメントタイプ:
コマンドのドキュメント - コンテンツ:
JSON
Datadog US サイトをご利用の場合は、<AWS_REGION> (例: us-east-1) を runCommand の下に記載した dd-agent-install-us-site.json を使用してください。Datadog EU サイトをご利用の場合は、代わりに dd-agent-install-eu-site.json を使用してください。
コマンドの実行
Run Command 画面で Run command ボタンをクリックし、以下の手順に従います。
- コマンドのドキュメント:
- 検索ボックスをクリックし、Owner -> Owned by me を選択します。
- ドキュメントの横にあるラジオボタンをクリックします。
- 必要に応じて、ドキュメントのバージョンを選択します。
- ターゲット:
- 出力オプション (オプション):
- CloudWatch output チェックボックスをオンにして、問題をログに記録します。
- 他のセクション (オプション):
Run ボタンをクリックすると、ステータスが表示される確認ページが表示されます。処理が完了するまで待機してから、Datadog のインフラストラクチャーリストで確認してください。
EC2 Image Builder を使用した Agent のインストール
Datadog は、AWS Marketplace を通して EC2 Image Builder 用の Datadog Agent コンポーネントを公開しています。ユーザーは本コンポーネントにサブスクライブし、Image Builder コンポーネントを使用してカスタム AMI をビルドできます。
以下の手順に従って、Datadog Agent があらかじめインストールされたカスタム Amazon Machine Image を作成し、その AMI を使って EC2 インスタンスをプロビジョニングしてください。
初期リリースでは、このコンポーネントは Amazon Linux 2023 でテストされています。Datadog Agent をサポートする任意の Linux ディストリビューションであれば動作するはずです。
サブスクリプションの作成
- EC2 Image Builder コンソールを開き、「Discover products」へ移動します。
- Components タブを選択し、Datadog Agent を検索します。
- View subscription options をクリックし、表示される手順に従ってサブスクリプションを作成します。
詳細は Managing AWS Marketplace Subscriptions をご参照ください。
イメージレシピを作成する
- EC2 Image Builder コンソールで Image recipes に移動します。
- 新しいレシピを以下の設定で作成します。
- Base image -
arn:aws:imagebuilder:us-east-1:aws:image/amazon-linux-2023-x86/x.x.x. - Component -
arn:aws:imagebuilder:us-east-1:aws-marketplace:component/datadog-agent-for-linux-prod-wwo2b4p7dgrkk/0.1.0/1 - 必要に応じてコンポーネントパラメーターを構成します (ここではデフォルトを想定)。
詳細は EC2 Image Builder Recipes をご参照ください。
イメージパイプラインを作成し、イメージをビルドする
前提条件:
- デフォルトのロール
EC2InstanceProfileForImageBuilder には、次の追加権限が必要です。imagebuilder:GetMarketplaceResource — Marketplace から Datadog Agent コンポーネントを取得するため- シークレット ストアに保存された API キーとアプリケーション キーを取得するには、
secretsmanager:GetSecretValue を使用します。
- また、
dd-api-key と dd-app-key というキーで Datadog の API キーとアプリケーションキーを保管するために、mp-ib-datadog-agent-secret という名前のシークレットを作成してください。
続いて、パイプラインの作成とイメージのビルドを行います。
- EC2 Image Builder コンソールの Image pipelines に移動します。
- レシピ用にパイプラインを作成します。これは複数ステップのウィザードで、以下は最も簡単なシナリオを想定しています。
- ステップ 1: パイプライン名を指定し、ビルドスケジュールを手動に設定します。
- ステップ 2: 前のセクションで作成したレシピを選択します。
- ステップ 3: デフォルトの設定をそのまま使用します。
- ステップ 4: 追加ポリシーがアタッチされた
EC2InstanceProfileForImageBuilder ロールを使用するデフォルトのオプションをそのまま使用します。 - ステップ 5: デフォルト設定のままにします。
- ステップ 6: 内容を確認してパイプラインを作成します。
- 作成したパイプラインに移動し、実行します。
- パイプラインが完了すると、新しいイメージ ARN の要約が表示されます。
mp-ib-datadog-agent-secret シークレットを正しく設定してある場合、イメージから起動した EC2 インスタンスは起動後まもなく Datadog Agent でメトリクスを送信し始めます。
詳細については EC2 Image Builder Pipelines をご参照ください。
コンポーネントパラメーター
レシピでは、以下のパラメーターを使用して Agent をカスタマイズできます。
DD_SITE: テレメトリデータを送信するサイト。デフォルトは datadoghq.com。HOST_TAGS: ホストタグ。デフォルトは installer:ec2_image_builder。SM_SECRET_NAME: API キーおよびアプリケーションキーを格納するシークレットの名前。デフォルトは mp-ib-datadog-agent-secret。SM_API_KEY: シークレット内で API キーを取得するためのキー。デフォルトは dd-api-key。SM_API_KEY: シークレット内でアプリケーションキーを取得するためのキー。デフォルトは dd-app-key。
ログ収集
ログを Datadog に送信するには、Datadog Agent または別の ログ シッパー を使用します。
収集されるデータ
メトリクス
このインテグレーションで提供されるメトリクスの一覧は、metric-spec.yaml を参照してください。
AWS から取得される各メトリクスには、ホスト名やセキュリティ グループなど、AWS コンソールに表示されるのと同じタグが割り当てられます。
注:
aws.ec2.instance_age は、Datadog - EC2 インテグレーションではデフォルトで収集されません。このメトリクス収集を有効にするには、Datadog サポート へお問い合わせください。- Amazon EC2 インテグレーションでメトリクスの収集を無効にしても、
aws.ec2.host_ok はデフォルトで収集されるため、インフラストラクチャーリストに意図しないホストが表示される可能性があります。監視対象を希望するホストのみに制限するには、それらの EC2 インスタンスに datadog:true などの AWS タグを付与します。その後、Datadog AWS インテグレーションページの Metric Collection タブにある Limit metric collection to specific resources テキストボックスにそのタグを指定します。
サービス チェック
すぐに使える監視
Amazon EC2 インテグレーションは、パフォーマンスを監視し最適化するために、すぐに使える監視機能を提供します。
トラブルシューティング
ご不明な点は、Datadog のサポートチームまでお問合せください。
その他の参考資料