- 重要な情報
- はじめに
- 用語集
- Standard Attributes
- ガイド
- インテグレーション
- エージェント
- OpenTelemetry
- 開発者
- Administrator's Guide
- API
- Partners
- DDSQL Reference
- モバイルアプリケーション
- CoScreen
- CoTerm
- Remote Configuration
- Cloudcraft
- アプリ内
- ダッシュボード
- ノートブック
- DDSQL Editor
- Reference Tables
- Sheets
- Watchdog
- アラート設定
- メトリクス
- Bits AI
- Internal Developer Portal
- Error Tracking
- Change Tracking
- Service Management
- Actions & Remediations
- インフラストラクチャー
- Cloudcraft
- Resource Catalog
- ユニバーサル サービス モニタリング
- Hosts
- コンテナ
- Processes
- サーバーレス
- ネットワークモニタリング
- Cloud Cost
- アプリケーションパフォーマンス
- APM
- Continuous Profiler
- データベース モニタリング
- Data Streams Monitoring
- Data Jobs Monitoring
- Data Observability
- Digital Experience
- RUM & セッションリプレイ
- Synthetic モニタリング
- Continuous Testing
- Product Analytics
- Software Delivery
- CI Visibility (CI/CDの可視化)
- CD Visibility
- Deployment Gates
- Test Visibility
- Code Coverage
- Quality Gates
- DORA Metrics
- Feature Flags
- セキュリティ
- セキュリティの概要
- Cloud SIEM
- Code Security
- クラウド セキュリティ マネジメント
- Application Security Management
- Workload Protection
- Sensitive Data Scanner
- AI Observability
- ログ管理
- Observability Pipelines(観測データの制御)
- ログ管理
- CloudPrem
- 管理
Schema Tracking
This product is not supported for your selected Datadog site. ().
このページは日本語には対応しておりません。随時翻訳に取り組んでいます。
翻訳に関してご質問やご意見ございましたら、お気軽にご連絡ください。
翻訳に関してご質問やご意見ございましたら、お気軽にご連絡ください。
Data Streams Monitoring provides visibility into schemas used by producers and consumers, and how schema issues impact downstream services. You can track new schemas added, schemas with errors, and schema evolutions to manage schema migrations and identify issues.
Changing a schema produced by a service without updating the consumer can lead to the consumer struggling to process payloads, blocking further data flow downstream. Understanding schema changes ensures data compatibility between producers and consumers, and ultimately prevents issues.
Prerequisites
You must have Data Streams Monitoring installed on the producer and consumer services.
Supported languages
| Avro | Protobuf | Minimal tracer version | |
|---|---|---|---|
| Java | v1.36+ | ||
| Node.js | v5.24+ or v4.48+ | ||
| Python | v2.14+ | ||
| .NET | v3.15+ | ||
| Golang |
View schemas
Schema list
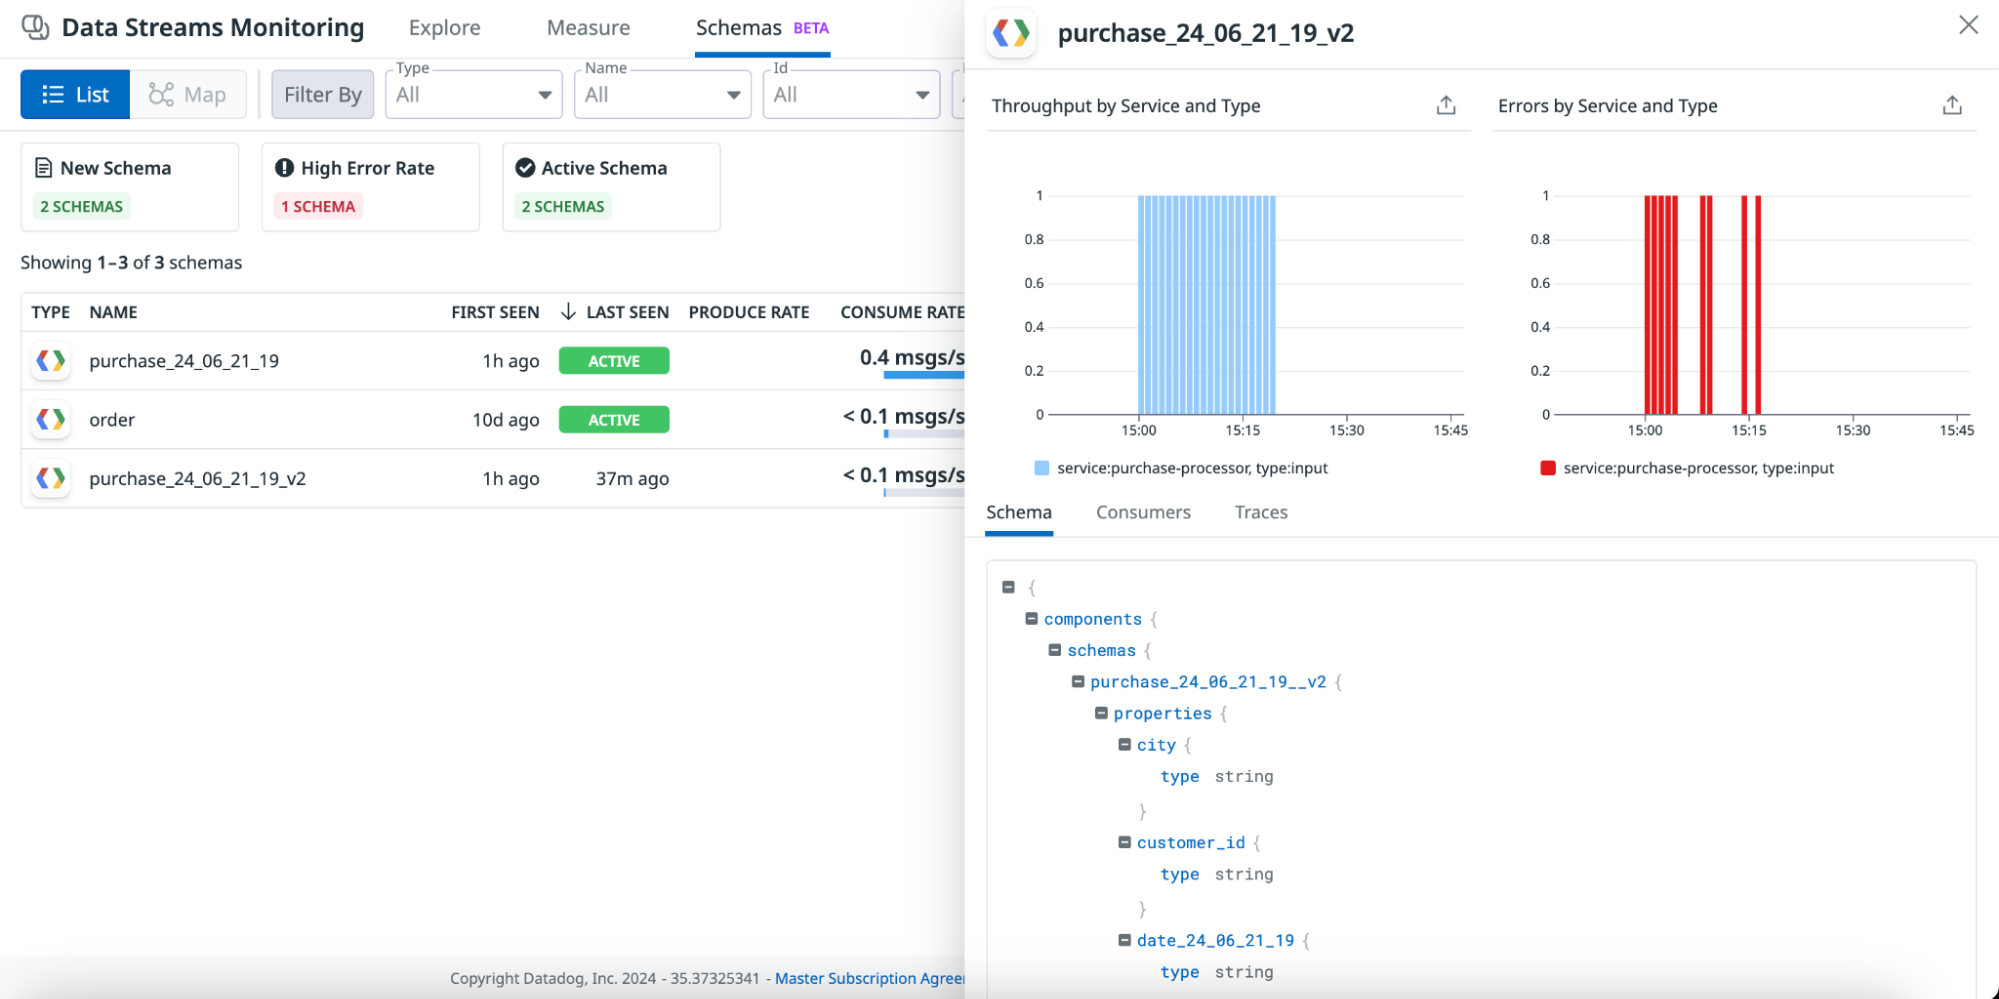
In the schema list, you can view all schemas used across your pipelines.
For each schema, the table shows the following:
- Type
- Name
- First and last seen
- Produce rate, consume rate, and error rate in the selected time frame
- All producers and consumers of the schema
- Consumer lag: the max Kafka lag for all consumers of a specific schema
Selecting a schema from the list displays the throughput of the schema by service, errors by service, and the full schema.
Use the following steps to view detailed information about a schema:
- Navigate to Data Streams Monitoring.
- Click the Schemas tab.
- Select the time frame.
- Use the quick filters to filter for new schemas (first seen within the last 3 hours), schemas with high error rates, or active schemas.
- Select a schema. A side panel opens with detailed information for that schema.
At the service level
For each service you track in Data Streams Monitoring, you can see information about the schemas that it uses.
To view schema information at the service level:
- Navigate to Data Streams Monitoring.
- Ensure the Explore tab is selected.
- Click on a service. The service detail side panel appears.
- Select the Schemas tab.
On the schemas tab, you can:
- View input throughput by schema.
- View a list of all schemas detected within the selected time frame, along with when it was first and last seen, its type (input or output schema), error rate, and throughput.
- Expand a schema to view all of its fields.


