- 重要な情報
- はじめに
- 用語集
- Standard Attributes
- ガイド
- インテグレーション
- エージェント
- OpenTelemetry
- 開発者
- Administrator's Guide
- API
- Partners
- DDSQL Reference
- モバイルアプリケーション
- CoScreen
- CoTerm
- Remote Configuration
- Cloudcraft
- アプリ内
- ダッシュボード
- ノートブック
- DDSQL Editor
- Reference Tables
- Sheets
- Watchdog
- アラート設定
- メトリクス
- Bits AI
- Internal Developer Portal
- Error Tracking
- Change Tracking
- Service Management
- Actions & Remediations
- インフラストラクチャー
- Cloudcraft
- Resource Catalog
- ユニバーサル サービス モニタリング
- Hosts
- コンテナ
- Processes
- サーバーレス
- ネットワークモニタリング
- Cloud Cost
- アプリケーションパフォーマンス
- APM
- Continuous Profiler
- データベース モニタリング
- Data Streams Monitoring
- Data Jobs Monitoring
- Data Observability
- Digital Experience
- RUM & セッションリプレイ
- Synthetic モニタリング
- Continuous Testing
- Product Analytics
- Software Delivery
- CI Visibility (CI/CDの可視化)
- CD Visibility
- Deployment Gates
- Test Visibility
- Code Coverage
- Quality Gates
- DORA Metrics
- Feature Flags
- セキュリティ
- セキュリティの概要
- Cloud SIEM
- Code Security
- クラウド セキュリティ マネジメント
- Application Security Management
- Workload Protection
- Sensitive Data Scanner
- AI Observability
- ログ管理
- Observability Pipelines(観測データの制御)
- ログ管理
- CloudPrem
- 管理
Bar Chart Widget
このページは日本語には対応しておりません。随時翻訳に取り組んでいます。
翻訳に関してご質問やご意見ございましたら、お気軽にご連絡ください。
翻訳に関してご質問やご意見ございましたら、お気軽にご連絡ください。
Overview
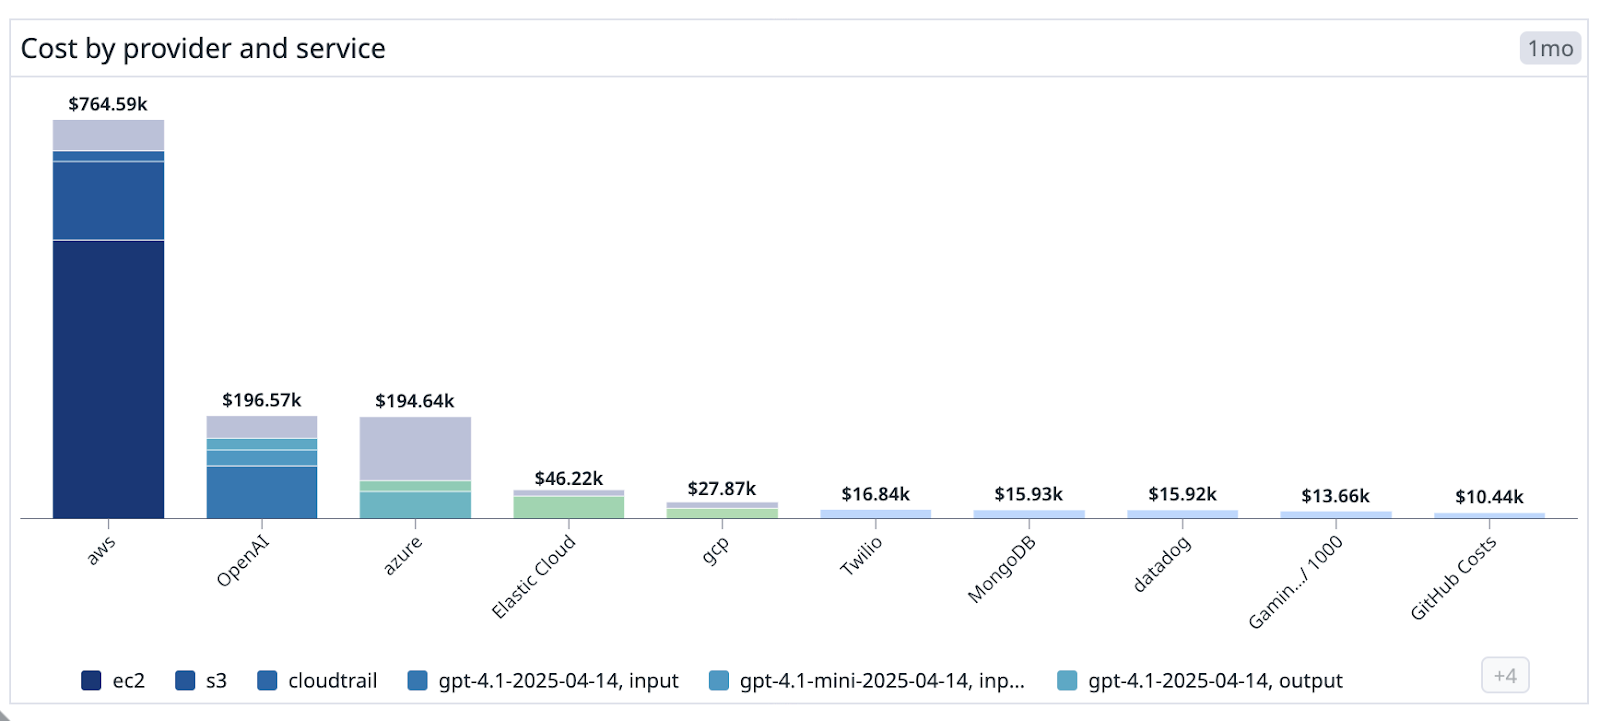
The bar chart widget is part of the same data family as the top list, treemap, and pie chart widgets, using categorical axes rather than temporal axes like timeseries bar graphs. It displays categorical data using vertical bars, allowing you to compare values across different categories or groups. Unlike the horizontal top list widget, the bar chart uses a vertical orientation which is particularly useful for dashboards with wide and short aspect ratios, or when you want to focus on value comparison rather than ranking.
Use the bar chart when visual comparison across categories matters more than reading exact tag values. Use the top list to prioritize label readability (such as long tag names) or need a ranked list format.
Setup
Configuration
- Select from the available data sources.
- Configure the query. See the following resources for more information:
- Metrics: See the querying documentation to configure a metric query.
- Events: See the log search documentation to configure a log event query.
- (Optional) Modify the query with a formula.
- Customize your graph.
Options
Display mode
The bar chart widget supports multiple levels of grouping with stacked visualization, enabling you to break down data by multiple dimensions.
- Stacked mode: Shows grouped data as layered bars within each category.
- Flat mode: Displays individual bars for each group.
- Relative mode: Shows values as percentages of the total (only for scalar data).
- Absolute mode: Shows raw count values.

