- 重要な情報
- はじめに
- 用語集
- Standard Attributes
- ガイド
- インテグレーション
- エージェント
- OpenTelemetry
- 開発者
- Administrator's Guide
- API
- Partners
- DDSQL Reference
- モバイルアプリケーション
- CoScreen
- CoTerm
- Remote Configuration
- Cloudcraft
- アプリ内
- ダッシュボード
- ノートブック
- DDSQL Editor
- Reference Tables
- Sheets
- Watchdog
- アラート設定
- メトリクス
- Bits AI
- Internal Developer Portal
- Error Tracking
- Change Tracking
- Service Management
- Actions & Remediations
- インフラストラクチャー
- Cloudcraft
- Resource Catalog
- ユニバーサル サービス モニタリング
- Hosts
- コンテナ
- Processes
- サーバーレス
- ネットワークモニタリング
- Cloud Cost
- アプリケーションパフォーマンス
- APM
- Continuous Profiler
- データベース モニタリング
- Data Streams Monitoring
- Data Jobs Monitoring
- Data Observability
- Digital Experience
- RUM & セッションリプレイ
- Synthetic モニタリング
- Continuous Testing
- Product Analytics
- Software Delivery
- CI Visibility (CI/CDの可視化)
- CD Visibility
- Deployment Gates
- Test Visibility
- Code Coverage
- Quality Gates
- DORA Metrics
- Feature Flags
- セキュリティ
- セキュリティの概要
- Cloud SIEM
- Code Security
- クラウド セキュリティ マネジメント
- Application Security Management
- Workload Protection
- Sensitive Data Scanner
- AI Observability
- ログ管理
- Observability Pipelines(観測データの制御)
- ログ管理
- CloudPrem
- 管理
Share Graphs
このページは日本語には対応しておりません。随時翻訳に取り組んでいます。
翻訳に関してご質問やご意見ございましたら、お気軽にご連絡ください。
翻訳に関してご質問やご意見ございましたら、お気軽にご連絡ください。
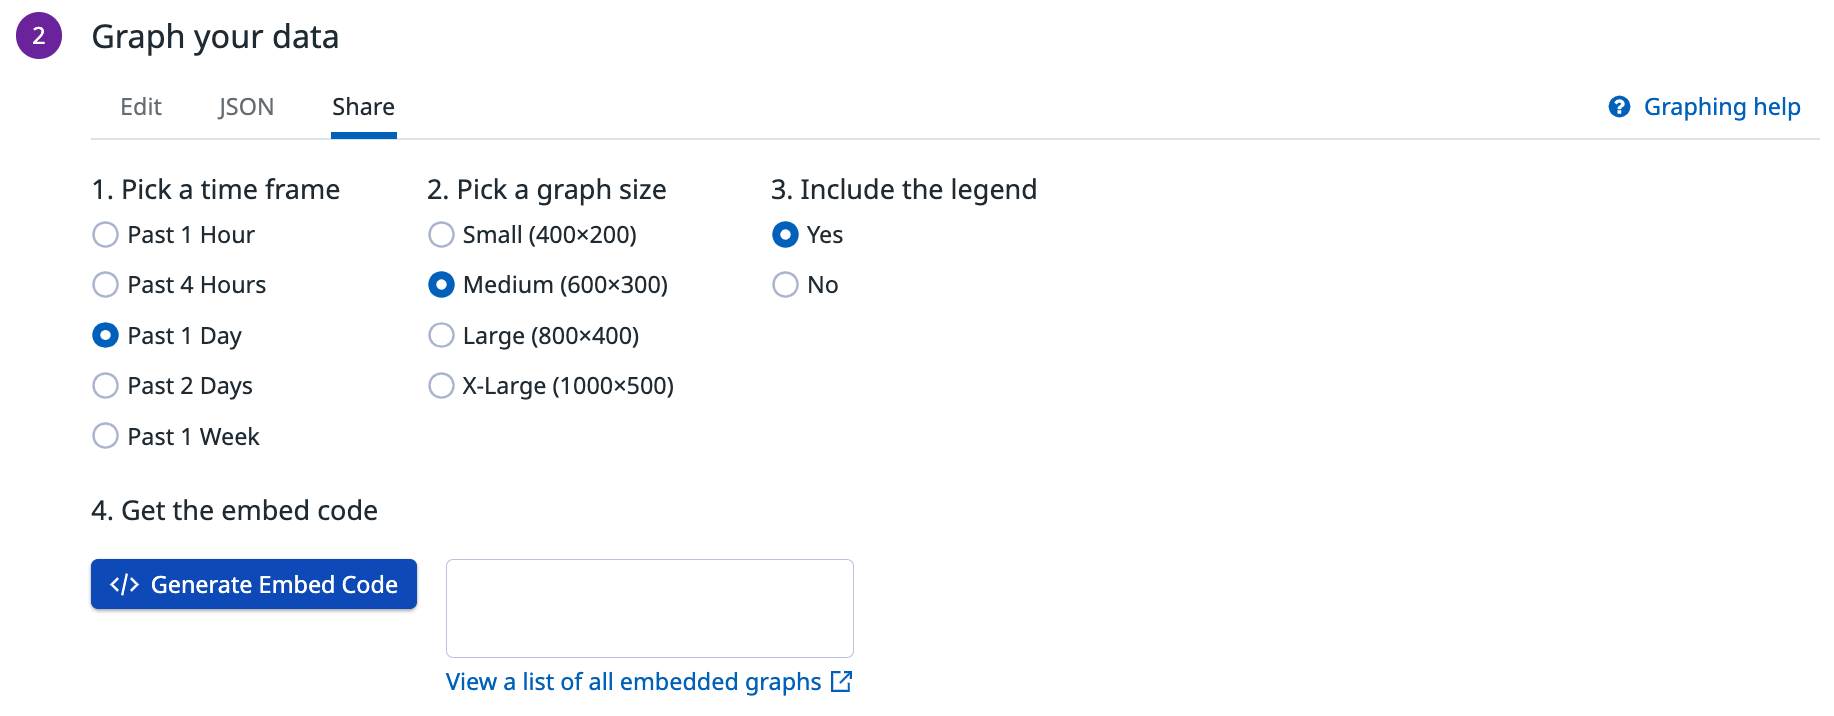
To share a graph:
- From the graph you want to share, click the pencil icon in the upper right corner.
- Under the Graph your data section, select the Share tab.
- Pick a timeframe for your graph.
- Pick a graph size.
- Choose to include the legend or not.
- Get the embed code with the Generate embed code button.
All shared graphs are listed in the Public Sharing Settings page. You can also revoke individual shared graphs or disable all shared graphs from this page.
Revoke
To revoke the keys used to share individual (embedded) graphs:
- Navigate to Organization Settings > Public Sharing > Shared Graphs to see a list of all shared graphs.
- Find your graph by using the search bar or by sorting the table columns.
- Click on the Revoke button next to the graph you want to stop sharing.
Applying restrictions
You can restrict access on an IP address basis to your dashboard. Email Datadog support to enable the IP address include listing feature that allows administrators to provide a list of IP addresses that have access to shared dashboards. After it’s enabled, manage your restrictions on your organization’s Public Sharing page.
API
Datadog has a dedicated API allowing you to interact with your shared graphs (embeds):
| Endpoint | Description |
|---|---|
| Get all embeds | Get a list of previously created embeddable graphs. |
| Create embed | Creates a new embeddable graph. |
| Get specific embed | Get the HTML fragment for a previously generated embed with embed_id. |
| Enable embed | Enable the specified embed. |
| Revoke embed | Revoke the specified embed. |

