- 重要な情報
- はじめに
- Datadog
- Datadog サイト
- DevSecOps
- AWS Lambda のサーバーレス
- エージェント
- インテグレーション
- コンテナ
- ダッシュボード
- アラート設定
- ログ管理
- トレーシング
- プロファイラー
- タグ
- API
- Service Catalog
- Session Replay
- Continuous Testing
- Synthetic モニタリング
- Incident Management
- Database Monitoring
- Cloud Security Management
- Cloud SIEM
- Application Security Management
- Workflow Automation
- CI Visibility
- Test Visibility
- Intelligent Test Runner
- Code Analysis
- Learning Center
- Support
- 用語集
- Standard Attributes
- ガイド
- インテグレーション
- エージェント
- OpenTelemetry
- 開発者
- 認可
- DogStatsD
- カスタムチェック
- インテグレーション
- Create an Agent-based Integration
- Create an API Integration
- Create a Log Pipeline
- Integration Assets Reference
- Build a Marketplace Offering
- Create a Tile
- Create an Integration Dashboard
- Create a Recommended Monitor
- Create a Cloud SIEM Detection Rule
- OAuth for Integrations
- Install Agent Integration Developer Tool
- サービスのチェック
- IDE インテグレーション
- コミュニティ
- ガイド
- Administrator's Guide
- API
- モバイルアプリケーション
- CoScreen
- Cloudcraft
- アプリ内
- Service Management
- インフラストラクチャー
- アプリケーションパフォーマンス
- APM
- Continuous Profiler
- データベース モニタリング
- Data Streams Monitoring
- Data Jobs Monitoring
- Digital Experience
- Software Delivery
- CI Visibility (CI/CDの可視化)
- CD Visibility
- Test Visibility
- Intelligent Test Runner
- Code Analysis
- Quality Gates
- DORA Metrics
- セキュリティ
- セキュリティの概要
- Cloud SIEM
- クラウド セキュリティ マネジメント
- Application Security Management
- AI Observability
- ログ管理
- Observability Pipelines(観測データの制御)
- ログ管理
- 管理
Search and Manage Deployments
このページは日本語には対応しておりません。随時翻訳に取り組んでいます。翻訳に関してご質問やご意見ございましたら、お気軽にご連絡ください。
CD Visibility is not available in the selected site () at this time.
Join the Preview!
CD Visibility is in Preview. If you're interested in this feature, complete the form to request access.
Request AccessDeployments
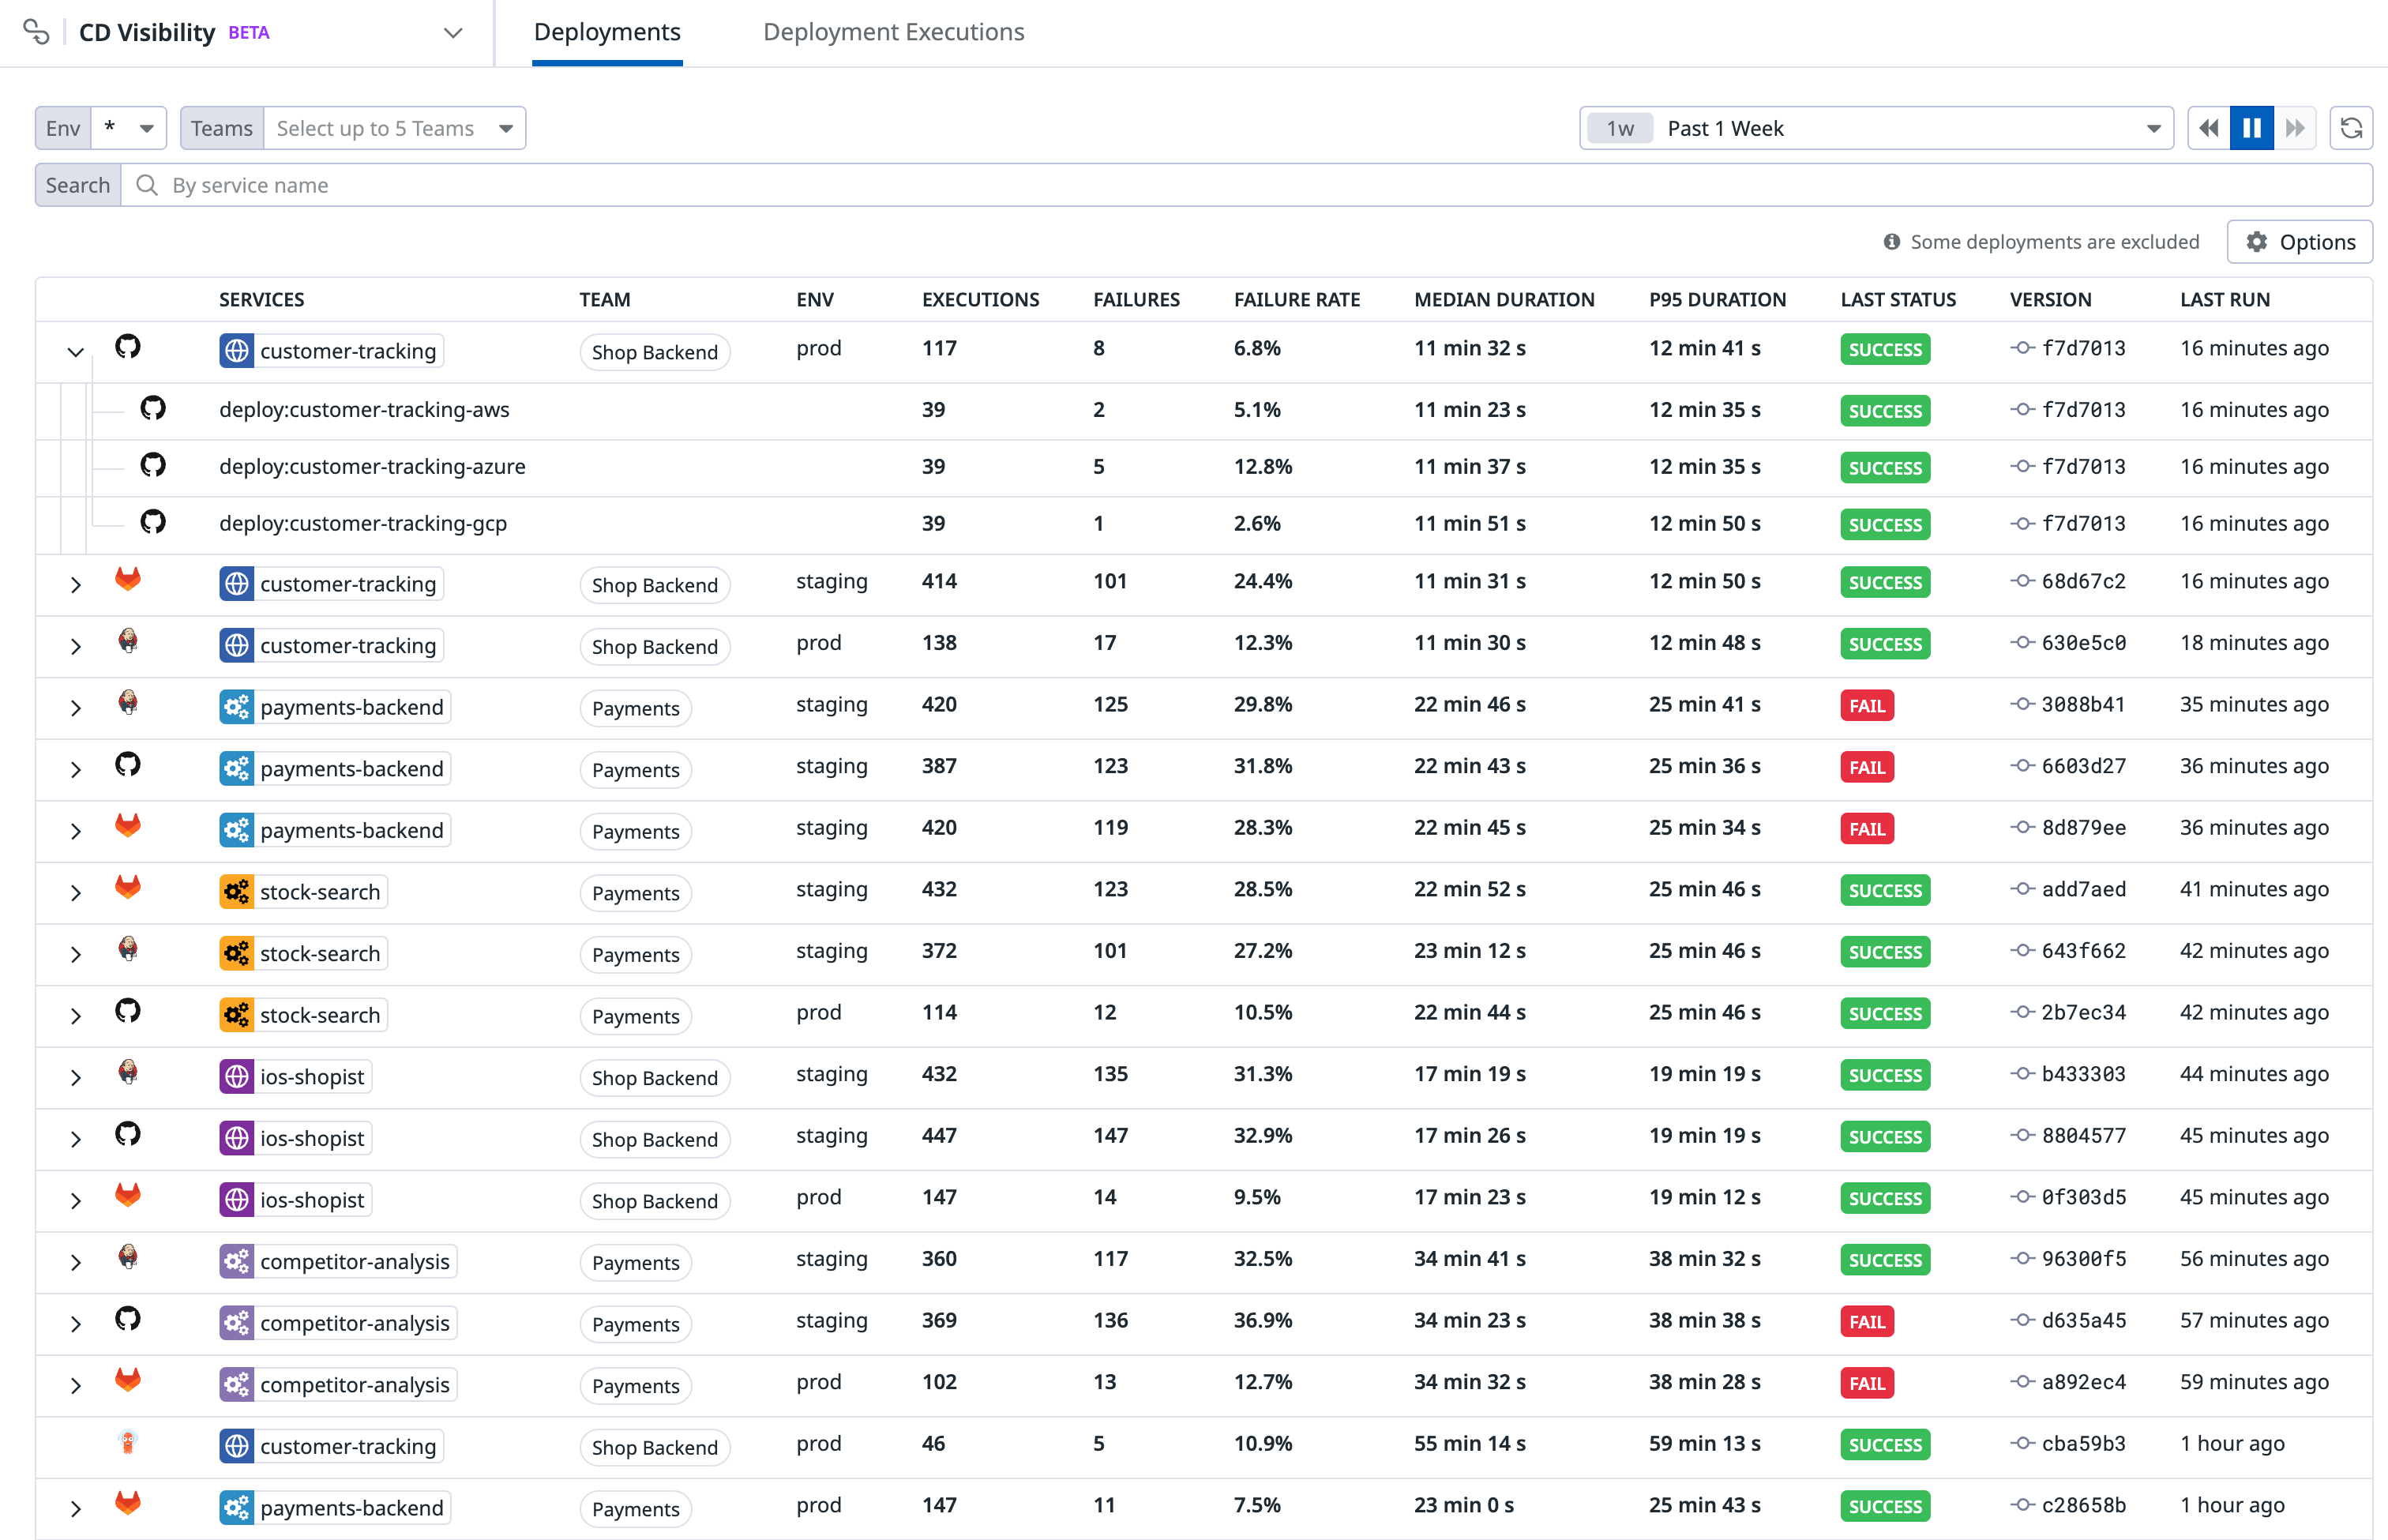
To see an overview of your deployments, navigate to Software Delivery > CD Visibility > Deployments.
The Deployments page shows stats aggregated by services and environments over the selected time frame, as well as the status of the latest deployment execution. Use this page to see all your service deployments and get a view of their health. The metrics shown include the number of executions and failures, the failure rate, the median duration, and the 95th percentile duration. This information reveals which deployments have a higher probability of failure and which deployments are taking the most time to be executed. The effect of the latest changes can be seen by checking the status, revision and time of the last deployment result.
Deployments with no services configured and partial deployment executions are excluded from the statistics aggregation of the Deployments page. You can search for these deployments in the Deployment Executions page:
@deployment.partial_deployment:* OR -@deployment.service:*.If you have different ways of deploying a service to an environment, you can expand the deployment rows to see stats further filtered by deployment name.
The Deployment page provides you high-level information, including:
- An overview of the health of the different services and environments, with aggregated stats.
- A window for spotting and fixing immediate, urgent issues like broken deployments in production.
- How each service deployment was executed, over time, and the results and trends.
Deployment details
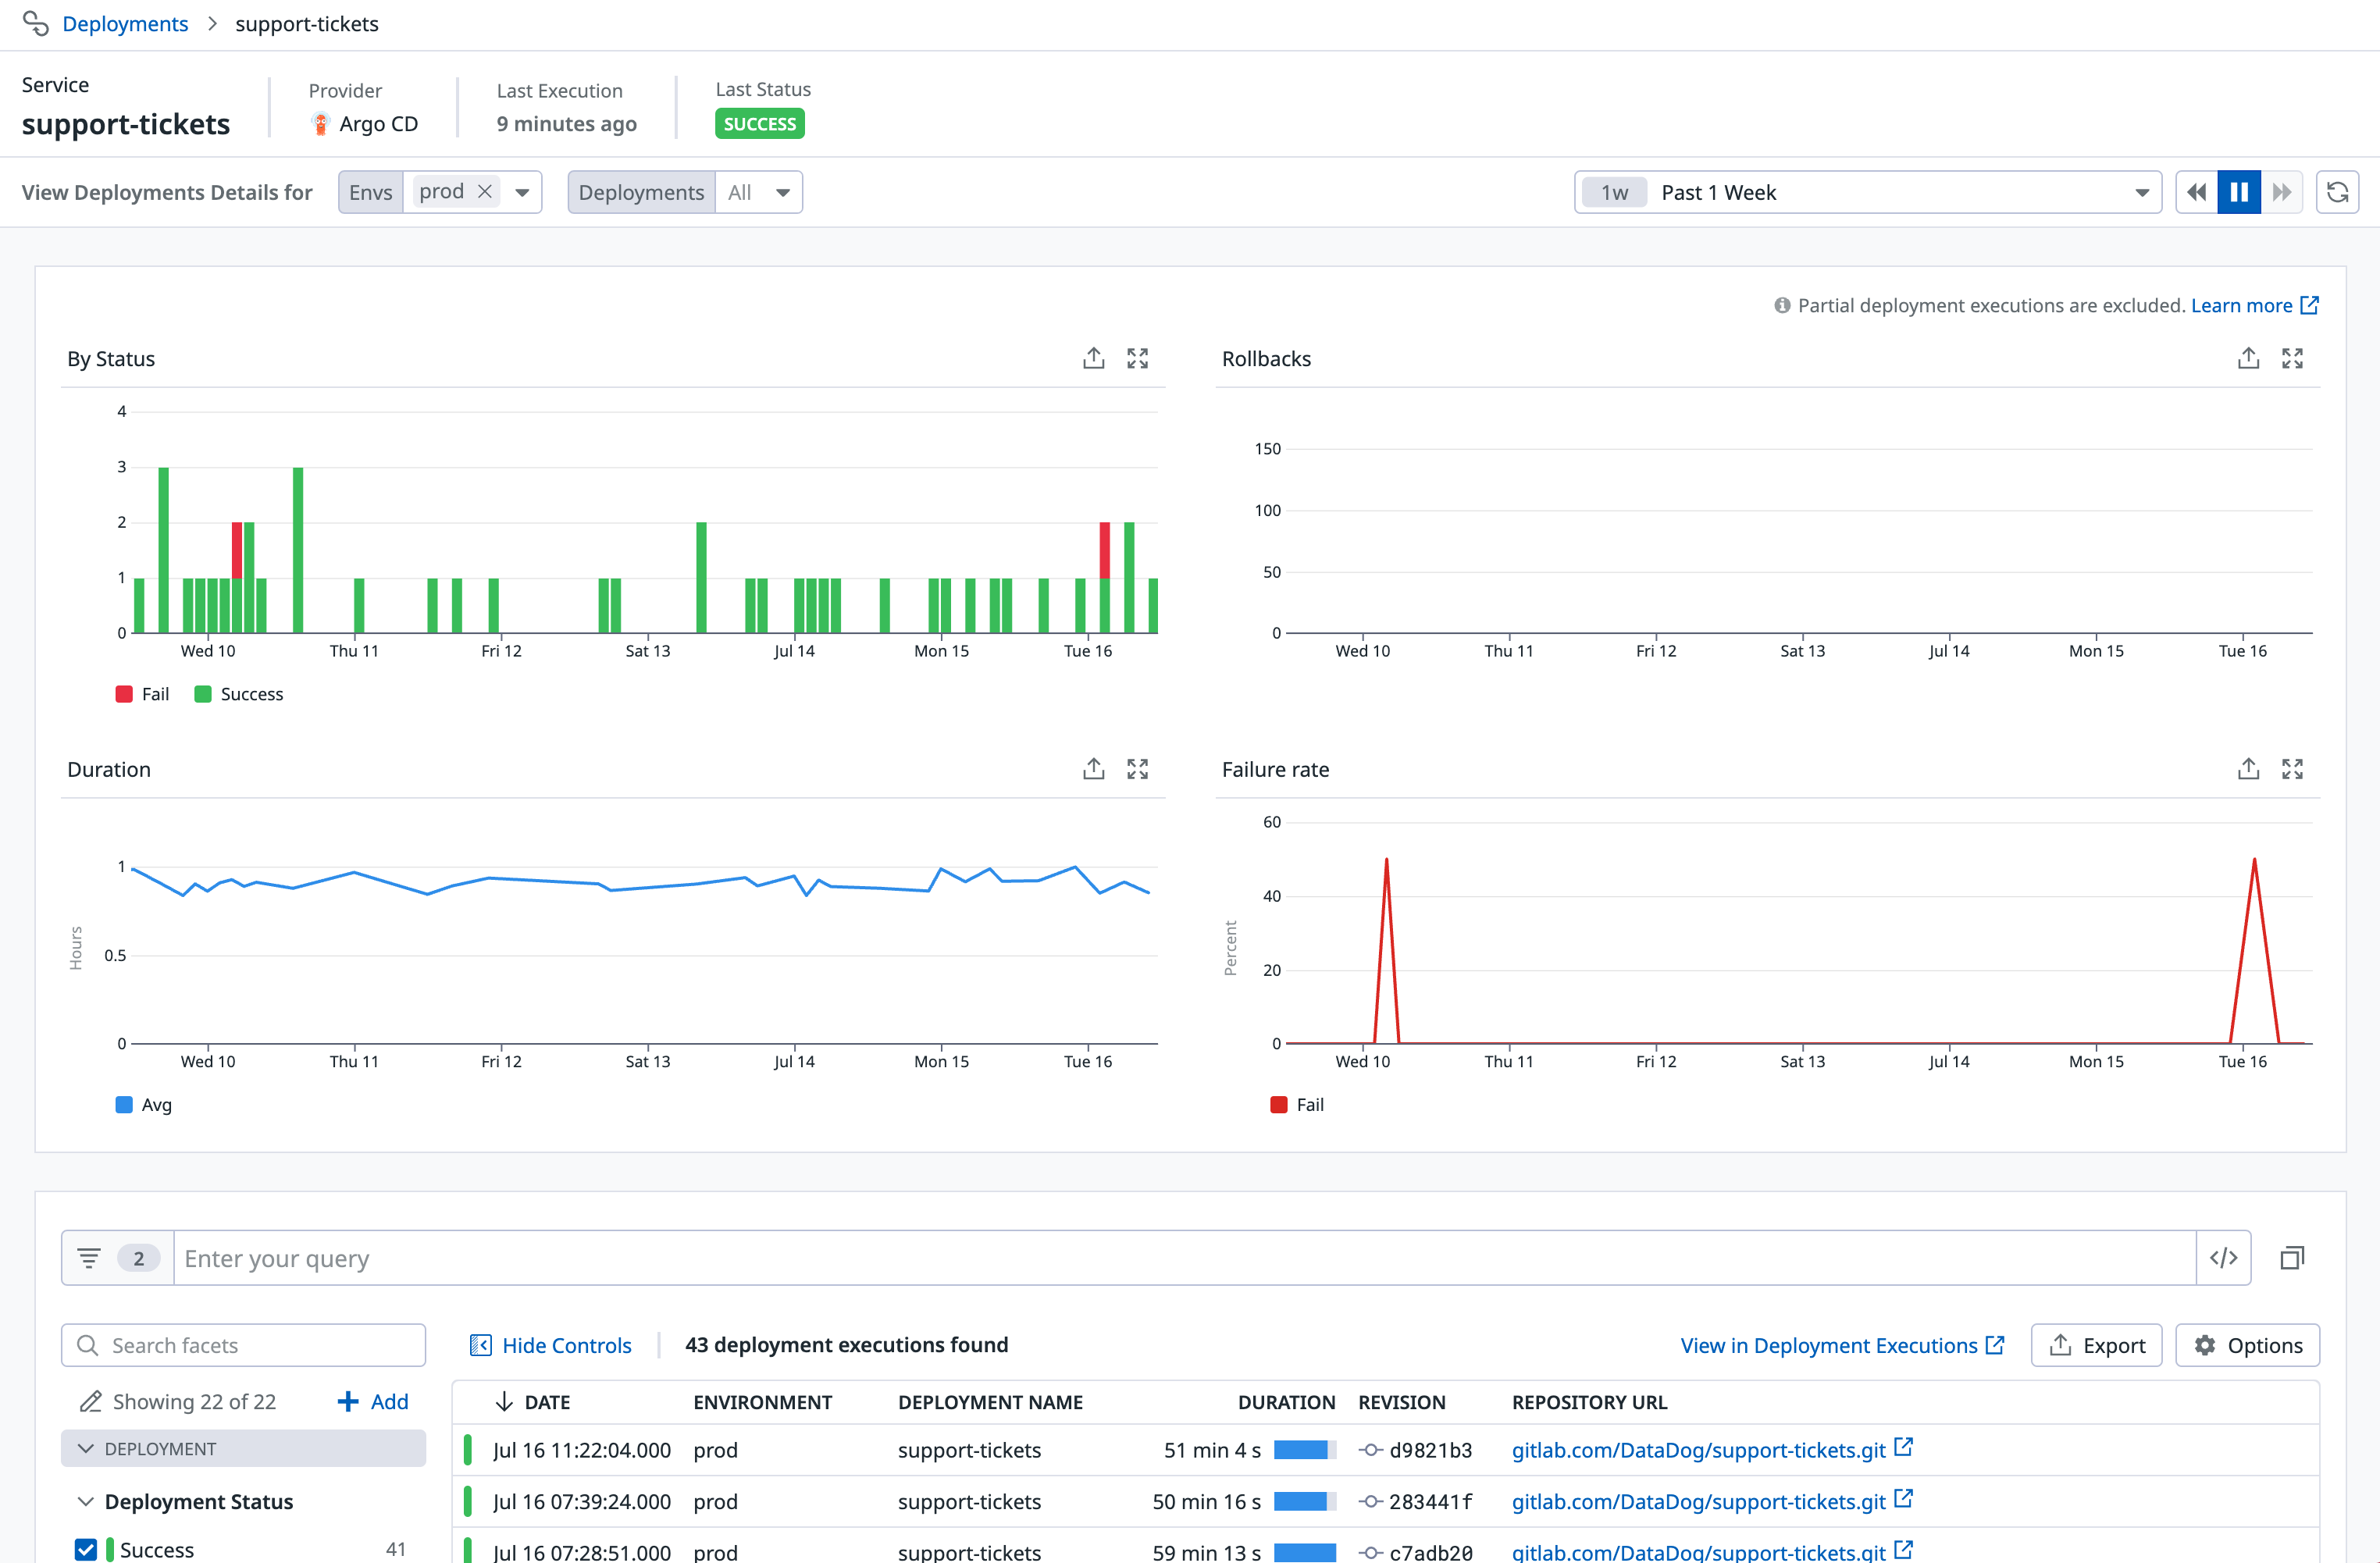
Click into a specific service deployment to see the Deployment Details page, which provides views of the data for the service deployment you selected over a specified time frame.
Get insights on the selected service deployment such as the number of successful and failed deployments over time, the average deployment duration, number of rollbacks, and the failure rate. The bottom part of the page shows a table with the deployment executions for the service, based on the environment filter selected.
Deployment executions
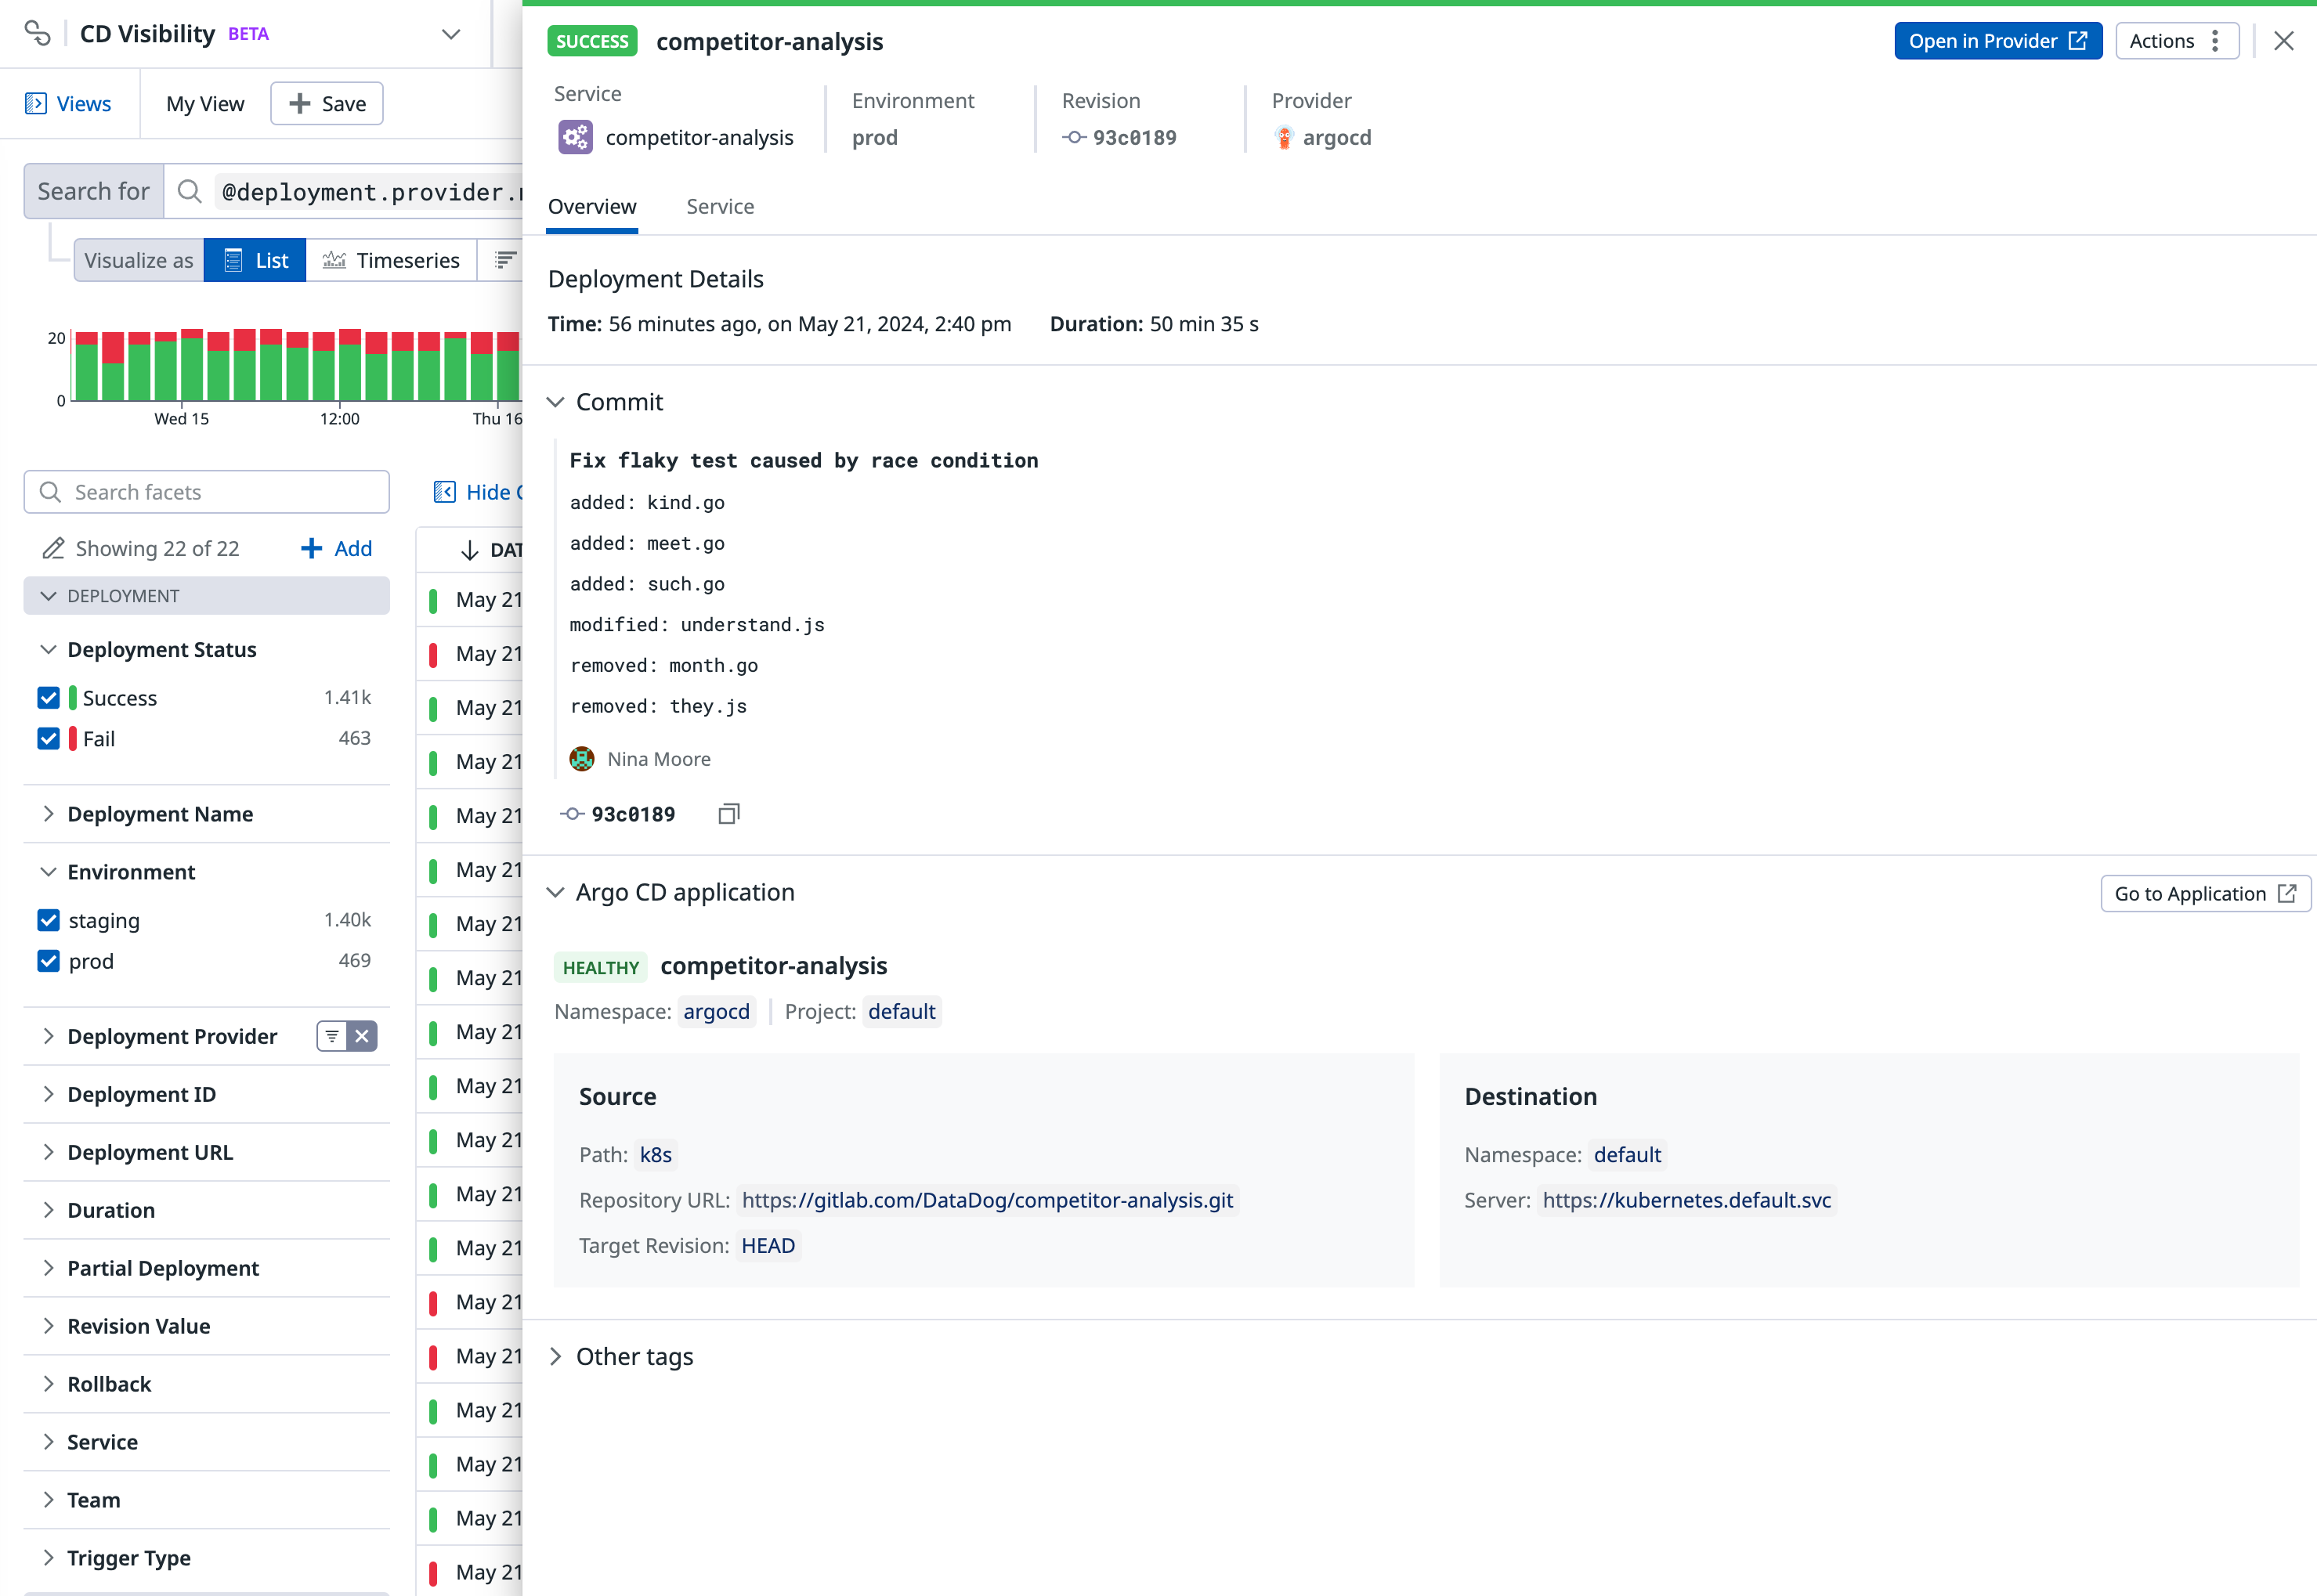
The Deployment Executions page shows all the times that a deployment ran during the selected time frame. Use the facets on the left side to filter the list of deployment executions, and click on an execution to see additional details on the Deployment Execution Details side panel.
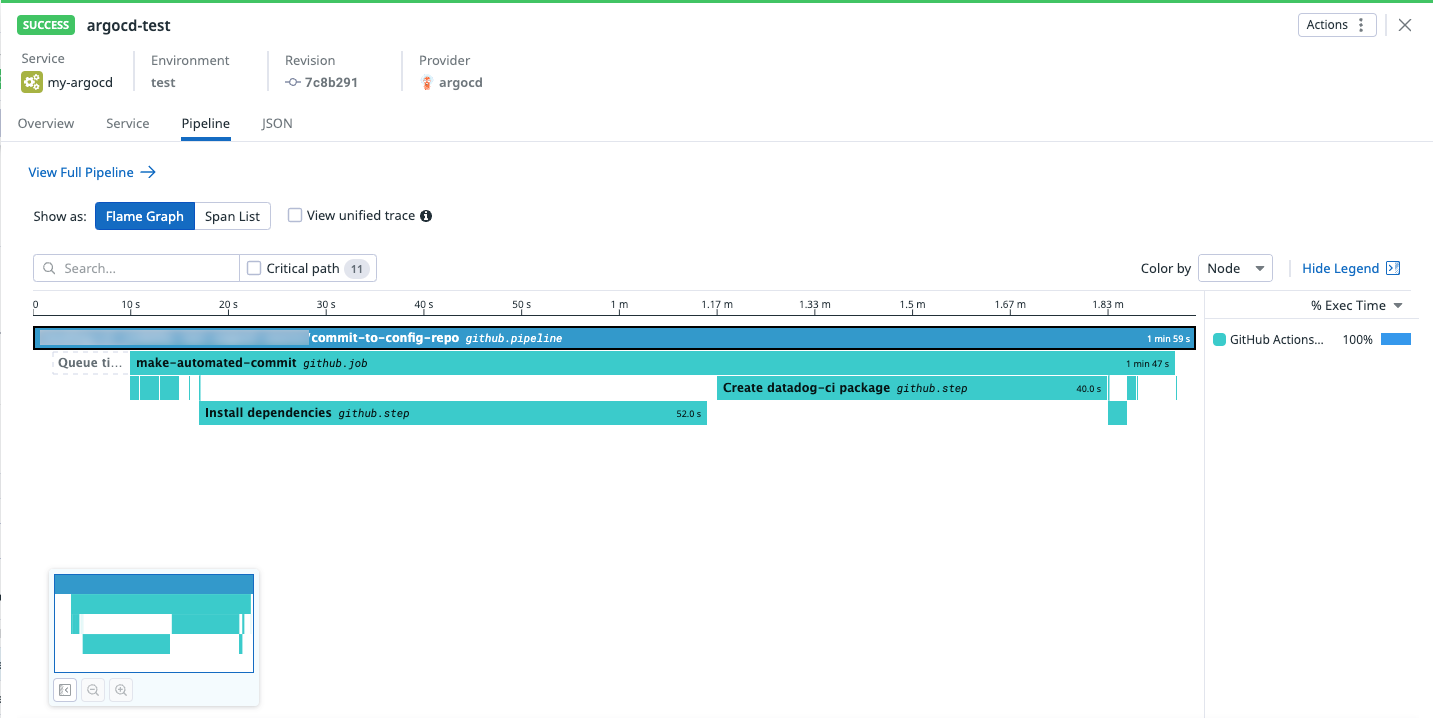
When a deployment is correctly associated to a pipeline in CI Visibility, the deployment executions panel contains a new Pipeline tab from which the pipeline trace is visible. From this tab, you can navigate to CI Visibility by clicking the View Full Pipeline link at the top:
Additional setup might be required to associate a deployment to a CI pipeline. For more information, see the setup page for your CD provider.
Further reading
お役に立つドキュメント、リンクや記事:


