The Datadog PagerDuty integration has limited support in the Datadog for Government site. Service Catalog integration and auto-resolution from Incident Management and Workflow Automation are not supported.
Overview
Connect PagerDuty to Datadog to route alert notifications and incident pages through your existing PagerDuty services. PagerDuty can be used across several Datadog surfaces:
- Monitors: Add a PagerDuty service handle to a monitor’s notification configuration so that when an alert threshold is breached, PagerDuty pages the appropriate responders.
- Incident Management: Page users or teams directly from a Datadog incident, view all pages sent for an incident in the Pages tab, and set up automated notification rules that trigger PagerDuty handles when incident conditions are met.
- Notifications: Send manual or automated notifications to a PagerDuty service from within an incident.
- Slack: Use the “Page on call” action in the Slack action tray, or use the slash commands to route pages through PagerDuty.
Setup
- In your PagerDuty account, create a service and note the integration key it generates. For detailed steps, see the PagerDuty integration guide.
In Datadog
- Navigate to Integrations and search for PagerDuty.
- Add each PagerDuty service you want to use in Datadog: enter the service name and paste the integration key from PagerDuty.
- Save your configuration. The service name becomes the handle you use to route notifications (for example,
@pagerduty-[serviceName]).
Datadog has an upper limit of 1024 characters on monitor notification lengths sent to PagerDuty. This may truncate the alert description.
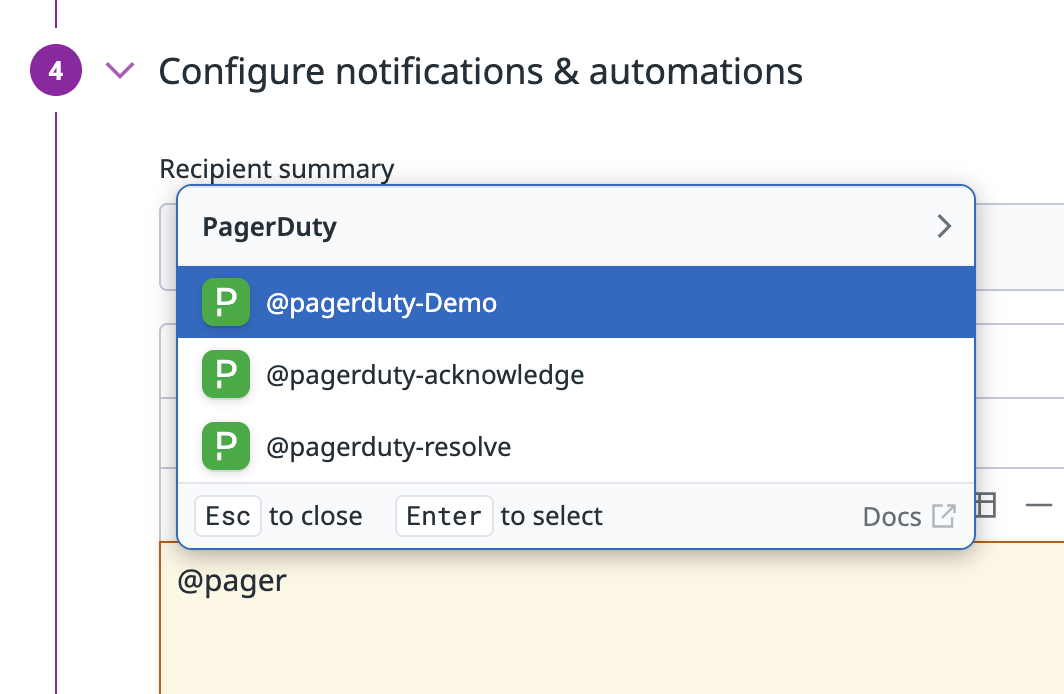
To send a monitor alert to PagerDuty, add the @pagerduty-[serviceName] handle to the monitor’s Configure notifications & automations section. As you type, the handle autocompletes based on the services you added during setup. For more information on adding PagerDuty as a notification recipient, see Monitor Notification.
Severity mapping for monitors and incidents
When you receive a PagerDuty alert from a Datadog monitor, you can declare a Datadog incident directly from that alert. The incident severity is automatically mapped based on the monitor’s status as follows:
| Monitor status | PagerDuty incident severity |
|---|
ALERT | error |
NODATA | error |
WARNING | warning |
OK or others | info |
This mapping is automatic and cannot be modified.
When a monitor recovers, it automatically resolves the PagerDuty incident if the handle is included in the monitor’s recovery message.
Note: The auto-resolution does not work if the handle is scoped exclusively to the {{#is_alert}} context.
Paging responders from incidents
From any Datadog incident, you can page a user or team directly. If your paging is configured to route through PagerDuty, the page is sent to the appropriate PagerDuty service.
Automated notification rules
To automatically notify a PagerDuty handle based on incident conditions:
- In Incident Management, go to Settings > Notifications.
- Create a notification rule and select your PagerDuty service as the recipient.
- Configure the trigger conditions (for example, when an incident is declared or when incident attributes are updated).
After it’s configured, the rule fires automatically whenever the specified conditions are met, without requiring manual action.
Automations
PagerDuty handles can also be used as actions in Incident Management Automations. This lets you build workflows that page PagerDuty services as part of a broader automated response.
Slack
You can enable paging with PagerDuty through Slack in two ways:
- Action tray: The action tray within Slack incident channels includes a button to page responders.
- Slash commands: Use
/datadog page or /dd page in any Slack channel to trigger a page. For more information, see Triggering a page through Slack.
When PagerDuty is configured as your paging provider (under Incident Settings), these actions route through PagerDuty instead of Datadog On-Call.
Data Collected
Metrics
The PagerDuty integration does not include any metrics.
Events
PagerDuty triggered and resolved events appear in the Events Explorer.
Service Checks
The PagerDuty integration does not include any service checks.
Troubleshooting
Need help? Contact Datadog support.
Further Reading
Additional helpful documentation, links, and articles: