- Agents
- Essentials
- Getting Started
- Agent
- API
- APM Tracing
- Containers
- Dashboards
- Database Monitoring
- Datadog
- Datadog Site
- DevSecOps
- Incident Management
- Integrations
- Internal Developer Portal
- Logs
- Monitors
- Notebooks
- OpenTelemetry
- Profiler
- Search
- Session Replay
- Security
- Serverless for AWS Lambda
- Software Delivery
- Synthetic Monitoring and Testing
- Tags
- Workflow Automation
- Learning Center
- Support
- Glossary
- Standard Attributes
- Guides
- Agent
- Integrations
- Extend Datadog
- Authorization
- DogStatsD
- Custom Checks
- Integrations
- Build an Integration with Datadog
- Create an Agent-based Integration
- Create an API-based Integration
- Create a Log Pipeline
- Integration Assets Reference
- Build a Marketplace Offering
- Create an Integration Dashboard
- Create a Monitor Template
- Create a Cloud SIEM Detection Rule
- Install Agent Integration Developer Tool
- Service Checks
- Community
- Guides
- OpenTelemetry
- Administrator's Guide
- API
- Partners
- Datadog Mobile App
- DDSQL Reference
- CoScreen
- CoTerm
- Remote Configuration
- Cloudcraft (Standalone)
- In The App
- Dashboards
- Notebooks
- DDSQL Editor
- Reference Tables
- Sheets
- Monitors and Alerting
- Service Level Objectives
- Metrics
- Watchdog
- Bits AI
- Internal Developer Portal
- Error Tracking
- Change Tracking
- Event Management
- Incident Response
- Actions & Remediations
- Infrastructure
- Cloudcraft
- Resource Catalog
- Universal Service Monitoring
- End User Device Monitoring
- Hosts
- Containers
- Processes
- Serverless
- Network Monitoring
- Storage Management
- Cloud Cost
- Application Performance
- APM
- Continuous Profiler
- Database Monitoring
- Agent Integration Overhead
- Setup Architectures
- Setting Up Postgres
- Setting Up MySQL
- Setting Up SQL Server
- Setting Up Oracle
- Setting Up Amazon DocumentDB
- Setting Up MongoDB
- Setting Up ClickHouse
- Connecting DBM and Traces
- Data Collected
- Exploring Database Hosts
- Exploring Query Metrics
- Exploring Query Samples
- Exploring Database Schemas
- Exploring Recommendations
- Troubleshooting
- Guides
- Data Streams Monitoring
- Data Observability
- Digital Experience
- Real User Monitoring
- Synthetic Testing and Monitoring
- Continuous Testing
- Experiments
- Product Analytics
- Session Replay
- Software Delivery
- CI Visibility
- CD Visibility
- Deployment Gates
- Test Optimization
- Code Coverage
- PR Gates
- DORA Metrics
- Feature Flags
- Developer Integrations
- Security
- Security Overview
- Cloud SIEM
- Code Security
- Cloud Security
- App and API Protection
- AI Guard
- Workload Protection
- Sensitive Data Scanner
- AI Observability
- Log Management
- Observability Pipelines
- Configuration
- Sources
- Processors
- Destinations
- Amazon OpenSearch
- Amazon S3
- Amazon Security Lake
- Azure Storage
- CrowdStrike NG-SIEM
- Datadog Archives
- Datadog CloudPrem
- Datadog Logs
- Datadog Metrics
- Elasticsearch
- Google Cloud Storage
- Google Pub/Sub
- Google SecOps
- HTTP Client
- Kafka
- Microsoft Sentinel
- New Relic
- OpenSearch
- SentinelOne
- Socket
- Splunk HEC
- Sumo Logic Hosted Collector
- Syslog
- Packs
- Akamai CDN
- Amazon CloudFront
- Amazon VPC Flow Logs
- AWS Application Load Balancer Logs
- AWS CloudTrail
- AWS Elastic Load Balancer Logs
- AWS Network Load Balancer Logs
- Cisco ASA
- Cloudflare
- F5
- Fastly
- Fortinet Firewall
- HAProxy Ingress
- Istio Proxy
- Juniper SRX Firewall Traffic Logs
- Netskope
- NGINX
- Okta
- Palo Alto Firewall
- Windows XML
- ZScaler ZIA DNS
- Zscaler ZIA Firewall
- Zscaler ZIA Tunnel
- Zscaler ZIA Web Logs
- Search Syntax
- Scaling and Performance
- Monitoring and Troubleshooting
- Guides and Resources
- Log Management
- CloudPrem
- Administration
Cisco Meraki


Meraki Device Explorer
Meraki Topology Map
Meraki Overview Dashboard
Overview
This integration provides comprehensive visibility into your Cisco Meraki Environment by collecting metrics for Network Device Monitoring, Network Event Logs, and Security Event Logs for Cloud SIEM.
Network Device Monitoring
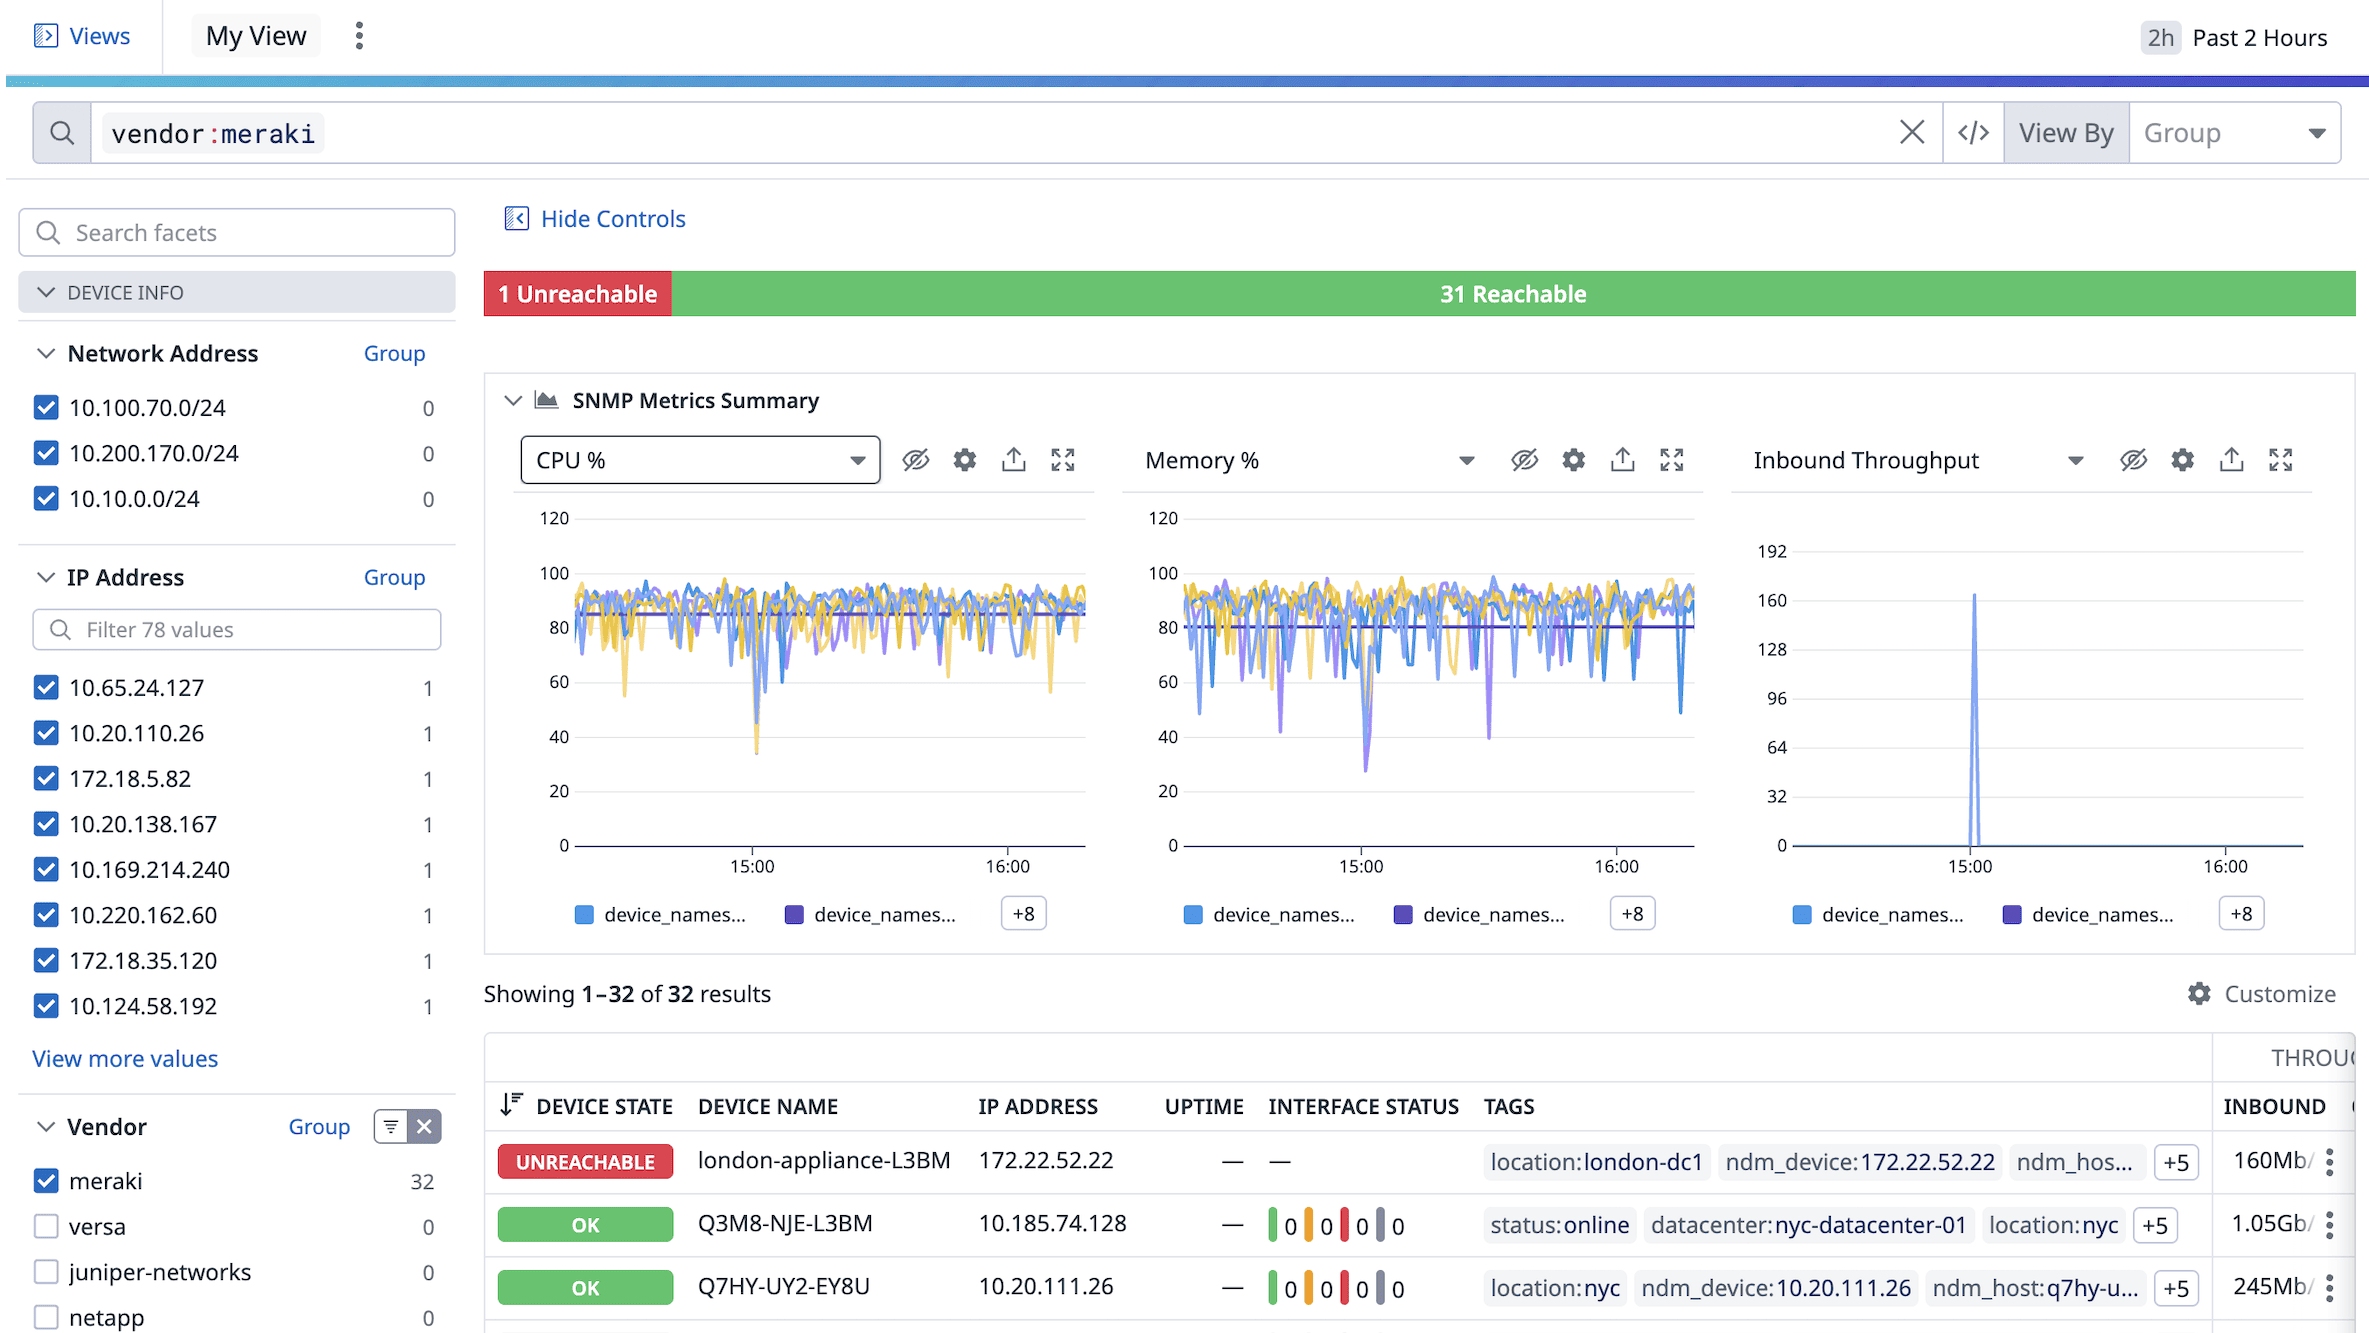
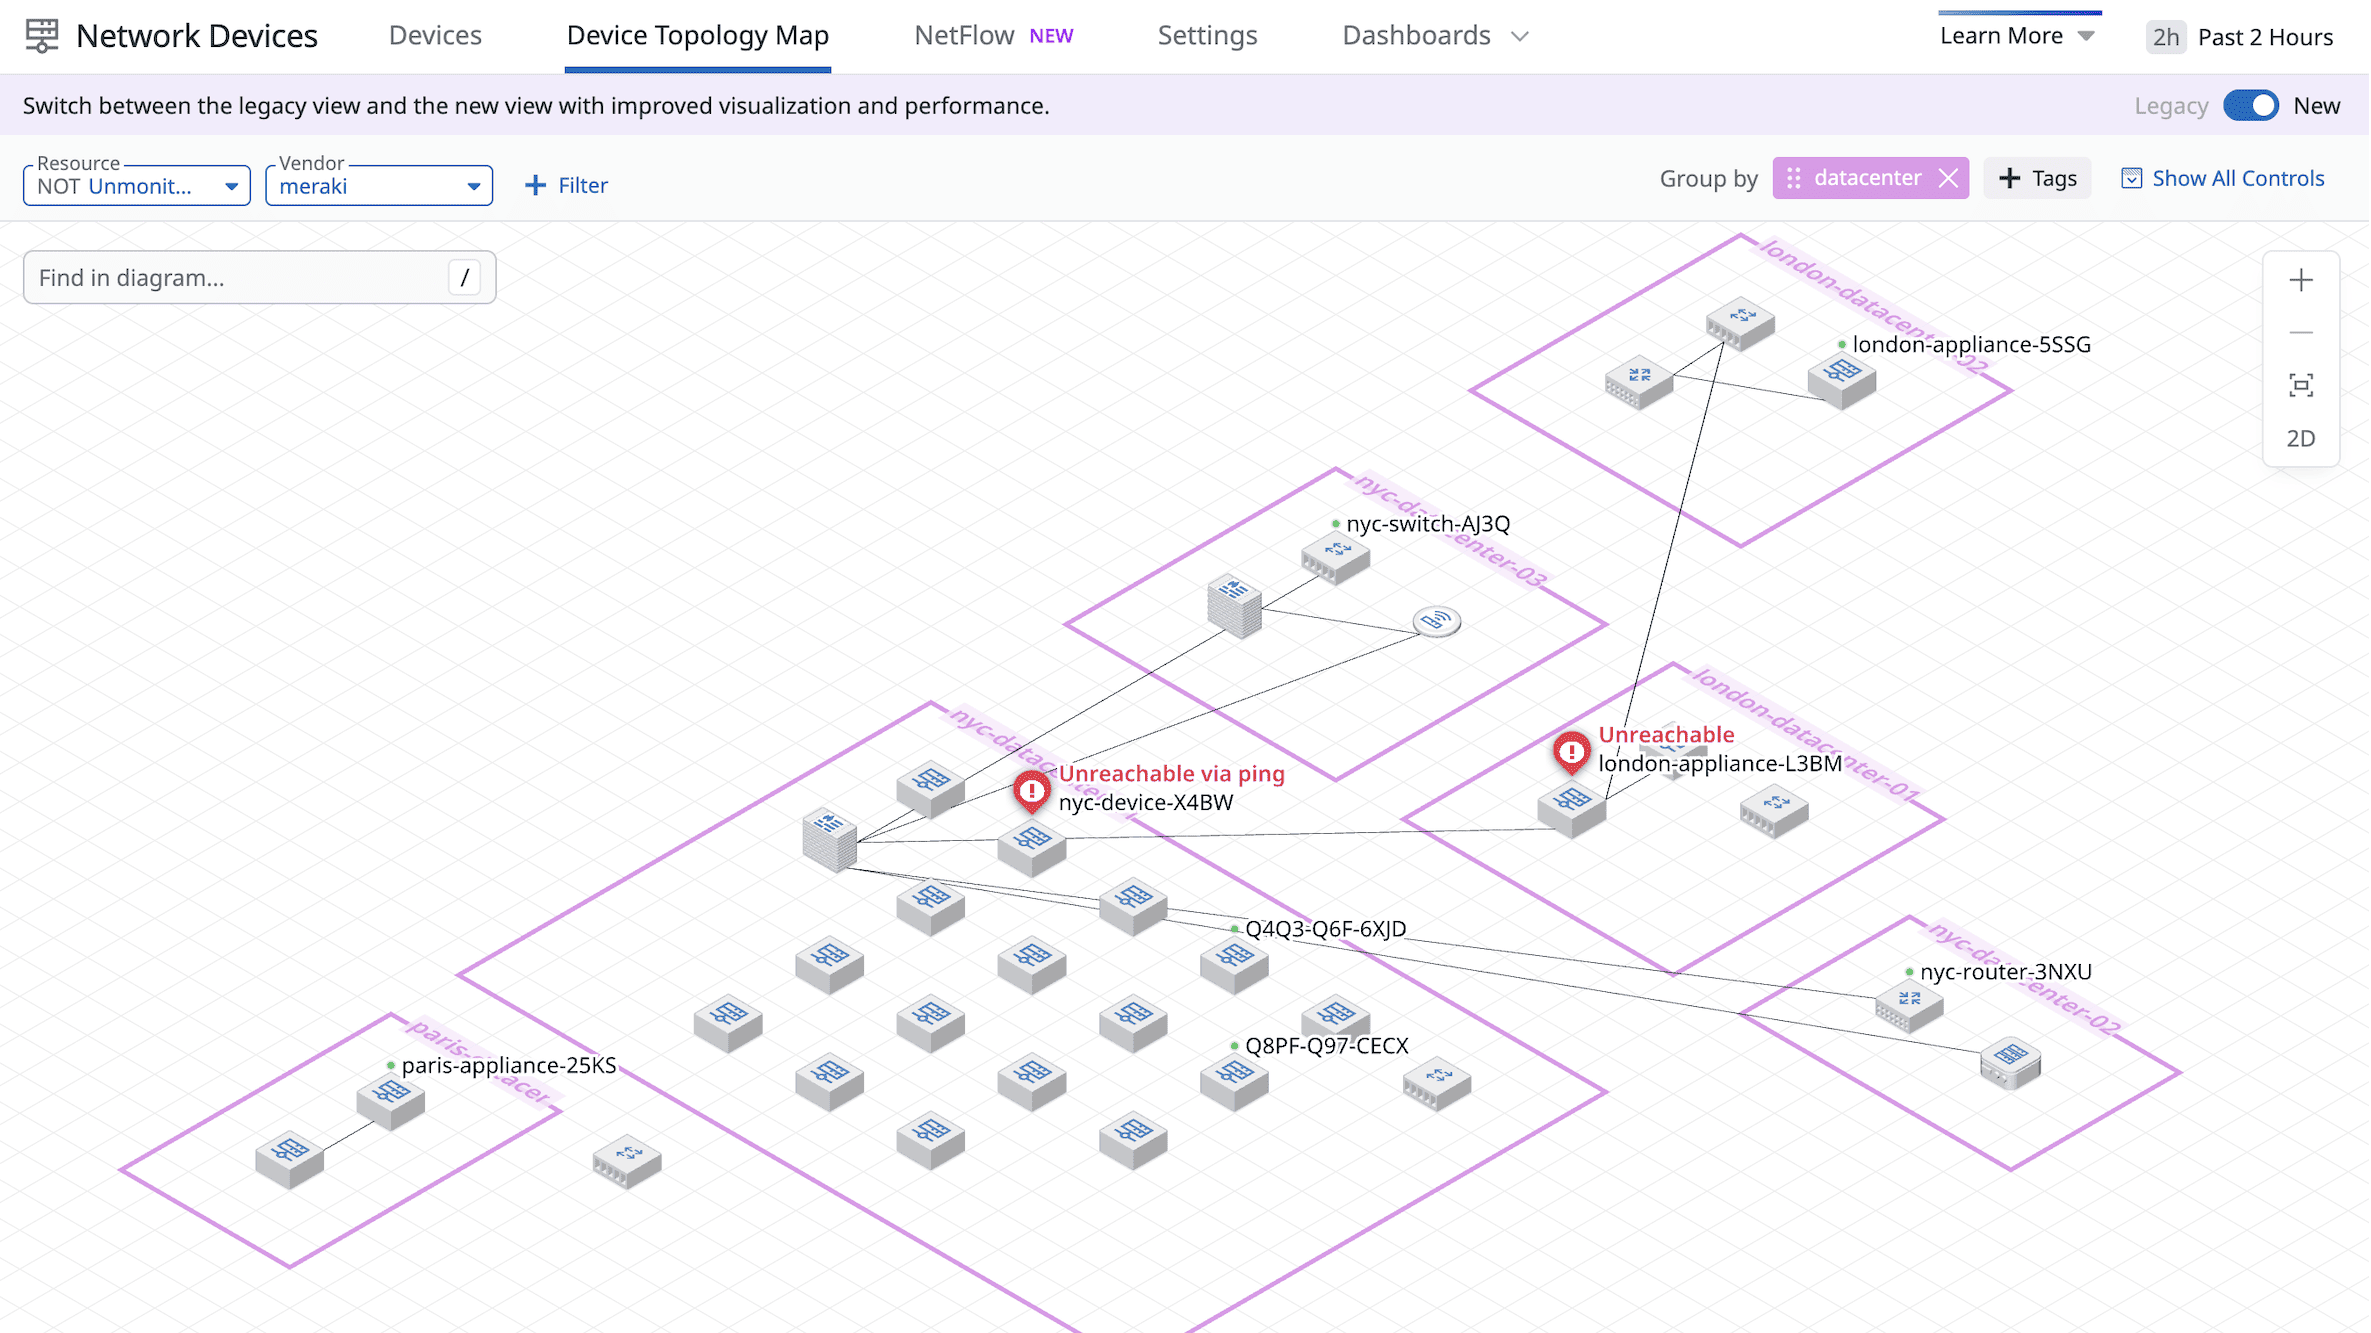
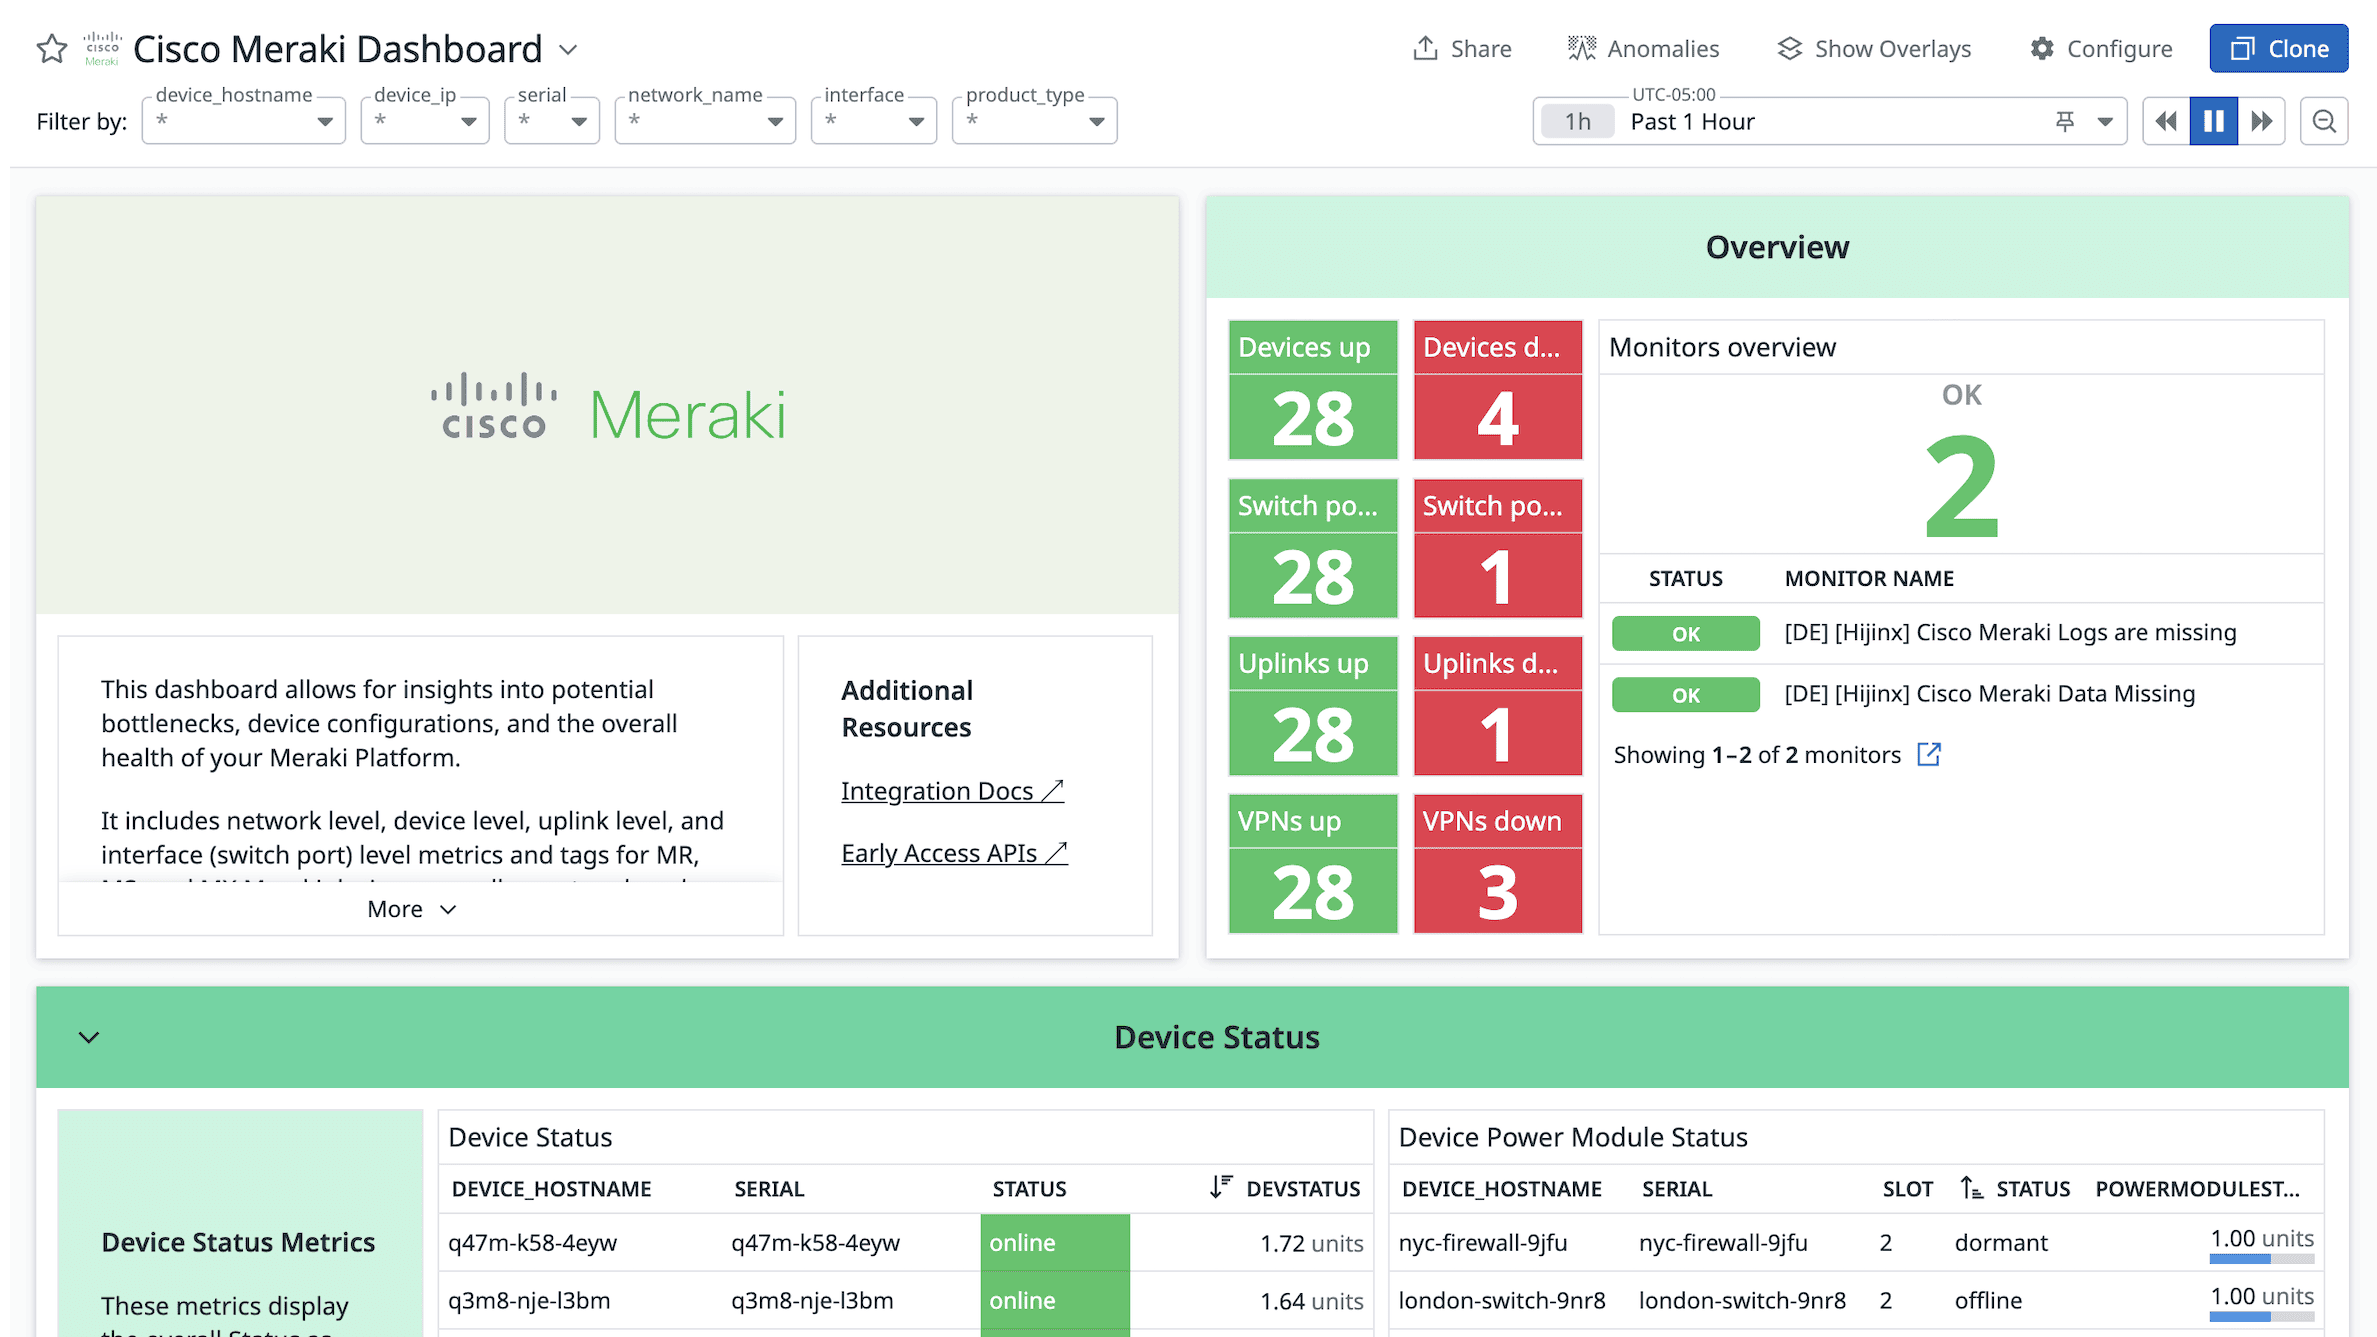
Network Device Monitoring helps ensure the overall health of network infrastructure is up to standard by identifying potential bottlenecks and device configuration errors.
This integration collects metrics for the following devices:
- MR (Wireless Access Points): Track metrics like client count, connection status, and throughput.
- MS (Switches): Monitor switch performance metrics such as port status, traffic, and error rates.
- MX (Security Appliances): Collect metrics on VPN status, firewall rules, and overall device performance.
This integration dynamically pulls in device tags and metadata from Meraki environments to easily drill down into specific device groups, locations, or device types.
Security Event Logs
Security Event Logs alert on events such as intrusion detections, firewall rule violations, and malware threat detections to helps identify and respond to potential security threats.
Create your own rules or leverage the out-of-the-box Cloud SIEM rules for real-time threat detection and incident response.
Network Event Logs
Network Event Logs help network administrators analyze historical network events and troubleshoot issues efficiently.
These logs track the following topics:
- Configuration Changes: Track changes in network configurations to ensure compliance and troubleshoot connection issues.
- Client Associations: Monitor client associations with wireless access points for user connectivity insights.
- Network Health Events: Identify and address issues affecting network health, such as high packet loss on specific switches.
In addition to the recommended monitors included with this integration, additional monitors can be configured to notify administrators of critical events, allowing for proactive network management.
To collect metrics from your Meraki Cloud Controller, configure the SNMP integration with the Meraki Profile.
Setup
Network Device Monitoring for Cisco Meraki is Generally Available. To learn more about billing implications, visit our pricing page.
Some NDM metrics require Early Access APIs to be enabled for your organization. For more information, visit the Meraki documentation.
Some NDM metrics require Early Access APIs to be enabled for your organization. For more information, visit the Meraki documentation.
Installation
- In the app, open the Meraki integration tile.
- Click + Add Account.
- Choose a name for your Meraki account.
- Add a Meraki API key. Find instructions on how to generate a Meraki API key in the Cisco Meraki Dashboard API.
Generate the Meraki API key
- Go to the Meraki Dashboard.
- Enable API access by going to Organization > Settings > Dashboard API access.
- Go to the My Profile page on the Meraki dashboard to generate the key.
You must allow-list certain IP address prefixes for Datadog to collect data from your Meraki account. You can find the list of IP prefixes belonging to Datadog in the IP ranges page, and the range to allow under webhooks.
Metric collection
To configure collection of NDM Metrics, an API key is required from Meraki.
Device Tag Filters
Device Tag Filters allow you to specify which devices to monitor within NDM. You can specify multiple tags by separating them with a comma. If no tags are specified, all devices will be monitored.
Log collection
To configure collection of network event logs and security event logs, an API key is required from Meraki.
For more information, see the Cisco Meraki Dashboard API.
Data Collected
Metrics
| meraki.avgLatencyMs (gauge) | The average network latency in Milliseconds. Shown as millisecond |
| meraki.clientCount (count) | The client count per network. Shown as unit |
| meraki.devStatus (count) | The status of the device. Shown as unit |
| meraki.latencyMs (gauge) | The latency of an uplink in Millseconds. This is only supported for MX devices. Shown as millisecond |
| meraki.lossPercent (gauge) | The loss percent of an uplink in a network. This is only supported for MX devices. Shown as percent |
| meraki.powerModuleStatus (count) | The power module status of a device. Shown as unit |
| meraki.uplinkStatus (count) | The status of an uplink on a device. This is only for MX, MG, Z series devices in the org. Shown as unit |
| meraki.utilization (count) | The channel utilization of an AP in a network. Shown as percent |
| meraki.utilization.non_wifi (count) | The non wifi channel utilization of an AP in a network. Shown as percent |
| meraki.utilization.wifi (count) | The wifi channel utilization of an AP in a network. Shown as percent |
| meraki.port.status (count) | The status of a port on a Meraki switch. Shown as unit |
| meraki.devPerformanceScore (gauge) | The device performance score. Shown as unit |
| snmp.devStatus (gauge) | The status of the device’s connection to the Meraki Cloud Controller Shown as unit |
| snmp.devClientCount (gauge) | The number of clients currently associated with the device Shown as unit |
| meraki.interface.sent (gauge) | The number of bytes sent for each uplink of a network. Shown as byte |
| meraki.interface.received (gauge) | The number of bytes received for each uplink of a network. Shown as byte |
| meraki.uplink.bytes_sent (count) | The number of bytes sent through an uplink. Shown as byte |
| meraki.uplink.bytes_received (count) | The number of bytes received through an uplink. Shown as byte |
| meraki.vpn.receivedInKb (gauge) | The number of kilobytes received for each uplink of a network. Shown as kilobyte |
| meraki.vpn.sentInKb (gauge) | The number of kilobytes sent for each uplink of a network. Shown as kilobyte |
| meraki.vpn.avgLossPercentage (gauge) | The average loss percentage of an uplink in a network. Shown as percent |
| meraki.vpn.minLossPercentage (gauge) | The minimum loss percentage of an uplink in a network. Shown as percent |
| meraki.vpn.maxLossPercentage (gauge) | The maximum loss percentage of an uplink in a network. Shown as percent |
| meraki.vpn.avgJitter (gauge) | The average jitter of an uplink in a network. Shown as millisecond |
| meraki.vpn.minJitter (gauge) | The minimum jitter of an uplink in a network. Shown as millisecond |
| meraki.vpn.maxJitter (gauge) | The maximum jitter of an uplink in a network. Shown as millisecond |
| meraki.vpn.avgMos (gauge) | The average mos of an uplink in a network. Shown as unit |
| meraki.vpn.minMos (gauge) | The minimum mos of an uplink in a network. Shown as unit |
| meraki.vpn.maxMos (gauge) | The maximum mos of an uplink in a network. Shown as unit |
| meraki.vpn.status (count) | The status of the VPN. Shown as unit |
| meraki.vpn.avgLatencyMs (gauge) | The average VPN network latency in Milliseconds. Shown as millisecond |
| meraki.vpn.maxLatencyMs (gauge) | The maximum VPN network latency in Milliseconds. Shown as millisecond |
| meraki.vpn.minLatencyMs (gauge) | The minimum VPN network latency in Milliseconds. Shown as millisecond |
Events
The Meraki integration does not include any events.
Service Checks
The Meraki integration does not include any service checks.
Troubleshooting
Datadog sometimes encounters issues accessing Meraki from its servers. Add Datadog’s IPs to your IP address allow list to ensure that crawling works as expected.
Need help? Contact Datadog support.
Further Reading
Additional helpful documentation, links, and articles:
