- Essentials
- Getting Started
- Agent
- API
- APM Tracing
- Containers
- Dashboards
- Database Monitoring
- Datadog
- Datadog Site
- DevSecOps
- Incident Management
- Integrations
- Internal Developer Portal
- Logs
- Monitors
- Notebooks
- OpenTelemetry
- Profiler
- Search
- Session Replay
- Security
- Serverless for AWS Lambda
- Software Delivery
- Synthetic Monitoring and Testing
- Tags
- Workflow Automation
- Learning Center
- Support
- Glossary
- Standard Attributes
- Guides
- Agent
- Integrations
- Extend Datadog
- Authorization
- DogStatsD
- Custom Checks
- Integrations
- Build an Integration with Datadog
- Create an Agent-based Integration
- Create an API-based Integration
- Create a Log Pipeline
- Integration Assets Reference
- Build a Marketplace Offering
- Create an Integration Dashboard
- Create a Monitor Template
- Create a Cloud SIEM Detection Rule
- Install Agent Integration Developer Tool
- Service Checks
- Community
- Guides
- OpenTelemetry
- Administrator's Guide
- API
- Partners
- Datadog Mobile App
- DDSQL Reference
- CoScreen
- CoTerm
- Remote Configuration
- Cloudcraft (Standalone)
- In The App
- Dashboards
- Notebooks
- DDSQL Editor
- Reference Tables
- Sheets
- Monitors and Alerting
- Service Level Objectives
- Metrics
- Watchdog
- Bits AI
- Internal Developer Portal
- Error Tracking
- Change Tracking
- Event Management
- Incident Response
- Actions & Remediations
- Infrastructure
- Cloudcraft
- Resource Catalog
- Universal Service Monitoring
- End User Device Monitoring
- Hosts
- Containers
- Processes
- Serverless
- Network Monitoring
- Storage Management
- Cloud Cost
- Application Performance
- APM
- Continuous Profiler
- Database Monitoring
- Agent Integration Overhead
- Setup Architectures
- Setting Up Postgres
- Setting Up MySQL
- Setting Up SQL Server
- Setting Up Oracle
- Setting Up Amazon DocumentDB
- Setting Up MongoDB
- Setting Up ClickHouse
- Connecting DBM and Traces
- Data Collected
- Exploring Database Hosts
- Exploring Query Metrics
- Exploring Query Samples
- Exploring Database Schemas
- Exploring Recommendations
- Troubleshooting
- Guides
- Data Streams Monitoring
- Data Observability
- Digital Experience
- Real User Monitoring
- Synthetic Testing and Monitoring
- Continuous Testing
- Product Analytics
- Session Replay
- Software Delivery
- CI Visibility
- CD Visibility
- Deployment Gates
- Test Optimization
- Code Coverage
- PR Gates
- DORA Metrics
- Feature Flags
- Developer Integrations
- Security
- Security Overview
- Cloud SIEM
- Code Security
- Cloud Security
- App and API Protection
- AI Guard
- Workload Protection
- Sensitive Data Scanner
- AI Observability
- Log Management
- Observability Pipelines
- Configuration
- Sources
- Processors
- Destinations
- Packs
- Akamai CDN
- Amazon CloudFront
- Amazon VPC Flow Logs
- AWS Application Load Balancer Logs
- AWS CloudTrail
- AWS Elastic Load Balancer Logs
- AWS Network Load Balancer Logs
- Cisco ASA
- Cloudflare
- F5
- Fastly
- Fortinet Firewall
- HAProxy Ingress
- Istio Proxy
- Juniper SRX Firewall Traffic Logs
- Netskope
- NGINX
- Okta
- Palo Alto Firewall
- Windows XML
- ZScaler ZIA DNS
- Zscaler ZIA Firewall
- Zscaler ZIA Tunnel
- Zscaler ZIA Web Logs
- Search Syntax
- Scaling and Performance
- Monitoring and Troubleshooting
- Guides and Resources
- Log Management
- CloudPrem
- Administration
- Account Management
- Data Security
- Help
Atturra AtomWatch
Supported OS
Integration version1.6.0
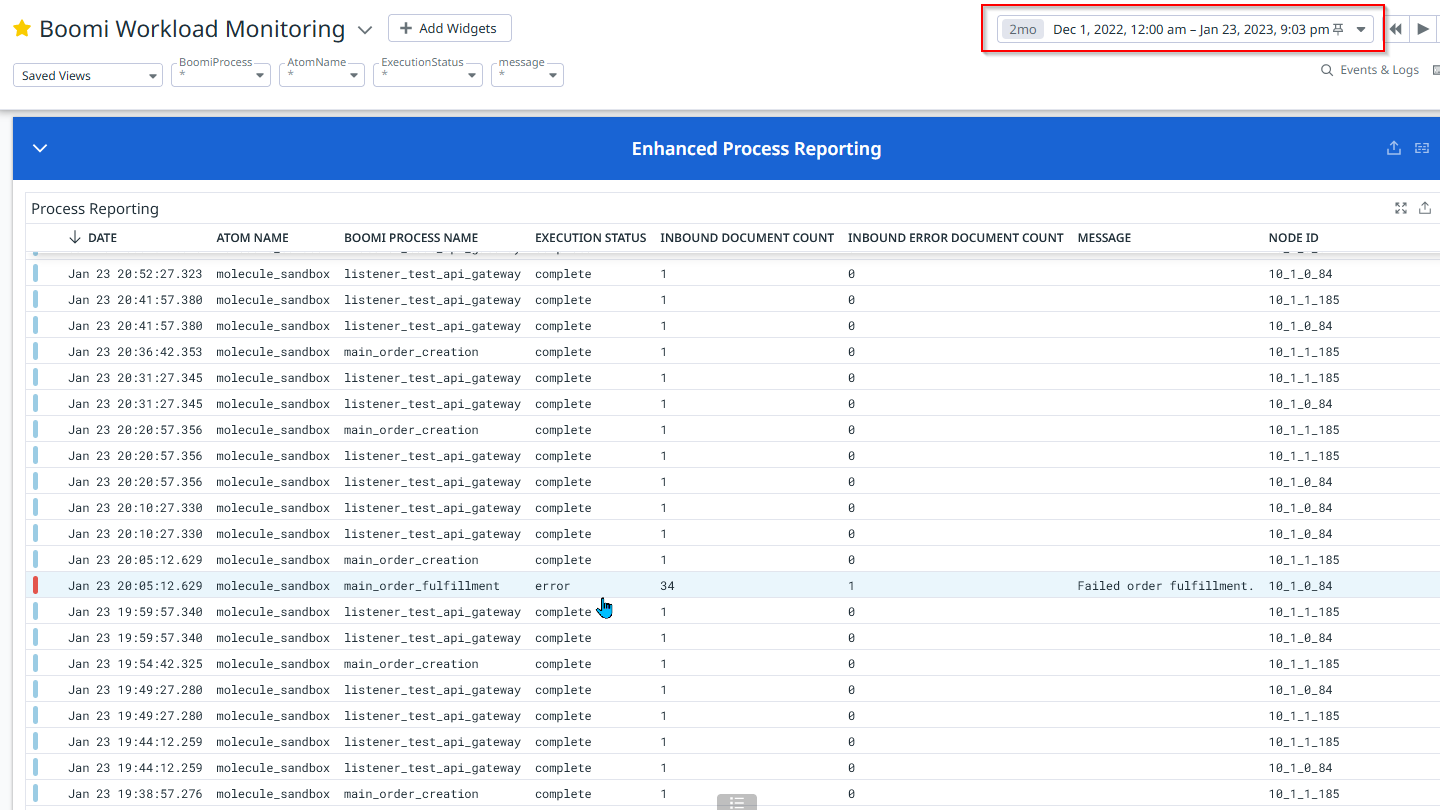
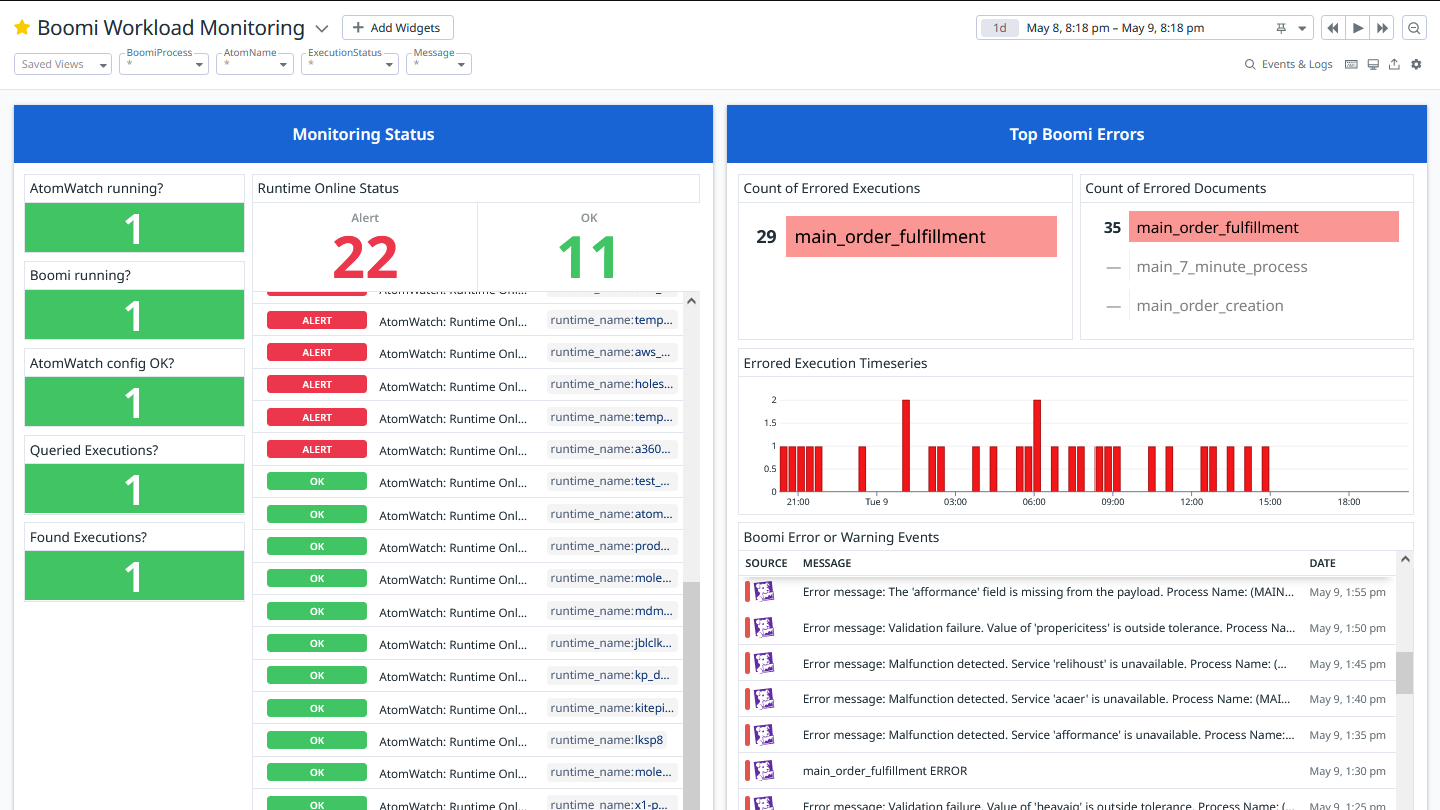
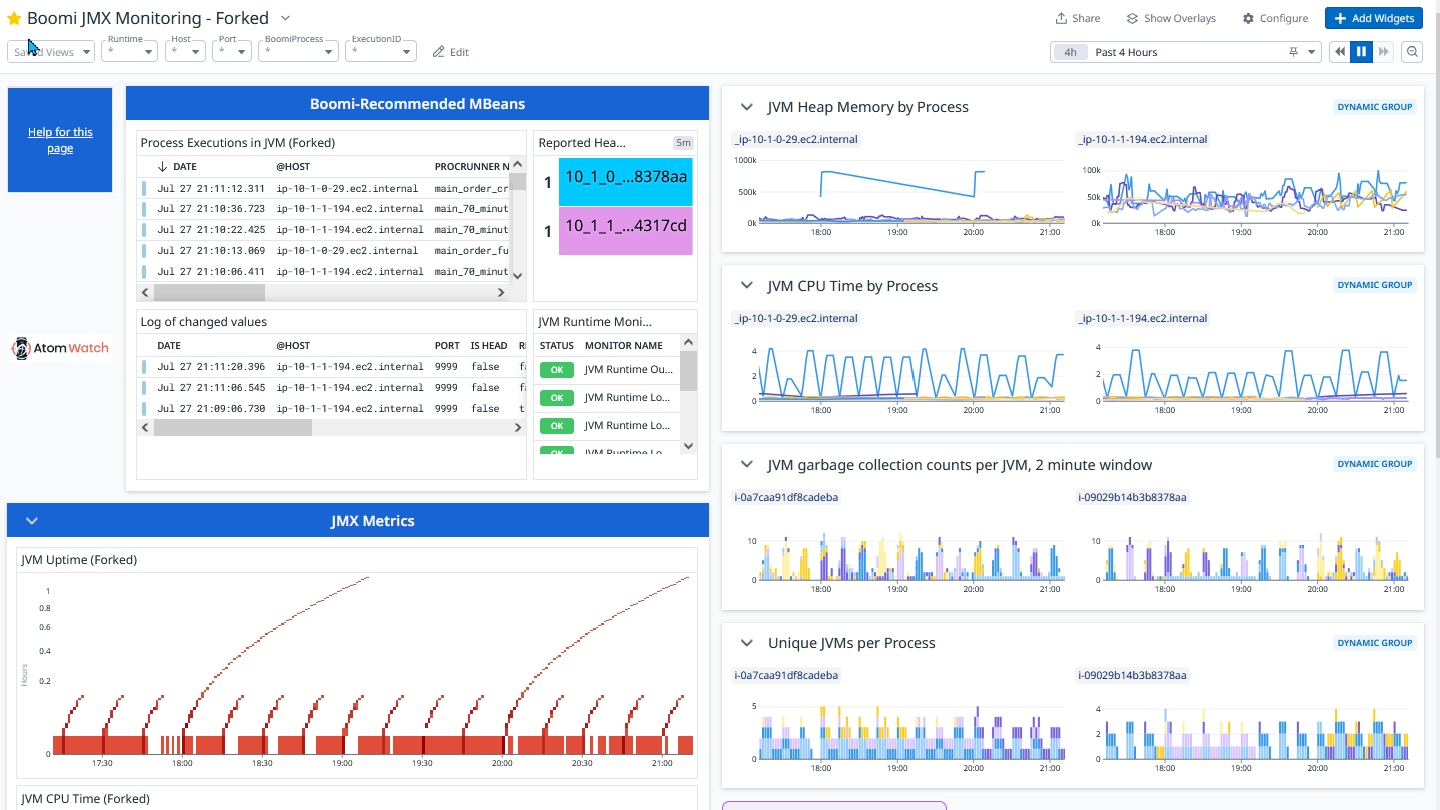
Enhanced Process Reporting lets you look back more than 30 days and filter by more fields, with wildcards.
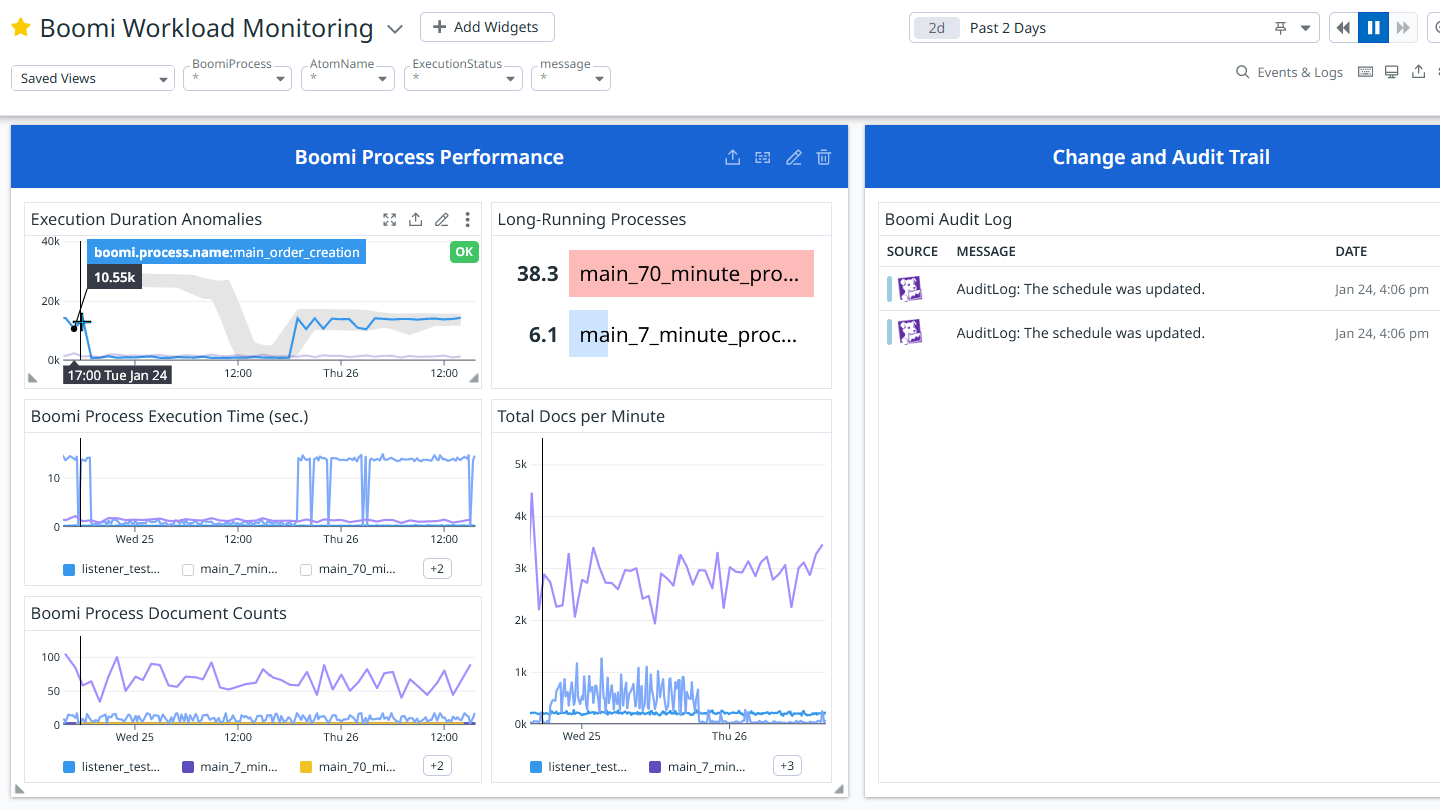
See long-running processes at a glance and receive alerts with anomaly detection.
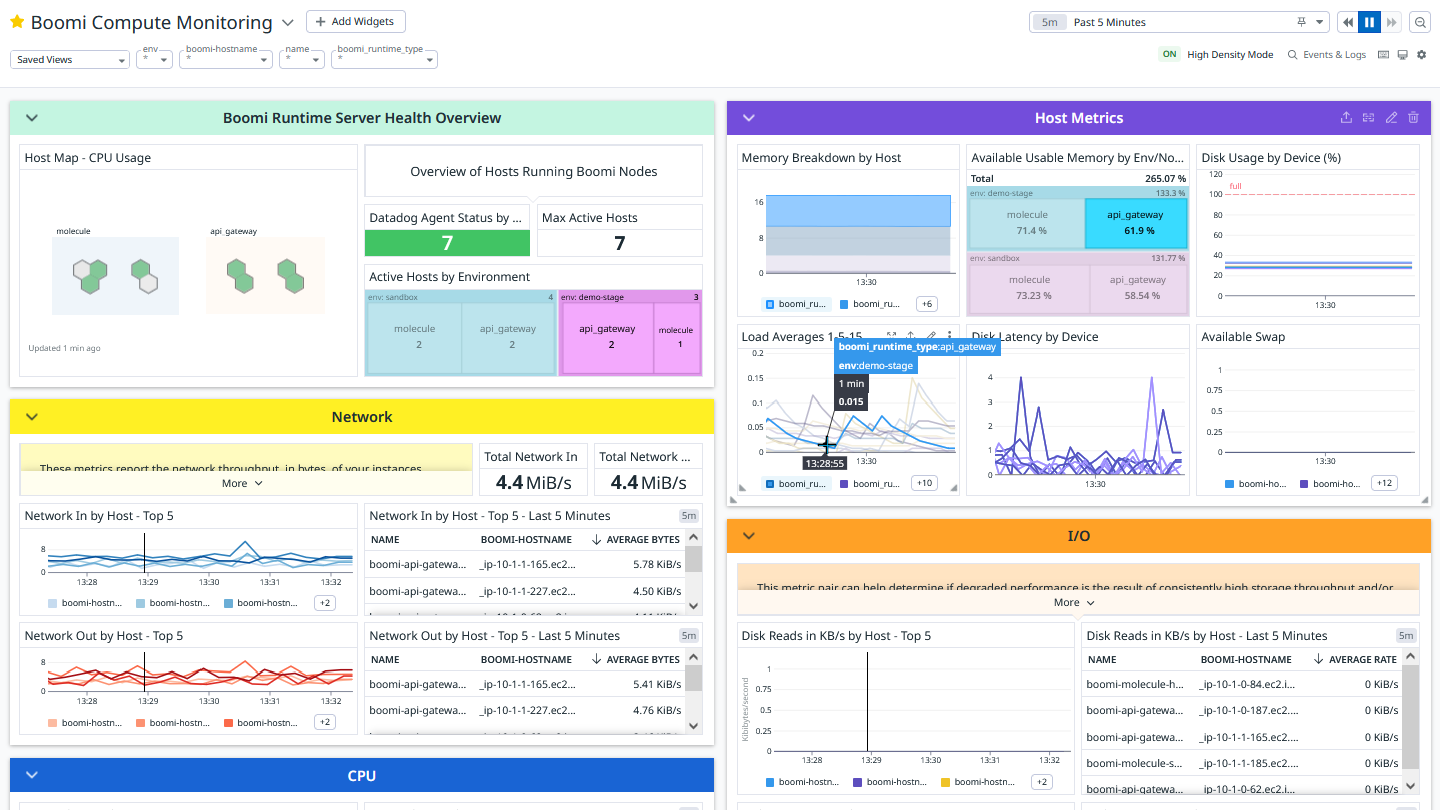
Extensive infrastructure monitoring including CPU, RAM, Disk, Network.
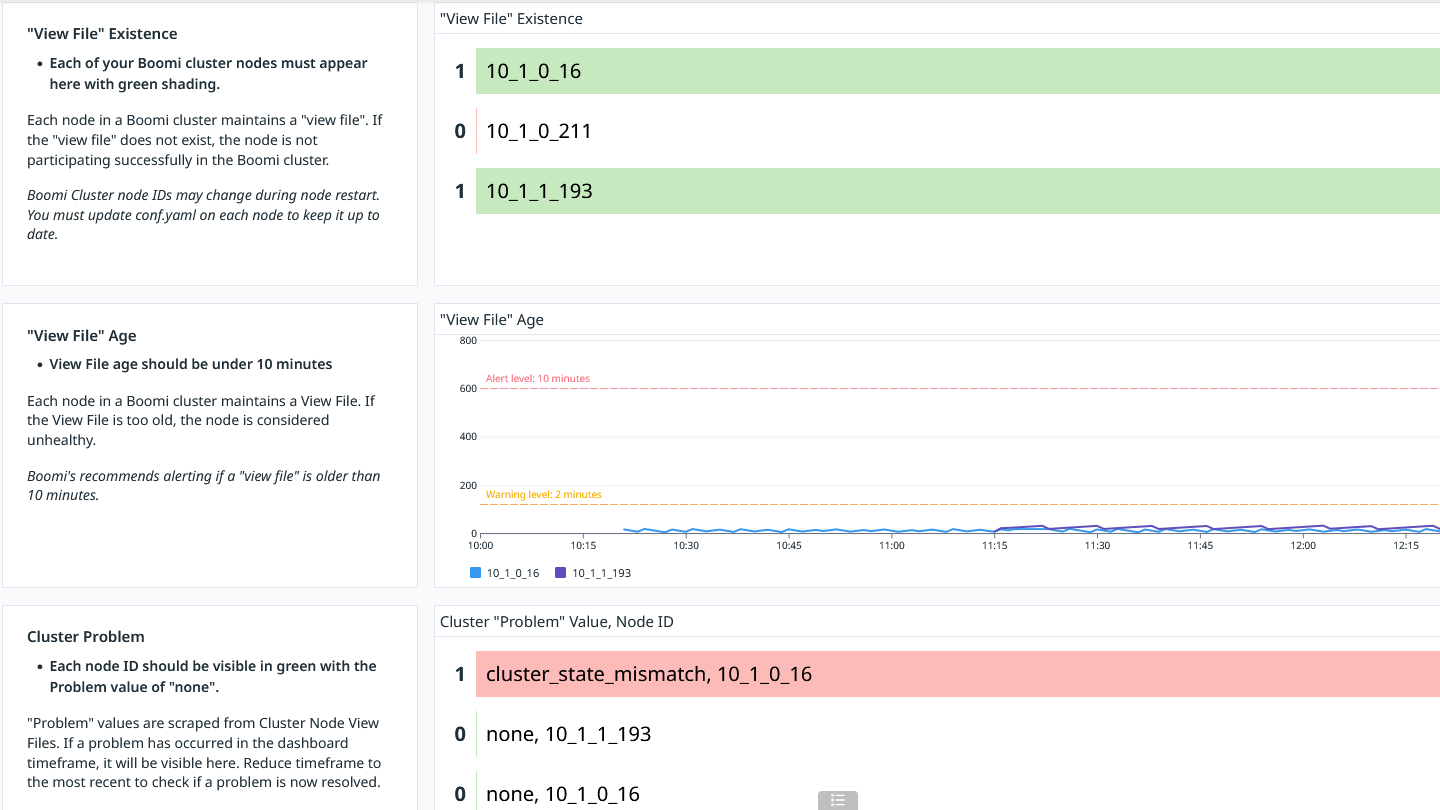
Cluster monitoring that exceeds Boomi's published recommendations.
Toplists and graphs of errored Boomi processes.
Supports JMX Monitoring.
Overview
AtomWatch offers a comprehensive solution for real-time performance tracking of Boomi Atoms, Molecules, and Private Clouds. AtomWatch supports Boomi operating on the Linux OS only, a best practice for the Boomi runtime in on-premises, cloud, or hybrid customer environments.
Key capabilities:
- Real-Time JVM Monitoring: Detailed visibility into Boomi Node performance through Heap and Thread monitoring.
- Process-Level Metrics: Track and analyze resource loads at the individual process level, allowing for targeted diagnostics.
- Actionable Insights: Diagnose performance issues and optimize Boomi runtimes with unparalleled data precision.
This integration includes 8 dashboards, 17 custom metrics, and 16 monitors that report on Boomi execution statistics, cluster status, JMX monitoring, and infrastructure health. AtomWatch allows Boomi developers and teams to gain deep insights into the health and efficiency of their Boomi integrations, enabling them to maintain smooth operations, prevent downtimes, and improve overall system performance.
About Atturra
Atturra is a Boomi Platinum Partner with an expert global team who acquired Kitepipe in 2025. Now as Atturra North America, we are a full-service provider for full-platform process development, offering a global 24/7 support experience and a Boomi hosting, monitoring, and management solution. The experience of helping over 700 clients in ANZ and Asia, along with US operations since 2011, makes us a reliable partner adhering to global standards with local expertise.
Log Collection
This integration makes API calls to the Boomi Platform on your behalf, retrieving execution records and sending them to Datadog as logs. It also optionally monitors in-progress executions and JVM telemetry through JMX, sending this information to Datadog as logs. You can see which Boomi processes are running in which JVMs, along with associated metrics such as memory usage, garbage collection, thread count, and more.
Container logs
To configure the Datadog Agent to ship Boomi container logs to your Datadog account, perform these steps on each molecule node:
- Create the following file at
/etc/datadog-agent/conf.d/BoomiContainerLog.d/conf.yaml, replacing<BRACKETED_VALUES>with appropriate values for your setup:
Note: For more information about the conf.d location on different operating systems, see Agent configuration directory.
---
logs:
  - type: file
    path: <BOOMI_INSTALL_DIR>/logs/*.container.<BOOMI_NODE_ID>.log
    service: BoomiContainerLog
    source: kitepipe-boomi
    log_processing_rules:
      - type: multi_line
        name: multi_line_rule
        pattern: \w+ \d+, \d+ \d+:\d+:\d+ (AM|PM)
In the
datadog.yamlfile, ensure the following line is present and uncommented:logs_enabled: true
HTTP logs:
To configure the Datadog Agent to ship Boomi HTTP logs to your Datadog account, perform these steps on each molecule node:
Create the following file at
/etc/datadog-agent/conf.d/BoomiHTTPLog.d/conf.yaml(or equivalent Windows location), replacing<BRACKETED_VALUES>with appropriate values for your setup.--- logs: - type: file path: <BOOMI_INSTALL_DIR>/logs/*.shared_http_server.<BOOMI_NODE_ID>.log service: BoomiHTTP source: kitepipe-boomi log_processing_rules: - type: exclude_at_match name: exclude_healthcheck pattern: _admin/statusIn the
datadog.yaml file, ensure the following line is present and uncommented:logs_enabled: true
Events
This integration retrieves AuditLog records from the Boomi API, and sends them to Datadog as events. The events are visible in filtered form in the Boomi Workload Monitoring Dashboard or in the Events Explorer. You can build your own monitors to inspect the unfiltered AuditLog records.
Metrics
| kitepipe.atomwatch.execution.status (count) | Tracks how many Boomi executions have occurred as well as their status. |
| kitepipe.atomwatch.execution.measure.inboundDocumentCount (gauge) | Boomi ExecutionRecord “inboundDocumentCount” value. |
| kitepipe.atomwatch.execution.measure.inboundErrorDocumentCount (gauge) | Boomi ExecutionRecord “inboundErrorDocumentCount” value. |
| kitepipe.atomwatch.execution.measure.outboundDocumentCount (gauge) | Boomi ExecutionRecord “outboundDocumentCount” value. |
| kitepipe.atomwatch.execution.measure.duration (gauge) | Boomi ExecutionRecord “executionDuration” value. Shown as millisecond |
| kitepipe.atomwatch.execution.measure.inboundDocumentSize (gauge) | Boomi ExecutionRecord “inboundDocumentSize” value. Shown as byte |
| kitepipe.atomwatch.execution.measure.outboundDocumentSize (gauge) | Boomi ExecutionRecord “outboundDocumentSize” value. Shown as byte |
| kitepipe.atomwatch.execution.measure.inProgressExecutionDuration (gauge) | Records how many minutes a Boomi process has been running, if it is still in progress at the moment that the Datadog integration ran. Shown as minute |
| kitepipe.atomwatch.boomi_api_calls_attempted (count) | How many Boomi API calls of any type have been made. |
| kitepipe.atomwatch.view_file_exist (gauge) | Value of 1 if view file exists. |
| kitepipe.atomwatch.view_file_age_seconds (gauge) | Time in seconds since last update of the view file. Shown as second |
| kitepipe.atomwatch.view_file_problem (gauge) | Tracks occurrence of Boomi cluster View File problems. Value of 1 if view file contents indicate cluster problem. |
| kitepipe.atomwatch.integration_completed (gauge) | Tracks successful completion of a AtomWatch integration run. Value of 1 if integration completed successfully. |
| kitepipe.atomwatch.jvm.cpu_time_ms (gauge) | JVM CPU time consumed |
| kitepipe.atomwatch.jvm.heap.memory (gauge) | JVM heap memory |
| kitepipe.atomwatch.jvm.runtime_out_of_memory (gauge) | JVM out of memory condition |
| kitepipe.atomwatch.jvm.runtime_low_memory (gauge) | JVM low memory condition |
Data Collected
Metrics
Service Checks
kitepipe.atomwatch.skipped_molecule_view_file
Returns OK if Agent has skipped checking a molecule view file during latest run.
Statuses: ok
kitepipe.atomwatch.skipped_api_gateway_view_file
Returns OK if Agent has skipped checking an API Gateway view file during latest run.
Statuses: ok
kitepipe.atomwatch.checked_molecule_view_file
Returns OK if Agent checked a molecule view file during latest run. Returns CRITICAL if unable to complete the check.
Statuses: ok, critical
kitepipe.atomwatch.checked_api_gateway_view_file
Returns OK if Agent checked an API Gateway view file during latest run. Returns CRITICAL if unable to complete the check.
Statuses: ok, critical
kitepipe.atomwatch.config_validated
Returns OK if Agent was able to validate configuration.
Statuses: ok
kitepipe.atomwatch.datetime_range_set_up
Returns OK if Agent was able to set up datetime range for making Boomi API calls.
Statuses: ok
kitepipe.atomwatch.boomi_api_calls_permitted
Returns OK if Boomi API calls will be attempted (and not skipped) on this run.
Statuses: ok
kitepipe.atomwatch.skipping_boomi_api_calls
Returns OK if Agent declined to attempt Boomi API calls because it was too soon since last API call.
Statuses: ok
kitepipe.atomwatch.completed
Returns OK if Agent has completed all AtomWatch checks. Returns CRITICAL if unable to complete successfully and WARNING if there were failures querying Boomi Platform API.
Statuses: ok, warning, critical
kitepipe.atomwatch.persisted_end_datetime
Returns OK if AtomWatch persisted the last used end datetime.
Statuses: ok
kitepipe.atomwatch.queried_boomi_executions
Returns OK if Agent called the Boomi ExecutionRecord API on this run. Returns CRITICAL if tried and failed to call API.
Statuses: ok, critical
kitepipe.atomwatch.found_boomi_executions
Returns OK if Agent queried Boomi ExecutionRecord API and found records in target date range.
Statuses: ok
kitepipe.atomwatch.submitted_execution_metrics
Returns OK if Agent submitted metrics on this run, derived from Boomi ExecutionRecord API calls.
Statuses: ok
kitepipe.atomwatch.submitted_execution_logs
Returns OK if Agent was able to submit Boomi execution-record logs (not process logs) to Datadog.
Statuses: ok
kitepipe.atomwatch.queried_boomi_auditlogs
Returns OK if Agent called the Boomi AuditLog API on this run. Returns CRITICAL if tried and failed to call API.
Statuses: ok, critical
kitepipe.atomwatch.found_boomi_auditlogs
Returns OK if Agent queried the Boomi AuditLog API and found records in target date range.
Statuses: ok
kitepipe.atomwatch.submitted_auditlog_events
Returns OK if Agent submitted events on this run, derived from Boomi AuditLog API calls.
Statuses: ok
kitepipe.atomwatch.queried_boomi_events
Returns OK if Agent called the Boomi Events API on this run. Returns CRITICAL if tried and failed to call API.
Statuses: ok, critical
kitepipe.atomwatch.found_boomi_events
Returns OK if Agent queried the Boomi Events API and found records in target date range.
Statuses: ok
kitepipe.atomwatch.submitted_boomievent_events
Returns OK if Agent submitted events on this run, derived from Boomi Event API calls.
Statuses: ok
kitepipe.atomwatch.used_default_last_end_datetime
Returns warning if Agent could not parse Last End Datetime from file and had to use default value.
Statuses: warning
kitepipe.atomwatch.longrunning_execution_failed_metric_submission
Returns warning if Agent could not submit metrics showing the name and duration of a long-running Boomi process.
Statuses: warning
kitepipe.atomwatch.boomi_daemon_running
Returns OK if Boomi daemon is running. Returns Critical if verified that Boomi daemon is NOT running.
Statuses: ok, critical
kitepipe.atomwatch.runtime_reported_online
Returns OK if Boomi datacenter reports the runtime (atom, molecule, or API gateway) as online; else returns Critical
Statuses: ok, critical
kitepipe.atomwatch.jmx_monitoring
Returns OK for success. Returns Critical for failure
Statuses: ok, critical
Support
For support or feature requests, reach out to AtomWatch through the following channel:
Atturra support hours for AtomWatch are designated during the business hours of 9AM to 3PM across US and Canadian time zones. AtomWatch troubleshooting requests will be answered within 24 to 48 hours from the notification receipt to the AtomWatch email alias.
For best response results, include the customer name, Boomi configuration, and a brief description of the event or troubleshooting question. Enhanced support programs are available from Atturra upon request.
This application is made available through the Marketplace and is supported by a Datadog Technology Partner. Click Here to purchase this application.
Further Reading
Additional helpful documentation, links, and articles:
