- Essentials
- Getting Started
- Agent
- API
- APM Tracing
- Containers
- Dashboards
- Database Monitoring
- Datadog
- Datadog Site
- DevSecOps
- Incident Management
- Integrations
- Internal Developer Portal
- Logs
- Monitors
- OpenTelemetry
- Profiler
- Session Replay
- Security
- Serverless for AWS Lambda
- Software Delivery
- Synthetic Monitoring and Testing
- Tags
- Workflow Automation
- Learning Center
- Support
- Glossary
- Standard Attributes
- Guides
- Agent
- Integrations
- Developers
- Authorization
- DogStatsD
- Custom Checks
- Integrations
- Build an Integration with Datadog
- Create an Agent-based Integration
- Create an API-based Integration
- Create a Log Pipeline
- Integration Assets Reference
- Build a Marketplace Offering
- Create an Integration Dashboard
- Create a Monitor Template
- Create a Cloud SIEM Detection Rule
- Install Agent Integration Developer Tool
- Service Checks
- IDE Plugins
- Community
- Guides
- OpenTelemetry
- Administrator's Guide
- API
- Partners
- Datadog Mobile App
- DDSQL Reference
- CoScreen
- CoTerm
- Remote Configuration
- Cloudcraft (Standalone)
- In The App
- Dashboards
- Notebooks
- DDSQL Editor
- Reference Tables
- Sheets
- Monitors and Alerting
- Watchdog
- Metrics
- Bits AI
- Internal Developer Portal
- Error Tracking
- Change Tracking
- Service Management
- Actions & Remediations
- Infrastructure
- Cloudcraft
- Resource Catalog
- Universal Service Monitoring
- Hosts
- Containers
- Processes
- Serverless
- Network Monitoring
- Cloud Cost
- Application Performance
- APM
- APM Terms and Concepts
- Application Instrumentation
- APM Metrics Collection
- Trace Pipeline Configuration
- Correlate Traces with Other Telemetry
- Trace Explorer
- Recommendations
- Code Origin for Spans
- Service Observability
- Endpoint Observability
- Dynamic Instrumentation
- Live Debugger
- Error Tracking
- Data Security
- Guides
- Troubleshooting
- Continuous Profiler
- Database Monitoring
- Agent Integration Overhead
- Setup Architectures
- Setting Up Postgres
- Setting Up MySQL
- Setting Up SQL Server
- Setting Up Oracle
- Setting Up Amazon DocumentDB
- Setting Up MongoDB
- Connecting DBM and Traces
- Data Collected
- Exploring Database Hosts
- Exploring Query Metrics
- Exploring Query Samples
- Exploring Database Schemas
- Exploring Recommendations
- Troubleshooting
- Guides
- Data Streams Monitoring
- Data Jobs Monitoring
- Data Observability
- Digital Experience
- Real User Monitoring
- Synthetic Testing and Monitoring
- Continuous Testing
- Product Analytics
- Software Delivery
- CI Visibility
- CD Visibility
- Deployment Gates
- Test Optimization
- Code Coverage
- Quality Gates
- DORA Metrics
- Security
- Security Overview
- Cloud SIEM
- Code Security
- Cloud Security
- App and API Protection
- Workload Protection
- Sensitive Data Scanner
- AI Observability
- Log Management
- Observability Pipelines
- Log Management
- CloudPrem
- Administration
Kubernetes
Join an enablement webinar session
This foundation enablement session will focus on how Datadog can monitor Kubernetes. Learn how to configure Datadog for Kubernetes and how to get started. Explore the various views and tools Datadog offers to visualize and analyze your cluster and application metrics, traces, and logs.
Agent installation
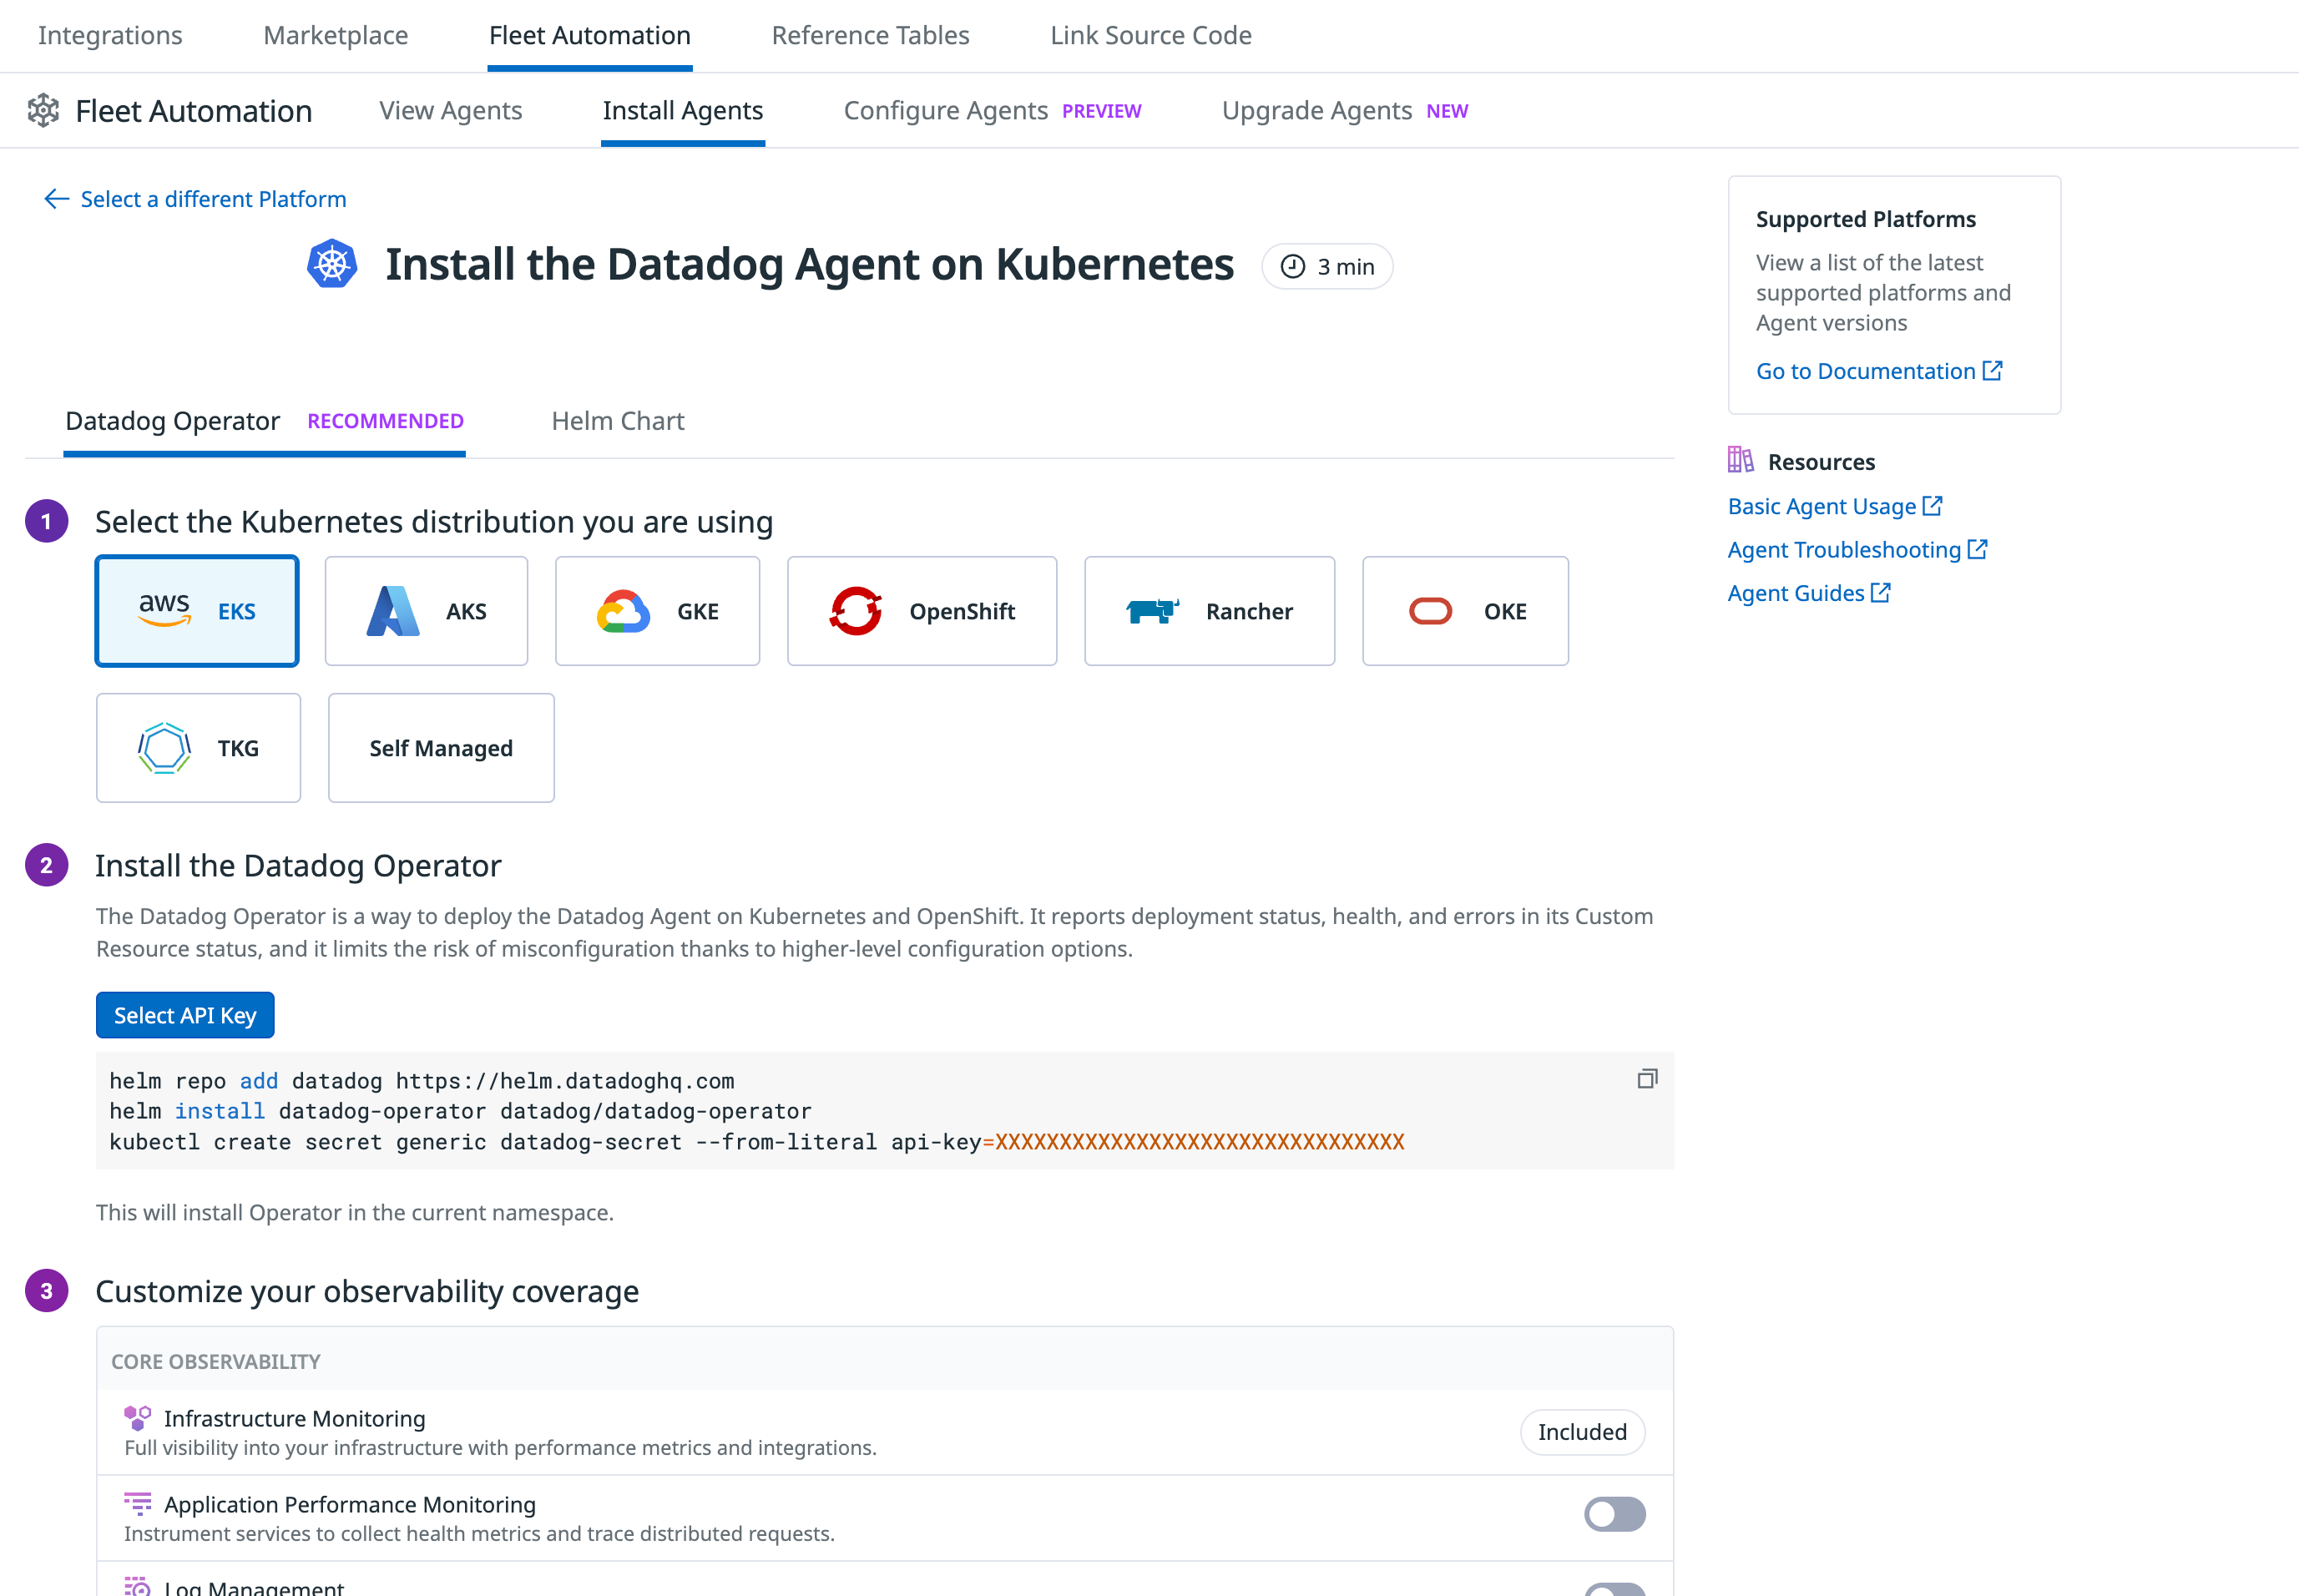
You can install the Agent using either the Datadog Operator or Helm chart by following the in-app installation guide in Fleet Automation. This guided interface allows you to:
- Select your Kubernetes distribution (for example EKS, AKS, or GKE)
- Generate helm and kubectl commands with your API key prefilled
- Enable features such as APM, Log Management, tagging and other telemetry through UI-based configuration
The Datadog Operator flow installs the Datadog Operator and uses Custom Resources to configure observability coverage.
The Helm Chart flow installs the Agent using DaemonSet and offers similar toggles for observability features.
See Supported Versions for the full list of Kubernetes versions supported by the Datadog Agent.
Manual installation
For manually install your Agent on Kubernetes, follow the Manually install and configure the Datadog Agent with a DaemonSet
For Agent commands, see the Agent Commands guides. For information on the Datadog Cluster Agent, see Cluster Agent for Kubernetes.
<CLUSTER_NAME> allows you to scope hosts and Cluster Checks. This unique name must be dot-separated tokens and abide by the following restrictions:
- Must only contain lowercase letters, numbers, and hyphens
- Must start with a letter
- Must end with a number or a letter
- Must be less than or equal to 80 characters
Additional configuration
Unprivileged installation
To run an unprivileged installation, add the following to datadog-agent.yaml:
apiVersion: datadoghq.com/v2alpha1
kind: DatadogAgent
metadata:
  name: datadog
spec:
  global:
    clusterName: <CLUSTER_NAME>
    site: <DATADOG_SITE>
    credentials:
      apiSecret:
        secretName: datadog-secret
        keyName: api-key
agent:
  config:
    securityContext:
      runAsUser: <USER_ID>
      supplementalGroups:
- <GROUP_ID>- Replace
<USER_ID>with the UID to run the Datadog Agent. Datadog recommends setting this value to 100 since Datadog Agent v7.48+. - Replace
<GROUP_ID>with the group ID that owns the Docker or containerd socket.
Then, deploy the Agent:
kubectl apply -f datadog-agent.yaml
To run an unprivileged installation, add the following to your datadog-values.yaml file:
datadog:
  apiKeyExistingSecret: datadog-secret
  site: <DATADOG_SITE>
  securityContext:
      runAsUser: <USER_ID>
      supplementalGroups:
- <GROUP_ID>- Replace
<USER_ID>with the UID to run the Datadog Agent. - Replace
<GROUP_ID>with the group ID that owns the Docker or containerd socket.
Then, deploy the Agent:
helm install datadog-agent -f datadog-values.yaml datadog/datadog
Select container registries
The in-app UI lets you select the container image registry, defaulting to gcr.io/datadoghq. If Artifact Registry is not accessible in your deployment region, use another registry such as:
public.ecr.aws/datadog(recommended for deploying the Agent in an AWS environment)datadoghq.azurecr.iodocker.io/datadog(can be subject to rate limits unless a Docker Hub customer)
Uninstall
kubectl delete datadogagent datadog
helm delete datadog-operator
This command deletes all Kubernetes resources created by installing Datadog Operator and deploying the Datadog Agent.
helm uninstall datadog-agent
This section includes the following topics:
- Installation: Install the Datadog Agent in a Kubernetes environment.
Further Reading
Additional helpful documentation, links, and articles:
Check out the latest Datadog Containers releases (App login required).RELEASE NOTES
![more]()
![more]()
![more]()
![more]()
![more]()
![more]()
![more]()
![more]()
![more]()
![more]()

