- Agents
- Essentials
- Getting Started
- Agent
- API
- APM Tracing
- Containers
- Dashboards
- Database Monitoring
- Datadog
- Datadog Site
- DevSecOps
- Incident Management
- Integrations
- Internal Developer Portal
- Logs
- Monitors
- Notebooks
- OpenTelemetry
- Profiler
- Search
- Session Replay
- Security
- Serverless for AWS Lambda
- Software Delivery
- Synthetic Monitoring and Testing
- Tags
- Workflow Automation
- Learning Center
- Support
- Glossary
- Standard Attributes
- Guides
- Agent
- Integrations
- Extend Datadog
- Authorization
- DogStatsD
- Custom Checks
- Integrations
- Build an Integration with Datadog
- Create an Agent-based Integration
- Create an API-based Integration
- Create a Log Pipeline
- Integration Assets Reference
- Build a Marketplace Offering
- Create an Integration Dashboard
- Create a Monitor Template
- Create a Cloud SIEM Detection Rule
- Install Agent Integration Developer Tool
- Service Checks
- Community
- Guides
- OpenTelemetry
- Administrator's Guide
- API
- Partners
- Datadog Mobile App
- DDSQL Reference
- CoScreen
- CoTerm
- Remote Configuration
- Cloudcraft (Standalone)
- In The App
- Dashboards
- Notebooks
- DDSQL Editor
- Reference Tables
- Sheets
- Monitors and Alerting
- Service Level Objectives
- Metrics
- Watchdog
- Bits AI
- Internal Developer Portal
- Error Tracking
- Change Tracking
- Event Management
- Incident Response
- Actions & Remediations
- Infrastructure
- Cloudcraft
- Resource Catalog
- Universal Service Monitoring
- End User Device Monitoring
- Hosts
- Containers
- Processes
- Serverless
- Network Monitoring
- Storage Management
- Cloud Cost
- Application Performance
- APM
- Continuous Profiler
- Database Monitoring
- Agent Integration Overhead
- Setup Architectures
- Setting Up Postgres
- Setting Up MySQL
- Setting Up SQL Server
- Setting Up Oracle
- Setting Up Amazon DocumentDB
- Setting Up MongoDB
- Setting Up ClickHouse
- Connecting DBM and Traces
- Data Collected
- Exploring Database Hosts
- Exploring Query Metrics
- Exploring Query Samples
- Exploring Database Schemas
- Exploring Recommendations
- Troubleshooting
- Guides
- Data Streams Monitoring
- Data Observability
- Digital Experience
- Real User Monitoring
- Synthetic Testing and Monitoring
- Continuous Testing
- Experiments
- Product Analytics
- Session Replay
- Software Delivery
- CI Visibility
- CD Visibility
- Deployment Gates
- Test Optimization
- Code Coverage
- PR Gates
- DORA Metrics
- Feature Flags
- Developer Integrations
- Security
- Security Overview
- Cloud SIEM
- Code Security
- Cloud Security
- App and API Protection
- AI Guard
- Workload Protection
- Sensitive Data Scanner
- AI Observability
- Log Management
- Observability Pipelines
- Configuration
- Sources
- Processors
- Destinations
- Packs
- Akamai CDN
- Amazon CloudFront
- Amazon VPC Flow Logs
- AWS Application Load Balancer Logs
- AWS CloudTrail
- AWS Elastic Load Balancer Logs
- AWS Network Load Balancer Logs
- Cisco ASA
- Cloudflare
- F5
- Fastly
- Fortinet Firewall
- HAProxy Ingress
- Istio Proxy
- Juniper SRX Firewall Traffic Logs
- Netskope
- NGINX
- Okta
- Palo Alto Firewall
- Windows XML
- ZScaler ZIA DNS
- Zscaler ZIA Firewall
- Zscaler ZIA Tunnel
- Zscaler ZIA Web Logs
- Search Syntax
- Scaling and Performance
- Monitoring and Troubleshooting
- Guides and Resources
- Log Management
- CloudPrem
- Administration
Cloudflare
Integration version1.2.3


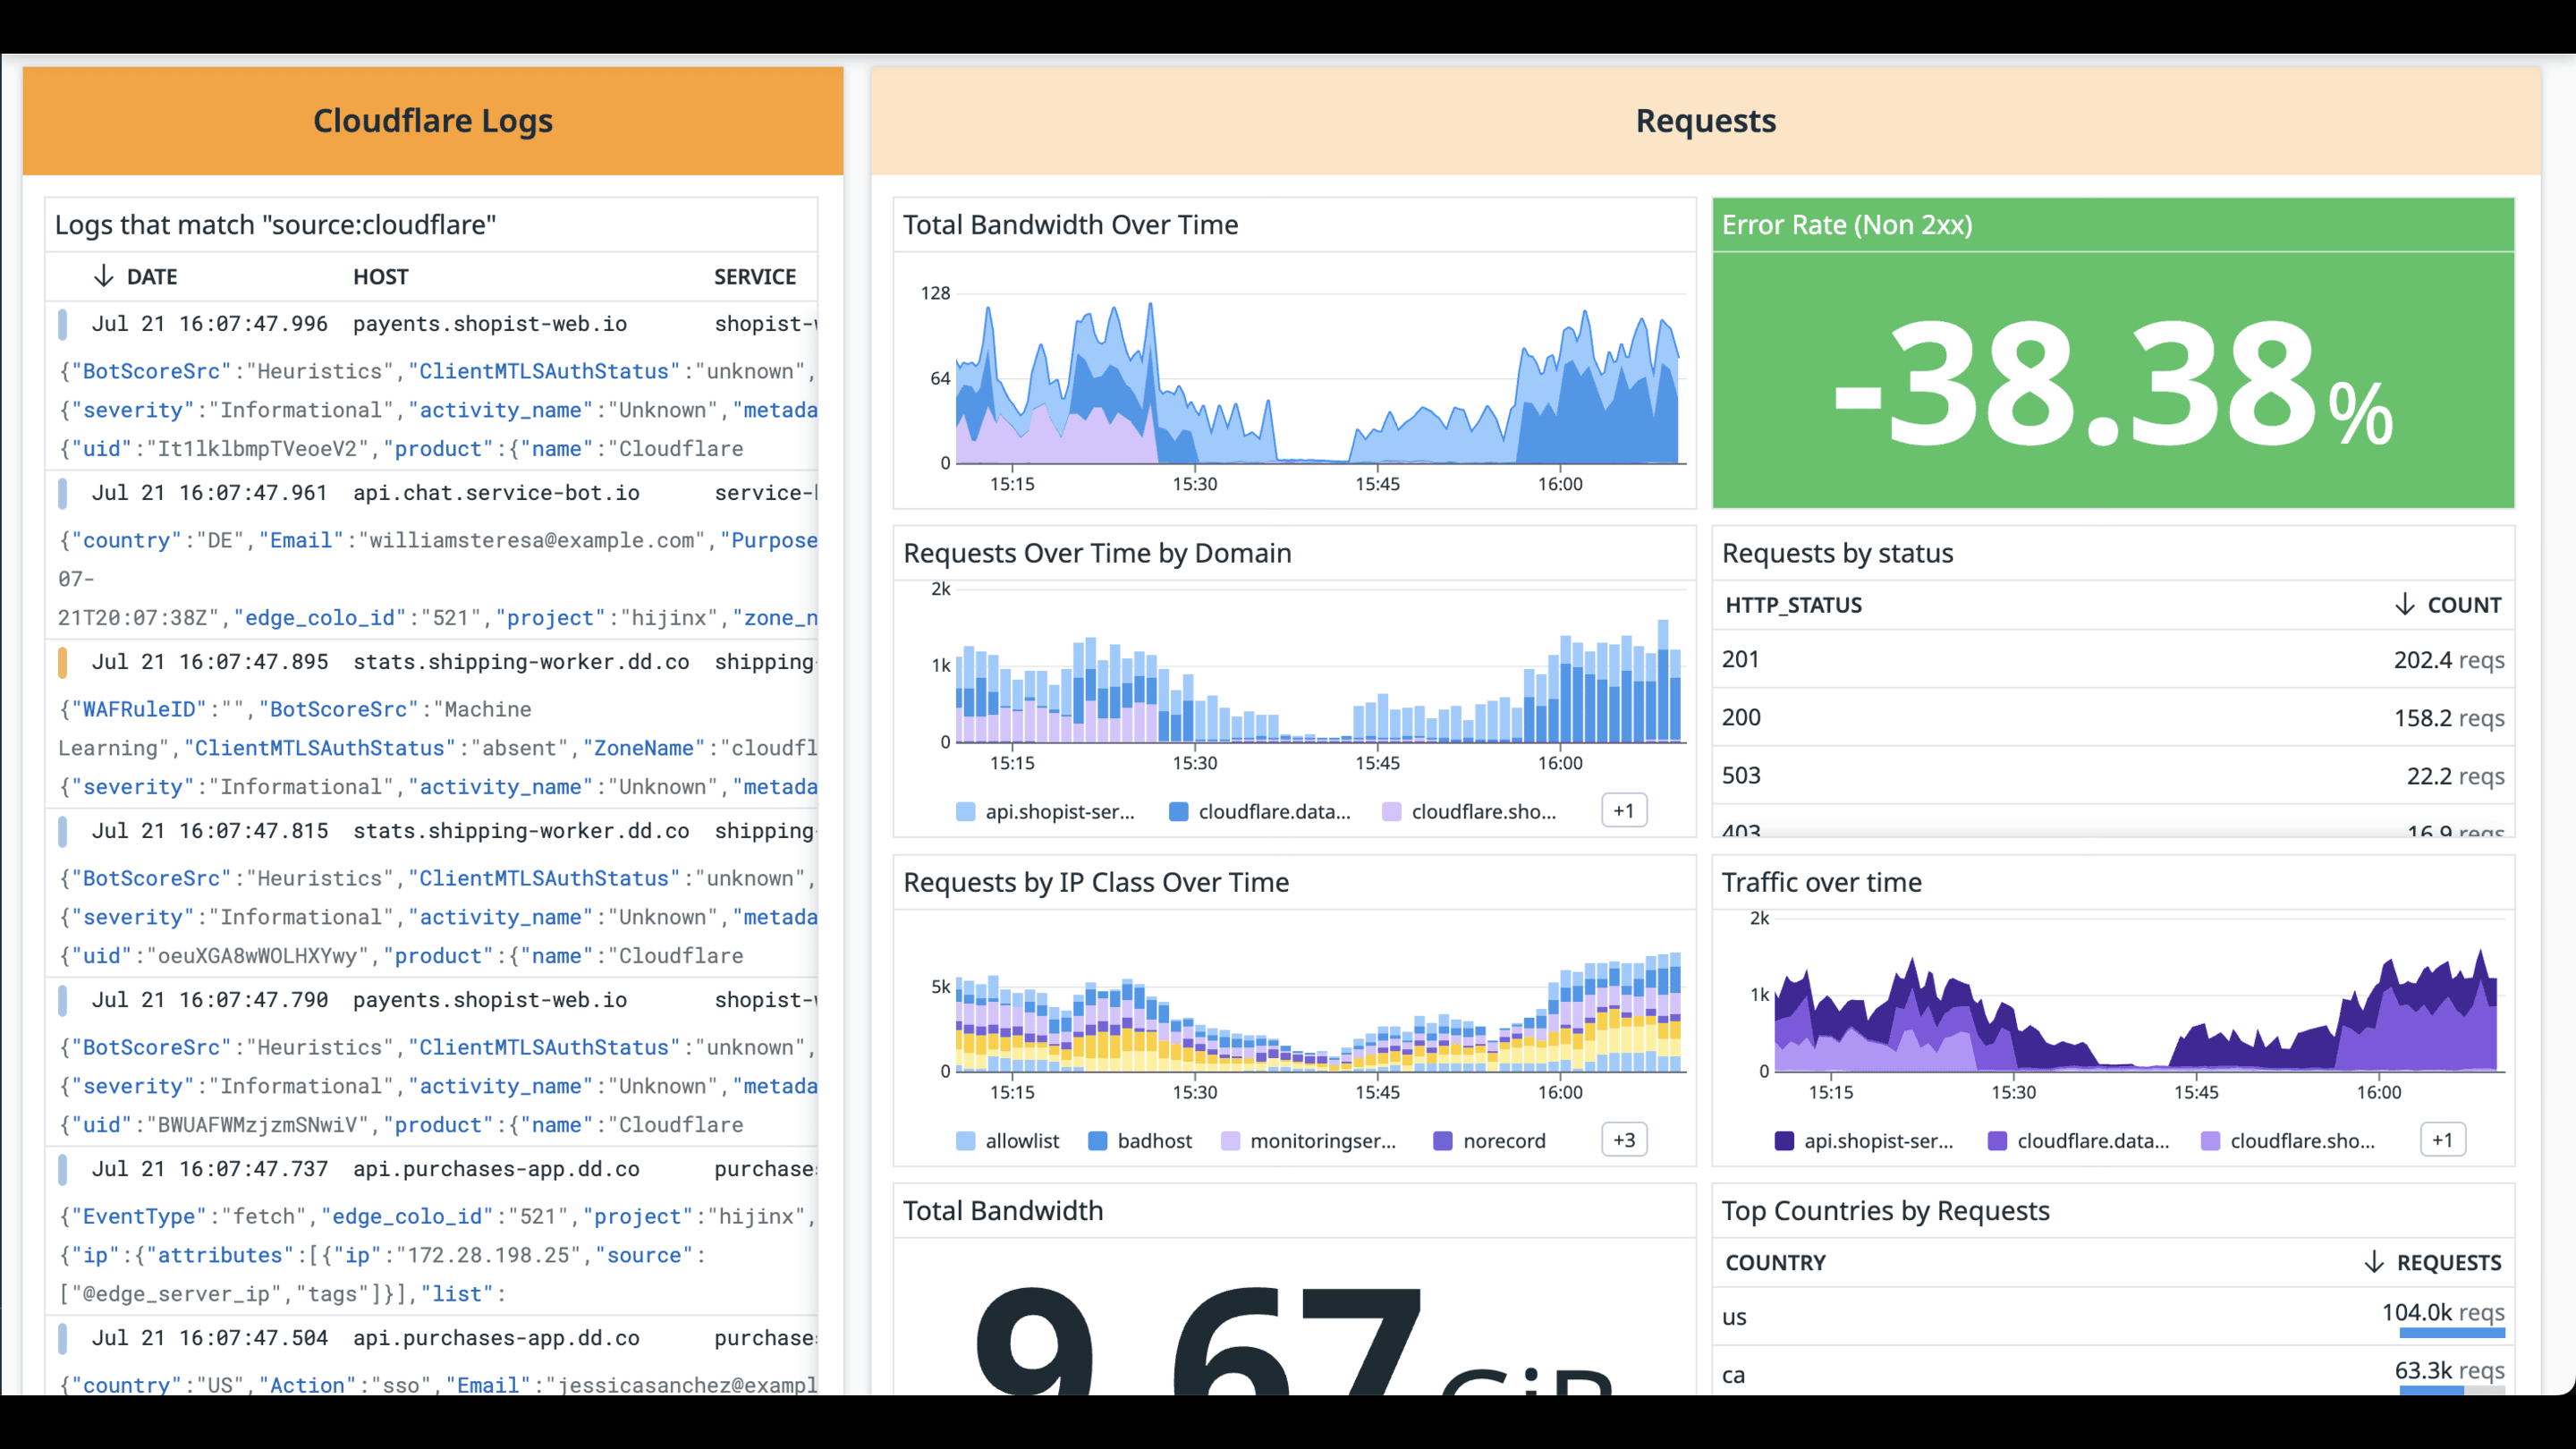
Cloudflare Overview Dashboard
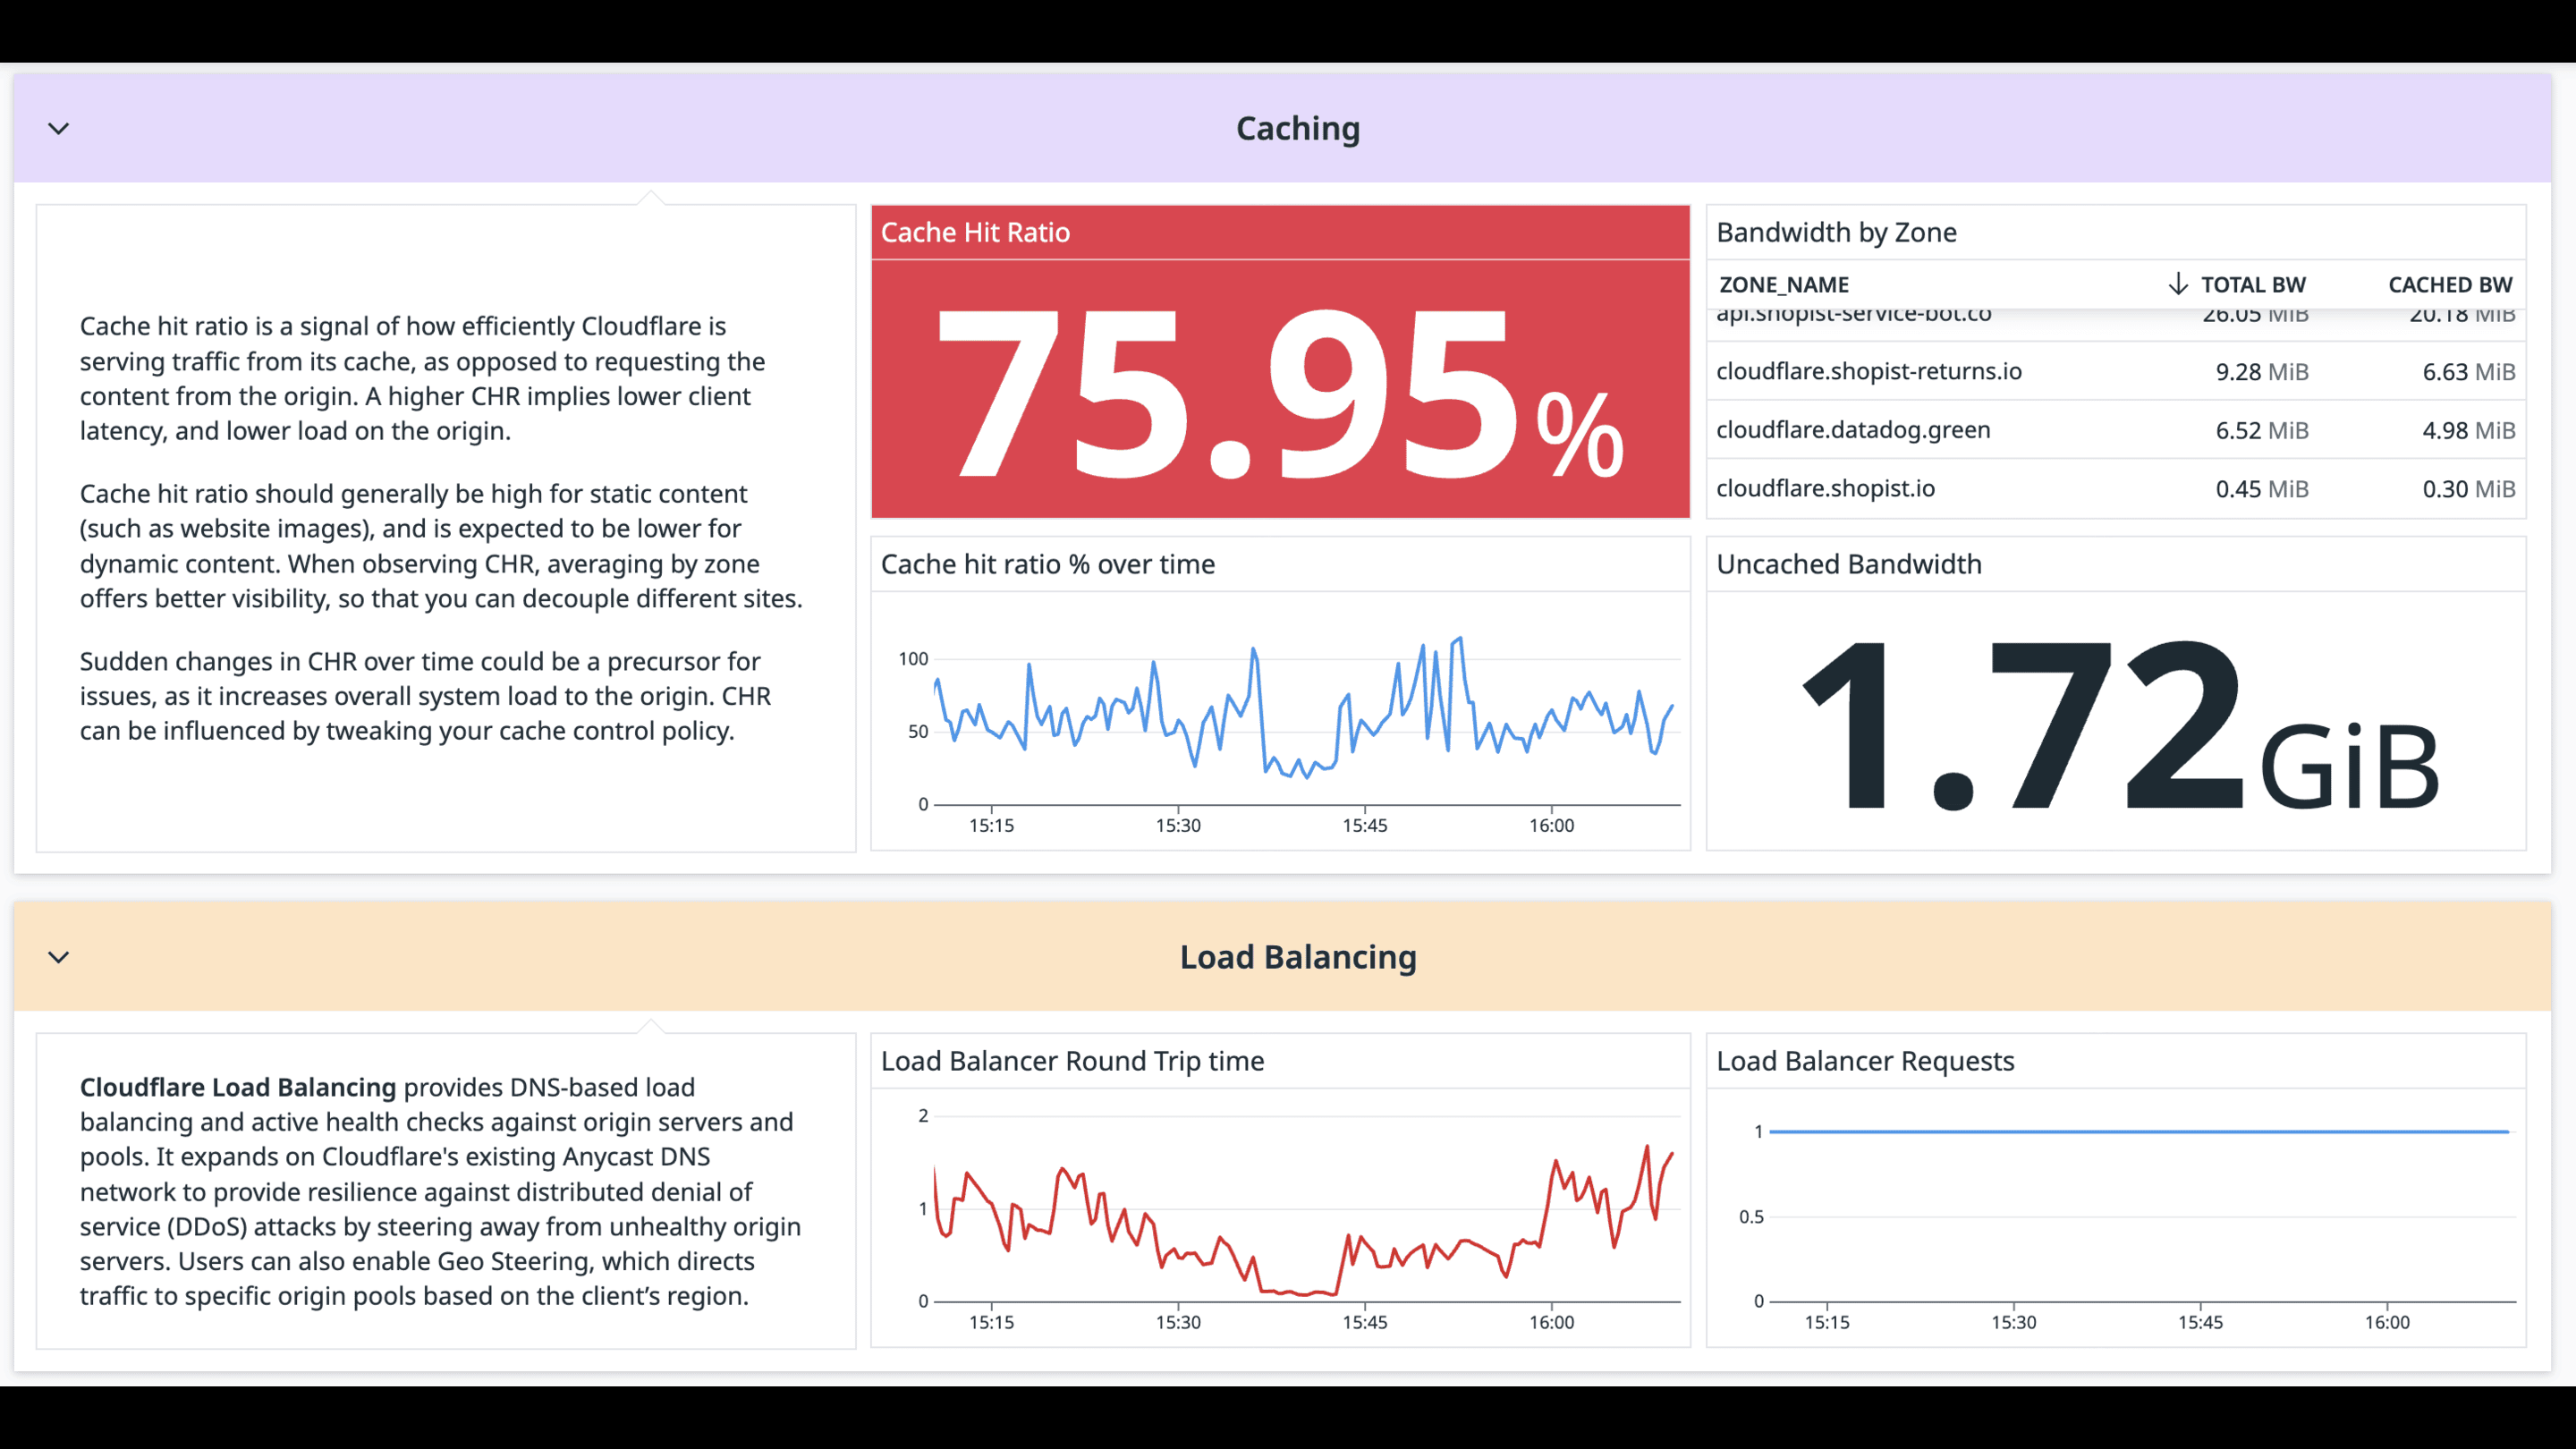
Cloudflare Overview Dashboard
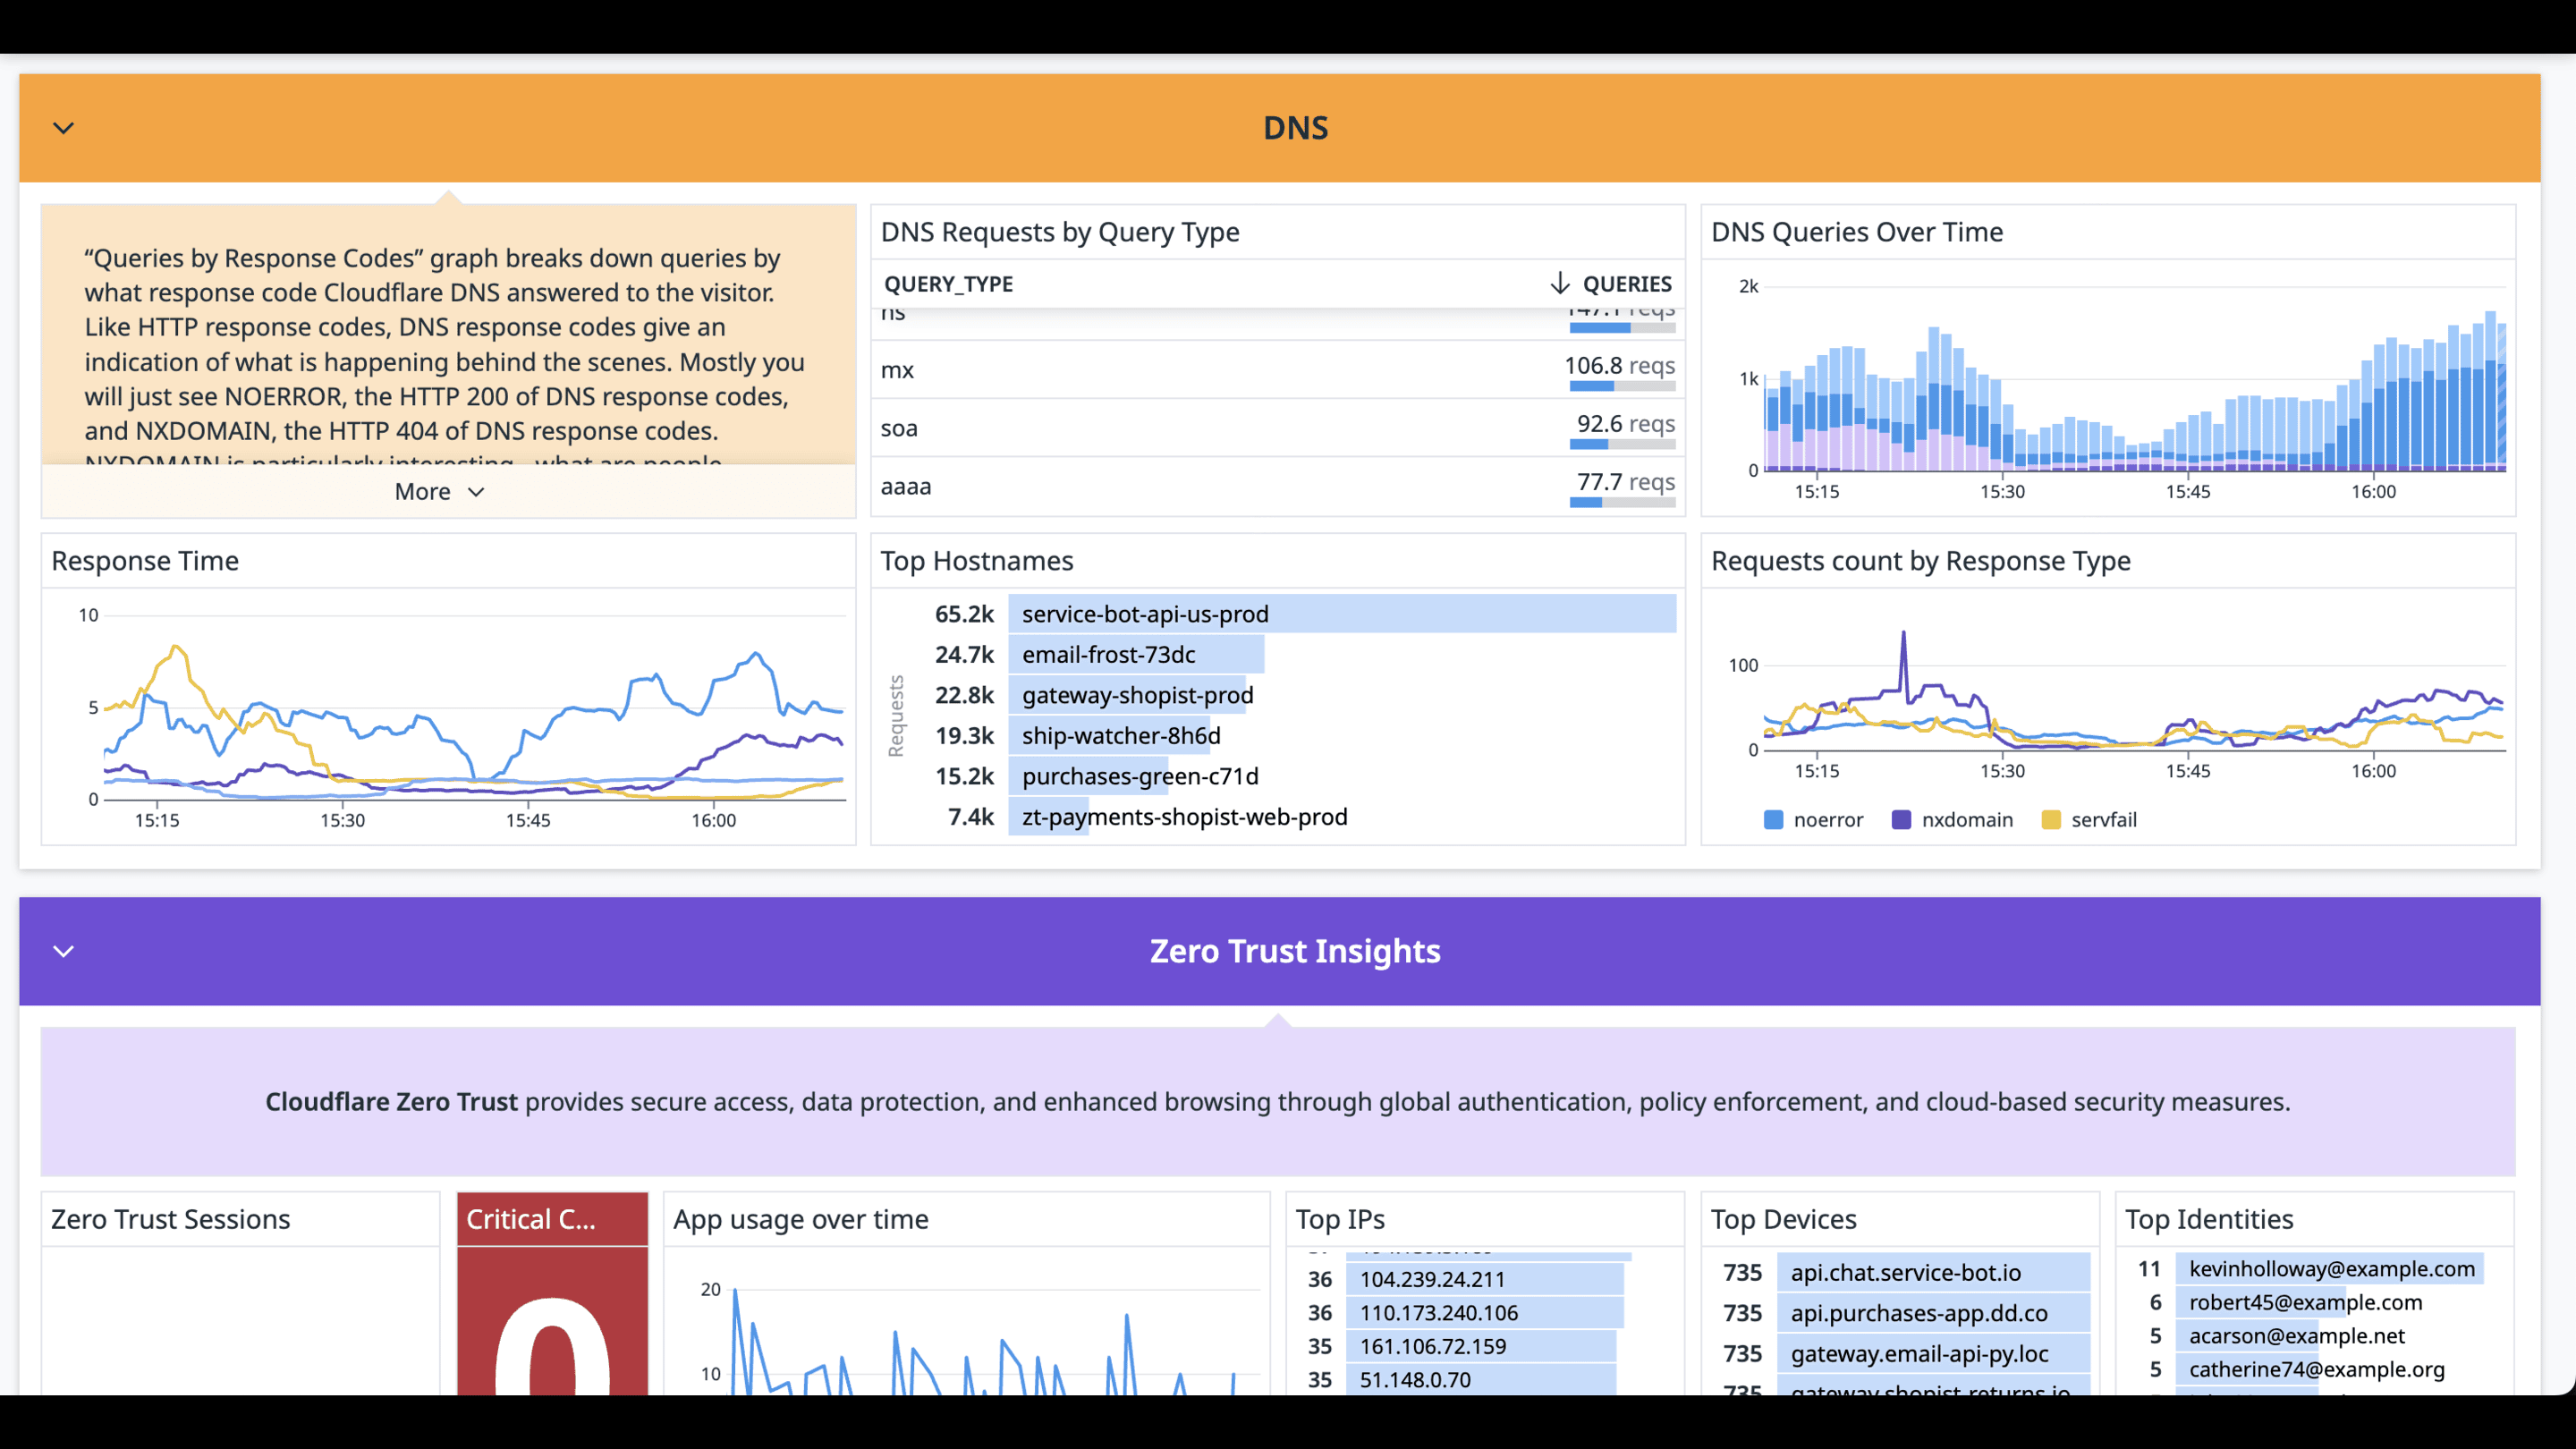
Cloudflare Overview Dashboard
Cloudflare Overview Dashboard
Overview
Integrate with Cloudflare to get your zone metrics, including web traffic, DNS queries, and threat insights. The integration is based on Cloudflare’s analytics API. Learn more about what resources correspond with which metrics in the Datadog documentation.
Log Collection: In addition to these metrics, Cloudflare allows customers to push logs directly into Datadog using Cloudflare Logpush. These detailed logs contain metadata generated by Cloudflare products and are helpful for debugging and creating analytics, especially when combined with logs from other sources. Enable Cloudflare log collection in combination with these metrics to get full visibility into your Cloudflare environment.
The out-of-the-box dashboard improves the security and performance of your applications. This single pane of glass gives you visibility into:
- security threats
- HTTP request volume and error rates
- load balancing, including round-trip time and any changes in traffic flow
- performance issues in worker scripts
With enriched logs and detailed metrics giving you deep insight into your Cloudflare infrastructure, you can build the context you need to resolve issues.
The integration works with Datadog Cloud SIEM to provide out-of-the-box threat detection for
- impossible travel
- dangerous misconfigurations
- DDoS attacks
Mitigate security threats more quickly with the included Workflow Automation blueprints, such as blocking an IP address or creating a case in Datadog.
Setup
Before you begin, you need a Datadog account, with an API token, and access to Cloudflare Logpush, which requires an Enterprise account plan.
To create a Cloudflare API token, follow Cloudflare’s API Token Documentation and ensure it has the necessary permissions listed below for each account. If you encounter authentication issues with your token, contact Cloudflare Support.
Permissions
| Scope | Permission | Status |
|---|---|---|
| Account | Account Analytics | Read |
| Account | Account Settings | Read |
| Account | Workers Scripts | Read |
| Account | Workers Tail | Read |
| Zone | Analytics | Read |
| Zone | Load Balancers | Read |
| Zone | Workers Routes | Read |
| Zone | Zone | Read |
Installation
Install the integration with the Datadog Cloudflare integration tile by entering the API token you created above.
Configuration
- Go to the Configure tab in the Datadog Cloudflare integration tile.
- Enter your email address and the API token created earlier for the accounts you want to monitor. You can find your Cloudflare API token in your Cloudflare account under My Profile > API Tokens. Note that Cloudflare’s API Keys are now considered legacy authentication methods. If you’re using an API Key, Datadog recommends replacing it with an API token.
- Provide a name for the account. This name is arbitrary and appears in the
accounttag on your metrics.
Log collection
Cloudflare allows customers to push logs directly into Datadog using Cloudflare Logpush. You can manage the Logpush job with the Cloudflare API or directly within your Cloudflare dashboard.
If you install the Cloudflare integration pipeline, it automatically remaps certain attributes. To see which attributes are remapped:
- Navigate to Logs Pipelines.
- Click Browse Pipeline Library on the top right.
- Enter
Cloudflarein the search bar. - Click Cloudflare to see the list of remappers and other processors that are installed.
Cloudflare API
Create a Logpush job by making a POST request to the Logpush jobs endpoint. Include the following fields:
name(optional): Use your domain name as the job name.destination_conf: A log destination consisting of the following parameters:<DATADOG_ENDPOINT_URL>: The Datadog HTTP logs intake endpoint, which can be either one below. You can find the difference at Datadog API reference.- v1:
http-intake.logs./v1/input - v2 (latest):
http-intake.logs./api/v2/logs
- v1:
<DATADOG_API_KEY>: Your Datadog API key.ddsource: Set tocloudflare.service(optional): Specify service name.host(optional): Specify host name.ddtags(optional): Specify tags.
dataset: The category of logs you want to receive. See the Cloudflare Log fields for a list of supported datasets.logpull_options(optional): To configure fields, sample rate, and timestamp format, see the Logpush API options. Datadog mandates the use of RFC 3339 format for timestamps from Cloudflare, which is the default option used by Cloudflare.
Example request:
curl -s -X POST 'https://api.cloudflare.com/client/v4/zones/<ZONE_ID>/logpush/jobs' \ --header 'X-Auth-Key: <CLOUDFLARE_AUTH_KEY>' \ --header 'X-Auth-Email: <CLOUDFLARE_AUTH_EMAIL>' \ --header 'Content-Type: application/json' \ --data-raw '{ "name": "<NAME>", "destination_conf": "datadog://<DATADOG_ENDPOINT_URL>?header_DD-API-KEY=<DATADOG_API_KEY>&ddsource=cloudflare&service=cloudflare&ddtags=env:dev", "logpull_options": "fields=RayID,EdgeStartTimestamp×tamps=rfc3339", "dataset": "http_requests" }'Example response:
{ "errors": [], "messages": [], "result": { "id": 100, "dataset": "http_requests", "enabled": false, "name": "<DOMAIN_NAME>", "logpull_options": "fields=RayID,EdgeStartTimestamp×tamps=rfc3339", "destination_conf": "datadog://http-intake.logs./v1/input?header_DD-API-KEY=<DD-API-KEY>&ddsource=cloudflare&service=cloudflare&ddtags=env:dev", "last_complete": null, "last_error": null, "error_message": null }, "success": true }Take note of the value of
id. In the example above, it is100.Enable the job. Use the job ID returned in the response and send
{"enabled": true}in the request body.Example request:
curl -s -X PUT \
https://api.cloudflare.com/client/v4/zones/<ZONE_ID>/logpush/jobs/<JOB_ID> -d'{"enabled":true}' | jq .
Example response:
{ "errors": [], "messages": [], "result": { "id": 100, "dataset": "http_requests", "enabled": true, "name": "<DOMAIN_NAME>", "logpull_options": "fields=RayID,EdgeStartTimestamp×tamps=rfc3339", "destination_conf": "datadog://?header_DD-API-KEY=<DATADOG-API-KEY>", "last_complete": null, "last_error": null, "error_message": null }, "success": true }
Cloudflare dashboard
Once you have connected a service with the Logpush section of the Cloudflare dashboard, select the dataset, select data fields, and then, under select destination, choose Datadog.
Under Enter destination information, enter the Datadog URL Endpoint:
http-intake.logs./api/v2/logs?ddsource=cloudflareNote:
ddsource=cloudflareis required. To differentiate between logs, you can also add the optional parameters ofservice,host, andddtags.Example:
http-intake.logs./api/v2/logs?service=<SERVICE>&host=<HOST>&ddsource=cloudflareEnter the Datadog API key you used to set up your Datadog Cloudflare integration tile.
After validating access, you should see “Ready to push!” under Prove ownership. Click
Pushto complete.
Data Collected
Metrics
| cloudflare.requests.all (count) | Total request count Shown as request |
| cloudflare.requests.cached (count) | Cached requests count Shown as request |
| cloudflare.requests.uncached (count) | Uncached requests count Shown as request |
| cloudflare.requests.ssl.encrypted (count) | SSL encrypted requests count Shown as request |
| cloudflare.requests.ssl.unencrypted (count) | Unencrypted requests count Shown as request |
| cloudflare.requests.country (count) | Request count, tagged by IATA country code Shown as request |
| cloudflare.requests.status (count) | Request count, tagged by HTTP response code Shown as request |
| cloudflare.requests.content_type (count) | Request count, tagged by Content-Type Shown as request |
| cloudflare.requests.ip_class (count) | Request count, tagged by IP class Shown as request |
| cloudflare.requests.cross_zone_sub_requests.avg (gauge) | The proportion of requests that were initiated by a Cloudflare Worker on another zone tagged by IATA country code and cache status Shown as request |
| cloudflare.requests.edge_dns_response_time.avg (gauge) | Average edge dns response time in milliseconds tagged by IATA country code and cache status Shown as millisecond |
| cloudflare.requests.edge_time_to_first_byte.avg (gauge) | Average time to first byte in milliseconds tagged by IATA country code and cache status Shown as millisecond |
| cloudflare.requests.origin_response_duration.avg (gauge) | The average originResponseDuration in milliseconds excluding 0 values (in orther words cached ones) tagged by IATA country code and cache status Shown as millisecond |
| cloudflare.requests.cross_zone_sub_requests.avg.all (gauge) | The proportion of requests that were initiated by a Cloudflare Worker on another zone Shown as request |
| cloudflare.requests.edge_dns_response_time.avg.all (gauge) | Average edge dns response time in milliseconds Shown as millisecond |
| cloudflare.requests.edge_time_to_first_byte.avg.all (gauge) | Average time to first byte in milliseconds Shown as millisecond |
| cloudflare.requests.origin_response_duration.avg.all (gauge) | The average originResponseDuration in milliseconds excluding 0 values (in orther words cached ones) Shown as millisecond |
| cloudflare.bandwidth.all (count) | Total bandwidth Shown as byte |
| cloudflare.bandwidth.cached (count) | Cached bandwidth Shown as byte |
| cloudflare.bandwidth.uncached (count) | Uncached bandwidth Shown as byte |
| cloudflare.bandwidth.ssl.encrypted (count) | SSL encrypted bandwidth Shown as byte |
| cloudflare.bandwidth.ssl.unencrypted (count) | Unencrypted bandwidth Shown as byte |
| cloudflare.bandwidth.country (count) | Bandwidth tagged by IATA country code Shown as byte |
| cloudflare.bandwidth.content_type (count) | Bandwidth tagged by Content-Type Shown as byte |
| cloudflare.threats.all (count) | Total threats Shown as operation |
| cloudflare.threats.type (count) | Threats tagged by type Shown as operation |
| cloudflare.threats.country (count) | Threats tagged by IATA country code Shown as operation |
| cloudflare.pageviews.all (count) | Total page views Shown as page |
| cloudflare.pageviews.search_engine (count) | Page views tagged by search engine Shown as page |
| cloudflare.uniques.all (count) | Unique visitors count Shown as connection |
| cloudflare.dns.query.all (count) | DNS query count Shown as request |
| cloudflare.dns.query.uncached (count) | Uncached DNS query count Shown as request |
| cloudflare.dns.query.stale (count) | Stale DNS query count Shown as request |
| cloudflare.dns.response_time.avg (gauge) | DNS query average response time Shown as millisecond |
| cloudflare.dns.response_time.median (gauge) | DNS query median response time Shown as millisecond |
| cloudflare.dns.response_time.90p (gauge) | DNS query response time to the 90th percentile Shown as millisecond |
| cloudflare.dns.response_time.99p (gauge) | DNS query response time to the 99th percentile Shown as millisecond |
| cloudflare.workers.requests.all (count) | The request count to the worker script (metrics may not show without enabled API Key permissions) Shown as request |
| cloudflare.workers.requests.errors (count) | The error count to the worker script (metrics may not show without enabled API Key permissions) Shown as request |
| cloudflare.workers.requests.subrequests (count) | The subrequest count to the worker script (metrics may not show without enabled API Key permissions) Shown as request |
| cloudflare.workers.requests.client_disconnects (count) | The number of times the client disconnected from the worker script (metrics may not show without the enabled API Key permissions) Shown as request |
| cloudflare.workers.requests.response_body_size (count) | The sum of response body sizes for the worker script (metrics may not show without the enabled API Key permissions) Shown as byte |
| cloudflare.workers.response_time.75p (gauge) | The worker response time to the 75th percentile (metrics may not show without enabled API Key permissions) Shown as microsecond |
| cloudflare.workers.response_time.99p (gauge) | The worker response time to the 99th percentile (metrics may not show without enabled API Key permissions) Shown as microsecond |
| cloudflare.workers.cpu_time.p25 (gauge) | The worker CPU time to the 25th percentile Shown as microsecond |
| cloudflare.workers.cpu_time.p50 (gauge) | The worker CPU time to the 50th percentile Shown as microsecond |
| cloudflare.workers.cpu_time.p75 (gauge) | The worker CPU time to the 75th percentile Shown as microsecond |
| cloudflare.workers.cpu_time.p90 (gauge) | The worker CPU time to the 90th percentile Shown as microsecond |
| cloudflare.workers.cpu_time.p95 (gauge) | The worker CPU time to the 95th percentile Shown as microsecond |
| cloudflare.workers.cpu_time.p99 (gauge) | The worker CPU time to the 99th percentile Shown as microsecond |
| cloudflare.workers.response_body_size.p25 (gauge) | The worker response body size to the 25th percentile Shown as byte |
| cloudflare.workers.response_body_size.p50 (gauge) | The worker response body size to the 50th percentile Shown as byte |
| cloudflare.workers.response_body_size.p75 (gauge) | The worker response body size to the 75th percentile Shown as byte |
| cloudflare.workers.response_body_size.p90 (gauge) | The worker response body size to the 90th percentile Shown as byte |
| cloudflare.workers.response_body_size.p95 (gauge) | The worker response body size to the 95th percentile Shown as byte |
| cloudflare.workers.response_body_size.p99 (gauge) | The worker response body size to the 99th percentile Shown as byte |
| cloudflare.workers.wall_time.p25 (gauge) | The worker wall time to the 25th percentile Shown as microsecond |
| cloudflare.workers.wall_time.p50 (gauge) | The worker wall time to the 50th percentile Shown as microsecond |
| cloudflare.workers.wall_time.p75 (gauge) | The worker wall time to the 75th percentile Shown as microsecond |
| cloudflare.workers.wall_time.p90 (gauge) | The worker wall time to the 90th percentile Shown as microsecond |
| cloudflare.workers.wall_time.p95 (gauge) | The worker wall time to the 95th percentile Shown as microsecond |
| cloudflare.workers.wall_time.p99 (gauge) | The worker wall time to the 99th percentile Shown as microsecond |
| cloudflare.load_balancer.pool.round_trip_time.average (gauge) | The average round trip time to reach the load balancer pool Shown as millisecond |
| cloudflare.load_balancer.pool.health.status (count) | The load balancer pool health status Shown as request |
| cloudflare.adaptive.bandwidth.all (count) | Total bandwidth measured using adaptive sampling for high-traffic zones Shown as byte |
| cloudflare.adaptive.bandwidth.cached (count) | Cached bandwidth measured using adaptive sampling Shown as byte |
| cloudflare.adaptive.bandwidth.uncached (count) | Uncached bandwidth measured using adaptive sampling Shown as byte |
| cloudflare.adaptive.requests.all (count) | Total request count using adaptive sampling for high-traffic zones Shown as request |
| cloudflare.adaptive.requests.cached (count) | Cached requests count using adaptive sampling Shown as request |
| cloudflare.adaptive.requests.uncached (count) | Uncached requests count using adaptive sampling Shown as request |
| cloudflare.adaptive.pageviews.all (count) | Total page views using adaptive sampling Shown as page |
| cloudflare.adaptive.requests.count (count) | Request count with multi-dimensional tags (edge response status, colo code, country, cache status, and host) Shown as request |
Metric categories
The table below describes the types of metrics collected and their associated metric prefixes.
| Type | Description | Metric Prefixes Collected |
|---|---|---|
| Web Analytics | Metrics related to web traffic and performance. | cloudflare.requests.allcloudflare.requests.cachedcloudflare.requests.uncachedcloudflare.requests.ssl.encryptedcloudflare.requests.ssl.unencryptedcloudflare.requests.countrycloudflare.requests.statuscloudflare.requests.content_typecloudflare.requests.ip_classcloudflare.bandwidth.allcloudflare.bandwidth.cachedcloudflare.bandwidth.uncachedcloudflare.bandwidth.ssl.encryptedcloudflare.bandwidth.ssl.unencryptedcloudflare.bandwidth.countrycloudflare.bandwidth.content_typecloudflare.threats.allcloudflare.threats.typecloudflare.threats.countrycloudflare.pageviews.allcloudflare.pageviews.search_enginecloudflare.uniques.allcloudflare.requests.cross_zone_sub_requests.avgcloudflare.requests.edge_dns_response_time.avgcloudflare.requests.edge_time_to_first_byte.avgcloudflare.requests.origin_response_duration.avg |
| DNS | Metrics related to DNS queries and response times. | cloudflare.dns.query.allcloudflare.dns.query.uncachedcloudflare.dns.query.stalecloudflare.dns.response_time.avgcloudflare.dns.response_time.mediancloudflare.dns.response_time.90pcloudflare.dns.response_time.99p |
| Load Balancer | Metrics related to load balancing pools. | cloudflare.load_balancer.pool.round_trip_time.averagecloudflare.load_balancer.pool.health.status |
| Worker Script | Metrics related to Cloudflare Workers scripts. | cloudflare.workers.requests.allcloudflare.workers.requests.errorscloudflare.workers.requests.subrequestscloudflare.workers.response_time.75pcloudflare.workers.response_time.99p |
Events
The Cloudflare integration does not include any events.
Service Checks
The Cloudflare integration does not include any service checks.
Troubleshooting
Need help? Contact Datadog support.
Further Reading
Additional helpful documentation, links, and articles:
