Overview
After assigning tags, start using them to filter and group your data in your Datadog platform. Tags can be used to include or exclude data.
When including or excluding multiple tags:
- Include uses
AND logic - Exclude uses
OR logic
Events
The Events Explorer shows the events from your environment over a specified time period. Use tags to filter the events list and focus on a subset of events. Enter tags: followed by a tag to see all the events coming from a host, integration, or service with that tag. For example, use tags:(service:coffee-house) to search for the tag service:coffee-house.
To search multiple tags inclusively, separate each tag with OR: tags:(service:coffee-house OR host:coffeehouseprod). To search multiple tags exclusively, separate each tag with AND: tags:(service:coffee-house AND host:coffeehouseprod).
Dashboards
Use tags to filter metrics to display in a dashboard graph, or to create aggregated groups of metrics to display. To filter the metrics to display, enter the tag in the from text box. This metric displays over all sources that have that particular tag assigned (service:web-store in the example below).
Advanced tag value filtering is also available with boolean filters. The following boolean syntax is supported:
NOT, !AND, ,ORkey IN (tag_value1, tag_value2,...)key NOT IN (tag_value1, tag_value2,...)
Use AND, ORs to look at a metric across specific tags:
Use IN, NOT IN to quickly filter a metric down to specific tags:
To create an aggregated group using tags, enter the key part of the tag in the avg by text box. For example, if you have a timeseries graph showing a metric tagged with the key service, such as service:web-store, enter service in the avg by text box to show one line for each service tag value. Each line represents the average metric value across all sources that share that service tag value.
Tags can also be used to overlay events on the dashboard. This works the same way as in the Events Explorer.
The matching events are overlaid as vertical bars on the graph. The example below uses service:web-store.
Use template variables to save time switching the from tag on graphs in your dashboard. In the example below, service is used to represent the service tag key. To use the template variable, add the $service template variable in the from text box of your graph query.
Here is an example of tags using the timeseries graph editor. For the first screenshot, no tags have been applied, and the average CPU usage across all hosts is displayed:
Next, the editor is updated to include a tag (region:eastus) in the from text box that enables Datadog to look at CPU usage across the US East region. The region tag is used as an example here, but you could use any arbitrary tag sent to your Datadog platform, including application, service, or environment.
Finally, the second empty field (the avg by text box) is used to show an individual timeseries line for each host. Server CPU is displayed for individual hosts running in the US East region.
If needed, add additional tags to narrow down the scope even further—for example, hosts in region:eastus and env:production. Tags can be used throughout Datadog and be applied to all core elements (metrics, traces, and logs).
Infrastructure
To filter the Host Map, Infrastructure List, Containers, and Processes, enter a tag in the Filter by text box at the top of the page. Hosts and containers can be grouped by tag key using the Group by text box. If you enter service in the group box, you see each service as a group heading.
Under this section, use tags to filter or group Hosts:
Or Containers:
Here are the filter and group by text boxes on the Infrastructure List page:
Here are the filter and group by text boxes on the Live Containers page:
Here are the filter and group by text boxes on the Live Processes page:
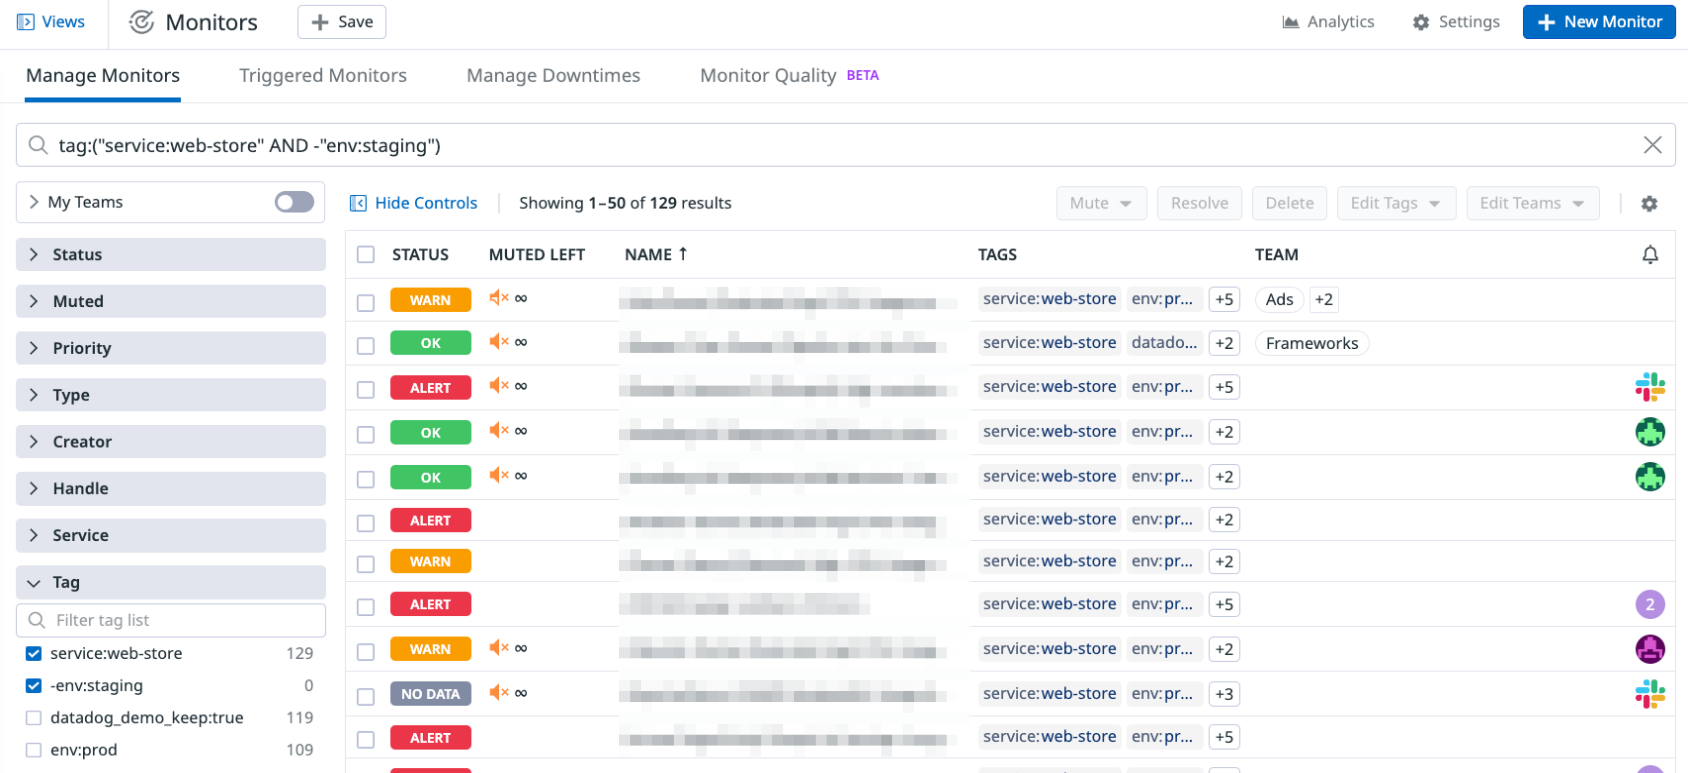
Monitors
To filter monitors and monitor downtimes by assigned tags, use the search bar or facet checkboxes. The search bar format is tag:<KEY>:<VALUE>, for example: tag:service:coffee-house. To exclude monitors with a specific tag from your search, use -, for example: tag:-service:coffee-house.
Note: Monitor tags are different and separate from metric tags. For more information, see the documentation on Monitor tags.
When creating a new monitor, use metric tags in the:
- from text box to limit the monitor scope to only metrics that have those tags.
- excluding text box to remove the corresponding metrics from the monitor scope.
- avg by text box to transform the monitor into a multi alert monitor on each tag value.
Metrics
Use tags in the Metrics Explorer to filter metrics over tags or display multiple graphs by tag key. The example below graphs a metric over service:web-store.
Integrations
Some integrations allow you to optionally limit metrics using tags.
The AWS integration tile has the tag filters to hosts with tag and to Lambdas with tag.
These fields accept a comma separated list of tags (in the form <KEY>:<VALUE>) that defines a filter, which is used for collecting your EC2 or Lambda resources. You can use these <KEY>:<VALUE> to both include and exclude functions based from monitoring based on tags. To specify that tag should be excluded, add a ! before the tag key. You can also use wildcards, such as ? (for single characters) and * (for multiple characters).
The filters include resources where any inclusion tag is present by using an OR statement. The following example filter collects EC2 instances that contain the tag datadog:monitored OR env:production:
datadog:monitored,env:production
If you specified an exclusion a tag, it takes precedence and forms an AND statement. The following example filter collects EC2 instances that contain the tag datadog:monitored, OR env:production, OR an instance-type tag with a c1.* value AND NOT a region:us-east-1 tag:
datadog:monitored,env:production,instance-type:c1.*,!region:us-east-1
Read more about AWS tagging in the EC2 and Lambda documentation.
The Azure integration tile has the tag filter Optionally filter to VMs with tag.
This field accepts a comma separated list of tags (in the form <KEY>:<VALUE>) that defines a filter, which is used for collecting metrics from Azure VMs. You can also use wildcards, such as ? (for single characters) and * (for multiple characters). Only VMs that match one of the defined tags are imported into Datadog. The rest are ignored.
VMs matching a given tag can also be excluded by adding ! before the tag, for example:
datadog:monitored,env:production,!env:staging,instance-type:c1.*
The Google Cloud integration tile has the tag filter to hosts with tag.
This field accepts a comma separated list of GCP labels (in the form <KEY>:<VALUE>) that defines a filter, which is used for collecting metrics from GCP. You can also use wildcards, such as ? (for single characters) and * (for multiple characters). Only hosts that match one of the defined labels are imported into Datadog. The rest are ignored.
You can exclude hosts matching a given label by adding ! before the tag, for example:
datadog:monitored,env:production,!env:staging,instance-type:c1.*
Read more about Creating and managing labels in the Google Cloud documentation.
APM
In the Trace Explorer, you can filter traces with tags using the search bar or facet checkboxes. The search bar format is <KEY>:<VALUE>, for example: service:coffee-house. For advanced search, see Query Syntax.
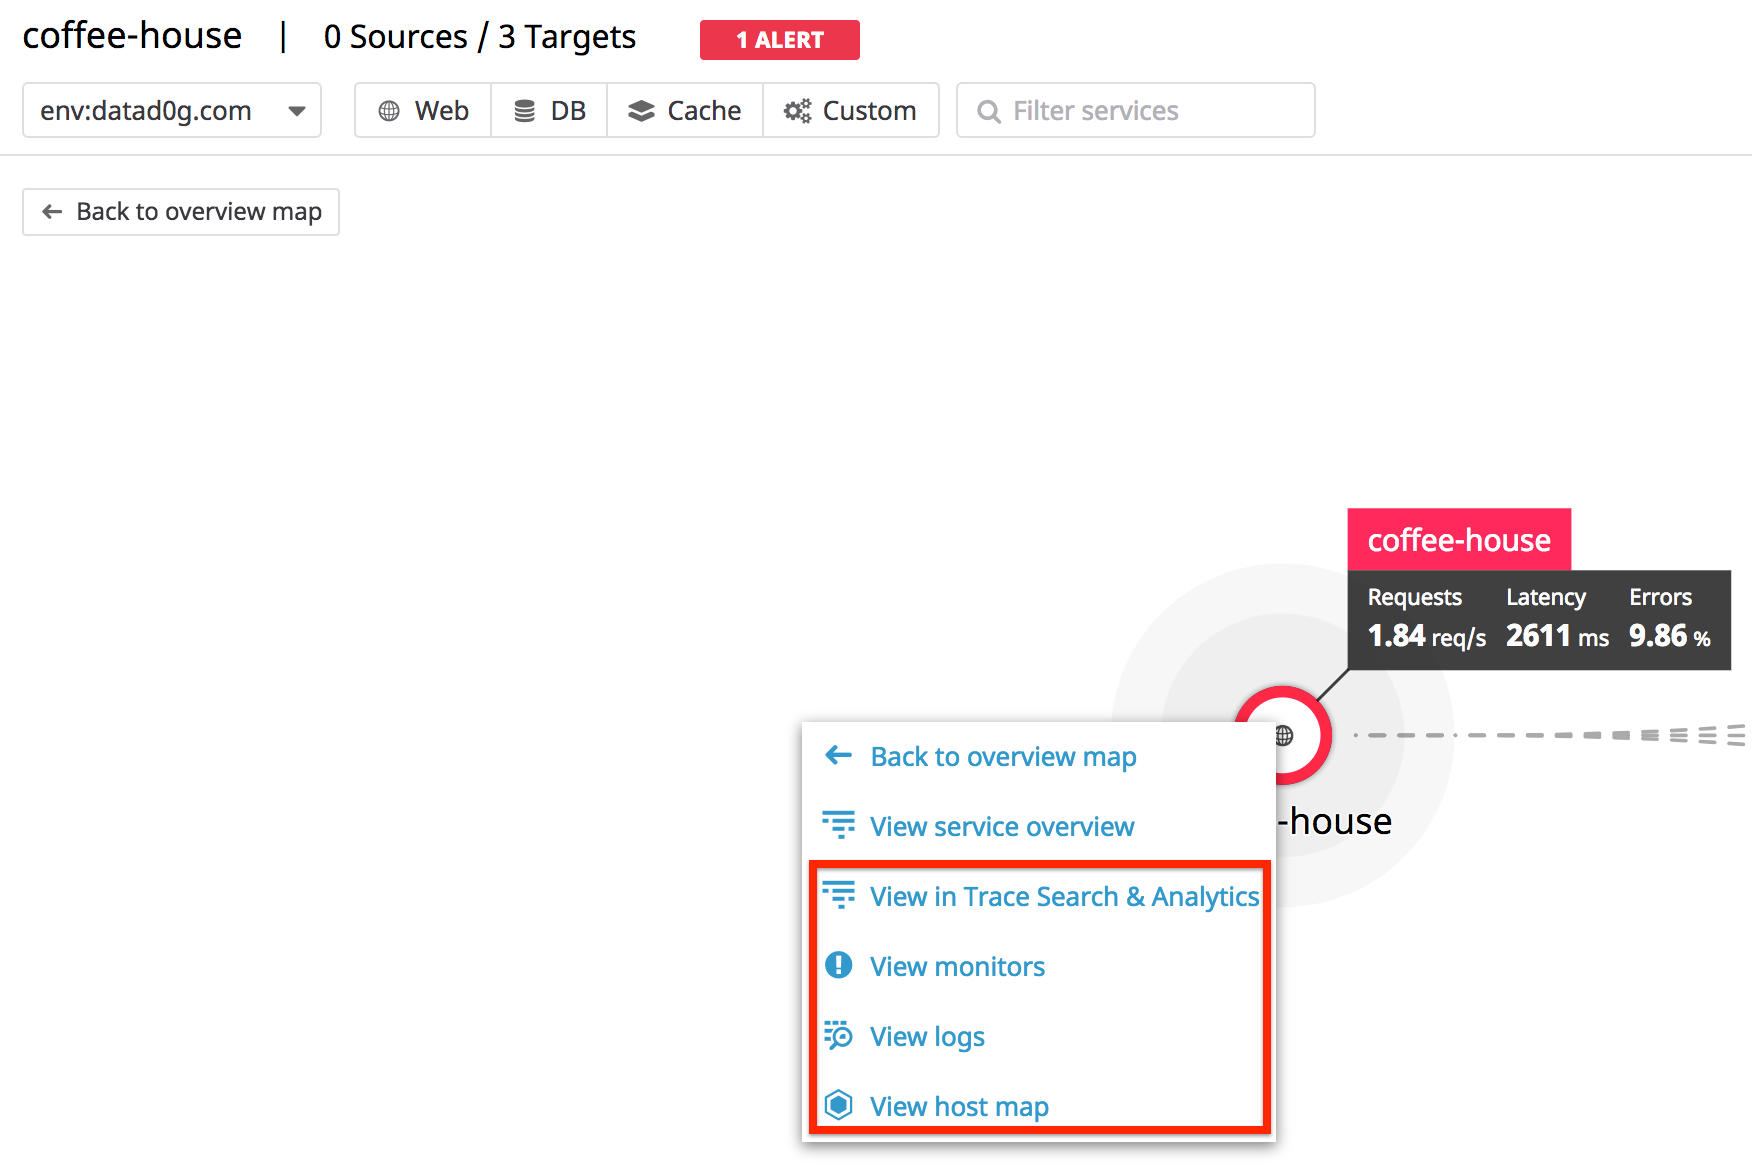
After assigning tags, use the Service Map to navigate to different areas of the application by clicking on a particular service. In the example below, view Analytics, Monitors, Logs, and the Host Map filtered by the tag service:coffee-house.
Notebooks
When creating a Notebook graph, limit metrics by using tags in the from text box. Additionally, group metrics by using tags in the avg by text box. In the example below, metrics are limited to service:coffee-house and grouped by host.
To exclude tags, use </> to edit the text then add the tag in the form !<KEY>:<VALUE>. In the example below, service:coffeehouse is excluded using !service:coffeehouse.
Logs
For Logs Search, Analytics, Patterns, and Live Tail, filter logs with tags using the search bar or facet checkboxes. The search bar format is <KEY>:<VALUE>, for example: service:coffee-house. For advanced search, see Search Logs.
Additionally, tags are used to filter a logs Pipeline. For example, if you only want logs from the coffee-house service to go through the pipeline, add the tag service:coffee-house to the filter field.
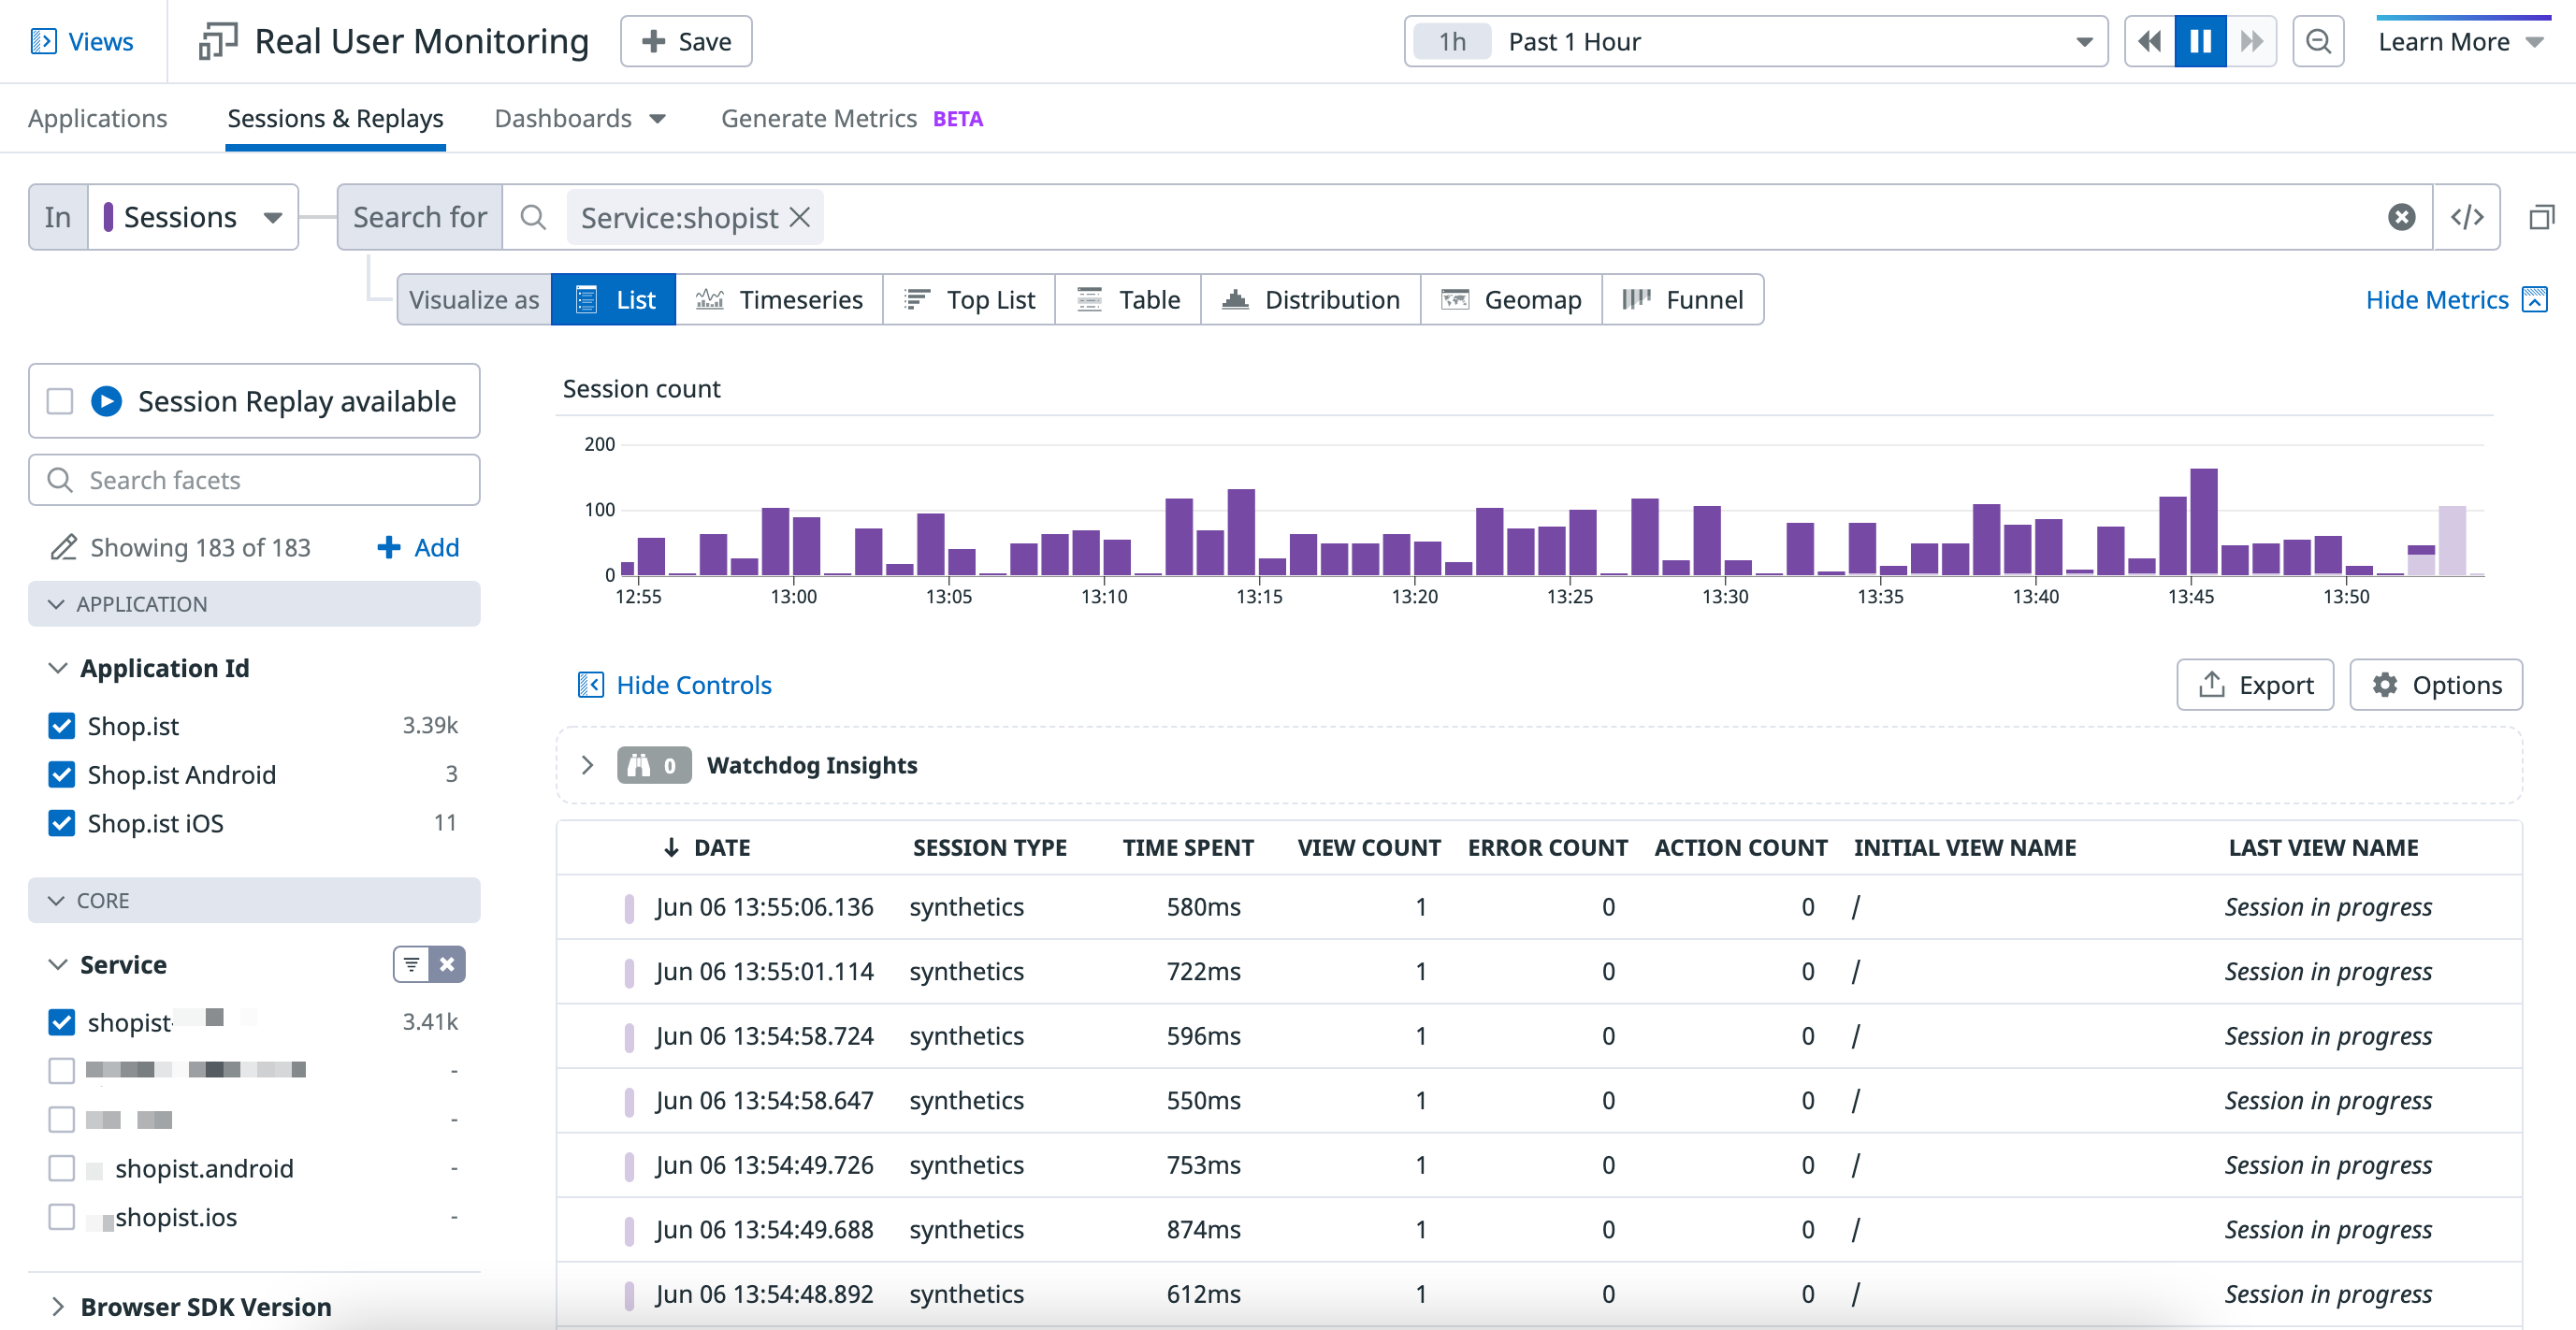
RUM & Session Replay
The RUM Explorer visualizes events from your environment over a specified time period.
To filter RUM event data by tags, use the search bar or facet checkboxes. The search bar format is <KEY>:<VALUE>, for example: service:shopist. For advanced search, see Search RUM Events.
Synthetics
The Synthetic Tests page lists your Synthetic tests.
To filter tests by tags, use the search bar or facet checkboxes. The search bar format is <KEY>:<VALUE>. For example: tag:mini-website. For advanced search, see Search and Manage Synthetic Tests.
Service level objectives
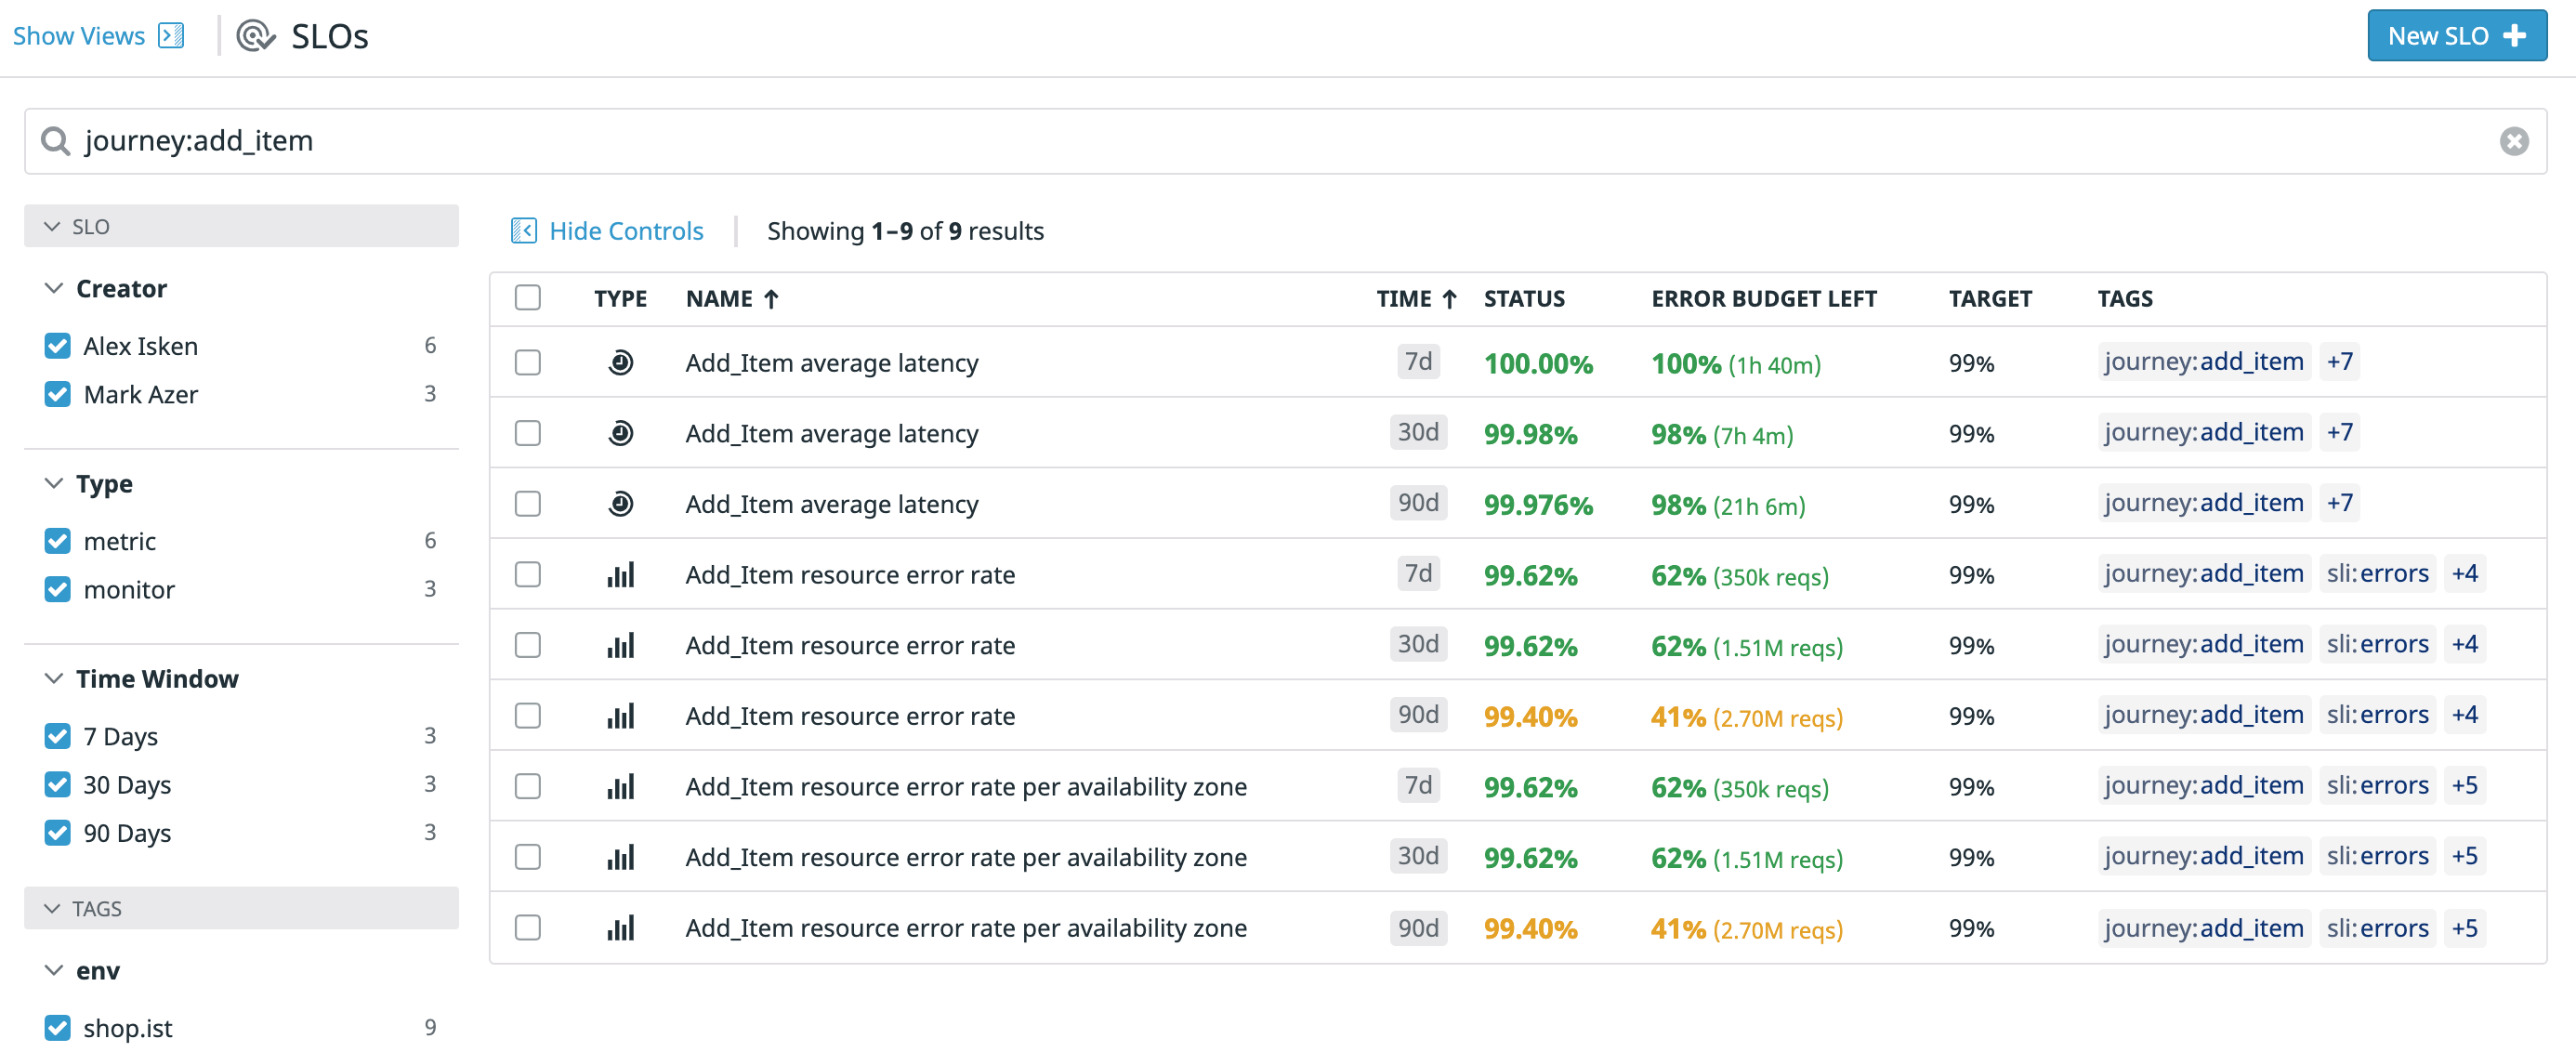
To filter SLOs by assigned tags, use the search bar or facet checkboxes. The search bar format is <KEY>:<VALUE>, for example: journey:add_item. To exclude SLOs with a specific tag from your search, use -, for example: -journey:add_item.
SLO tags are different and separate from metric or monitor tags used in the underlying metrics or monitors of an SLO.
When creating a metric-based SLO, use metric tags in the SLO’s success ratio metric queries (all metrics must use the same set of metric tags):
- from text box to limit the metric scope to only those tags.
- sum by text box to create a grouped metric-based SLO that display a status percentage and remaining error budget for both the overall SLO and for each tag value.
When creating a monitor-based SLO using a single grouped monitor, use the Calculate on selected groups toggle to select up to 20 tag values from the underlying monitor to display a status percentage and remaining error budget for both the overall SLO and for each tag value:
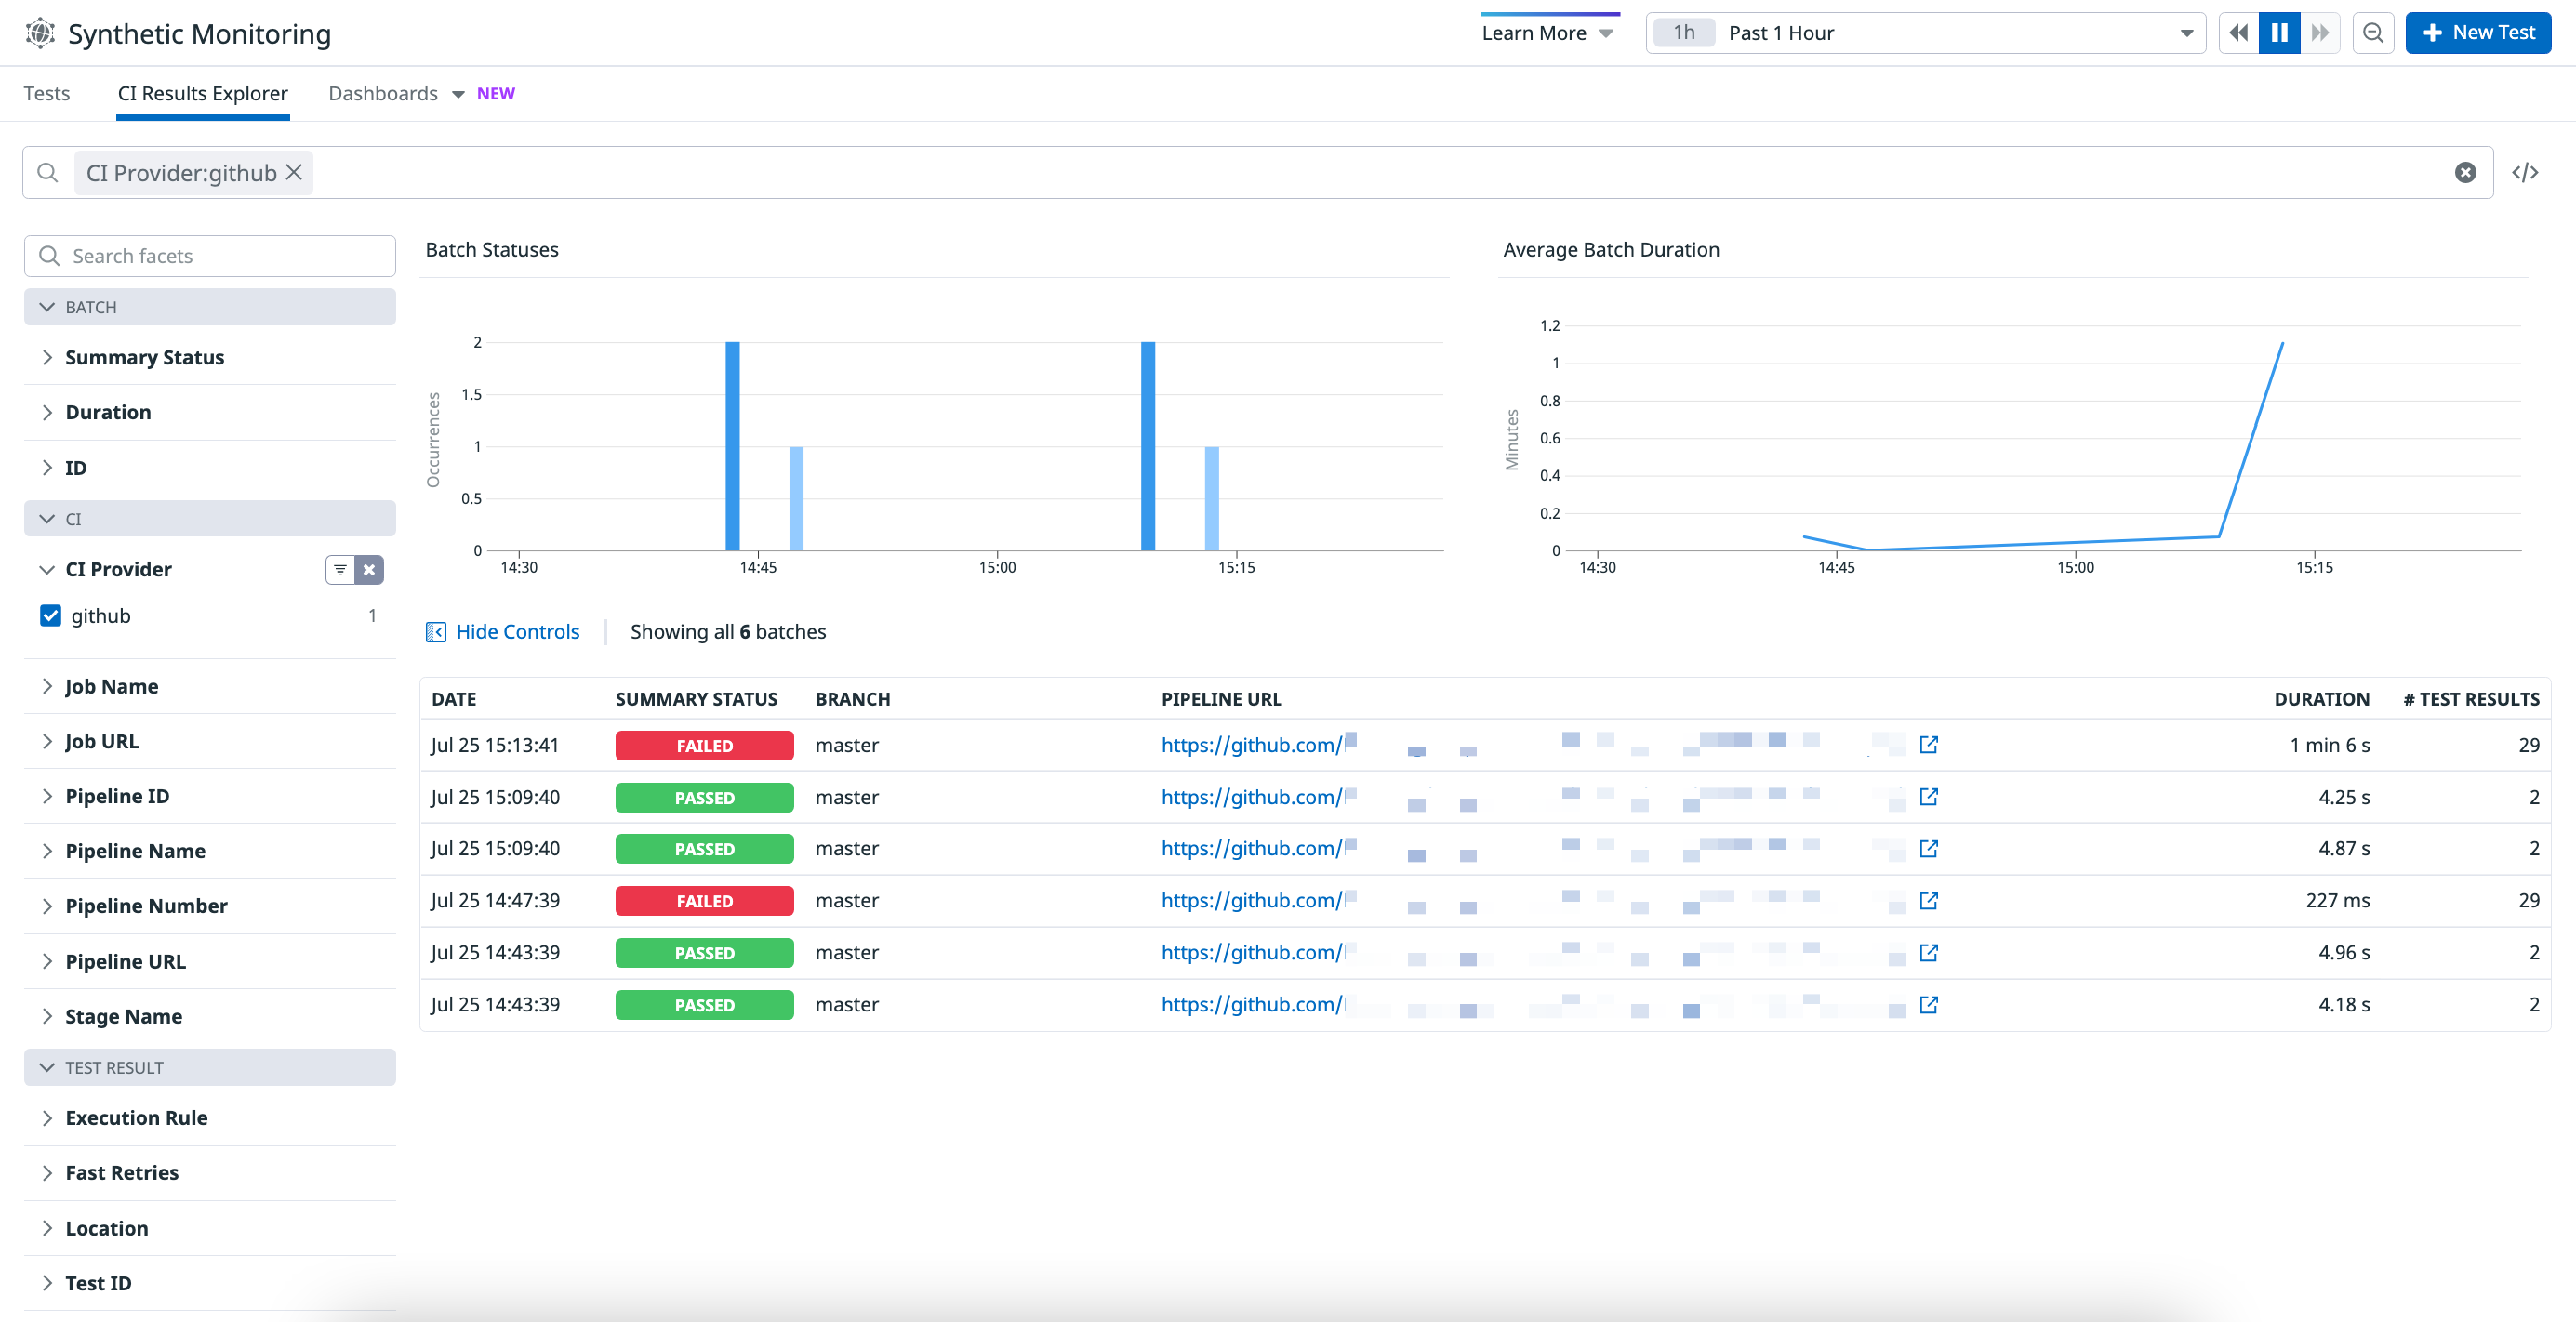
CI Visibility
The CI Visibility Explorer displays your CI pipeline executions.
To filter pipeline executions by tags, use the search bar or facet checkboxes. The search bar format is <KEY>:<VALUE>. For example: @ci.provider.name:gitlab. For advanced search, see Search and Manage CI Pipelines.
DORA Metrics
The DORA Metrics Explorer displays your DORA Metrics aggregations. To filter the displayed metrics and aggregations by tags, use the + Filter button to add facets for existing tags. For querying with tags in graphs and dashboards, see DORA Metrics Create Custom Dashboards.
Developers
Tags can be used in various ways with the API.
See this list for links to respective sections:
Further Reading
Additional helpful documentation, links, and articles: