- Agents
- Essentials
- Getting Started
- Agent
- API
- APM Tracing
- Containers
- Dashboards
- Database Monitoring
- Datadog
- Datadog Site
- DevSecOps
- Incident Management
- Integrations
- Internal Developer Portal
- Logs
- Monitors
- Notebooks
- OpenTelemetry
- Profiler
- Search
- Session Replay
- Security
- Serverless for AWS Lambda
- Software Delivery
- Synthetic Monitoring and Testing
- Tags
- Workflow Automation
- Learning Center
- Support
- Glossary
- Standard Attributes
- Guides
- Agent
- Integrations
- Extend Datadog
- Authorization
- DogStatsD
- Custom Checks
- Integrations
- Build an Integration with Datadog
- Create an Agent-based Integration
- Create an API-based Integration
- Create a Log Pipeline
- Integration Assets Reference
- Build a Marketplace Offering
- Create an Integration Dashboard
- Create a Monitor Template
- Create a Cloud SIEM Detection Rule
- Install Agent Integration Developer Tool
- Service Checks
- Community
- Guides
- OpenTelemetry
- Administrator's Guide
- API
- Partners
- Datadog Mobile App
- DDSQL Reference
- CoScreen
- CoTerm
- Remote Configuration
- Cloudcraft (Standalone)
- In The App
- Dashboards
- Notebooks
- DDSQL Editor
- Reference Tables
- Sheets
- Monitors and Alerting
- Service Level Objectives
- Metrics
- Watchdog
- Bits AI
- Internal Developer Portal
- Error Tracking
- Change Tracking
- Event Management
- Incident Response
- Actions & Remediations
- Infrastructure
- Cloudcraft
- Resource Catalog
- Universal Service Monitoring
- End User Device Monitoring
- Hosts
- Containers
- Processes
- Serverless
- Network Monitoring
- Storage Management
- Cloud Cost
- Application Performance
- APM
- Continuous Profiler
- Database Monitoring
- Agent Integration Overhead
- Setup Architectures
- Setting Up Postgres
- Setting Up MySQL
- Setting Up SQL Server
- Setting Up Oracle
- Setting Up Amazon DocumentDB
- Setting Up MongoDB
- Setting Up ClickHouse
- Connecting DBM and Traces
- Data Collected
- Exploring Database Hosts
- Exploring Query Metrics
- Exploring Query Samples
- Exploring Database Schemas
- Exploring Recommendations
- Troubleshooting
- Guides
- Data Streams Monitoring
- Data Observability
- Digital Experience
- Real User Monitoring
- Synthetic Testing and Monitoring
- Continuous Testing
- Experiments
- Product Analytics
- Session Replay
- Software Delivery
- CI Visibility
- CD Visibility
- Deployment Gates
- Test Optimization
- Code Coverage
- PR Gates
- DORA Metrics
- Feature Flags
- Developer Integrations
- Security
- Security Overview
- Cloud SIEM
- Code Security
- Cloud Security
- App and API Protection
- AI Guard
- Workload Protection
- Sensitive Data Scanner
- AI Observability
- Log Management
- Observability Pipelines
- Configuration
- Sources
- Processors
- Destinations
- Packs
- Akamai CDN
- Amazon CloudFront
- Amazon VPC Flow Logs
- AWS Application Load Balancer Logs
- AWS CloudTrail
- AWS Elastic Load Balancer Logs
- AWS Network Load Balancer Logs
- Cisco ASA
- Cloudflare
- F5
- Fastly
- Fortinet Firewall
- HAProxy Ingress
- Istio Proxy
- Juniper SRX Firewall Traffic Logs
- Netskope
- NGINX
- Okta
- Palo Alto Firewall
- Windows XML
- ZScaler ZIA DNS
- Zscaler ZIA Firewall
- Zscaler ZIA Tunnel
- Zscaler ZIA Web Logs
- Search Syntax
- Scaling and Performance
- Monitoring and Troubleshooting
- Guides and Resources
- Log Management
- CloudPrem
- Administration
- Account Management
- Data Security
- Help
Getting Started with AWS Lambda Serverless Monitoring
Overview
Serverless is a model where developers build and run applications and services using a cloud provider, rather than managing infrastructure themselves. Datadog Serverless Monitoring collects metrics, logs, and traces from your serverless infrastructure, enabling you to monitor your application’s health and performance.
This guide makes use of a serverless sample app that you can launch using a programming language and infrastructure as code (IaC) tool you are familiar with. This app has Serverless Monitoring preconfigured. Follow this guide to see how you might troubleshoot a problem in your sample app, and what kinds of visibility Serverless Monitoring can provide.
Deploy the sample app
- Clone the sample app repository to your local machine.
- Choose a runtime and IaC tool of your choice and follow the link to the specific deployment instructions
- Find your Datadog API key and Datadog site (
). You will need them for the next step. - Follow the runtime and IaC specific instructions to deploy the sample application.
- After the deployment completes, you can either use the Postman collection in the root of the repository or run the load test.
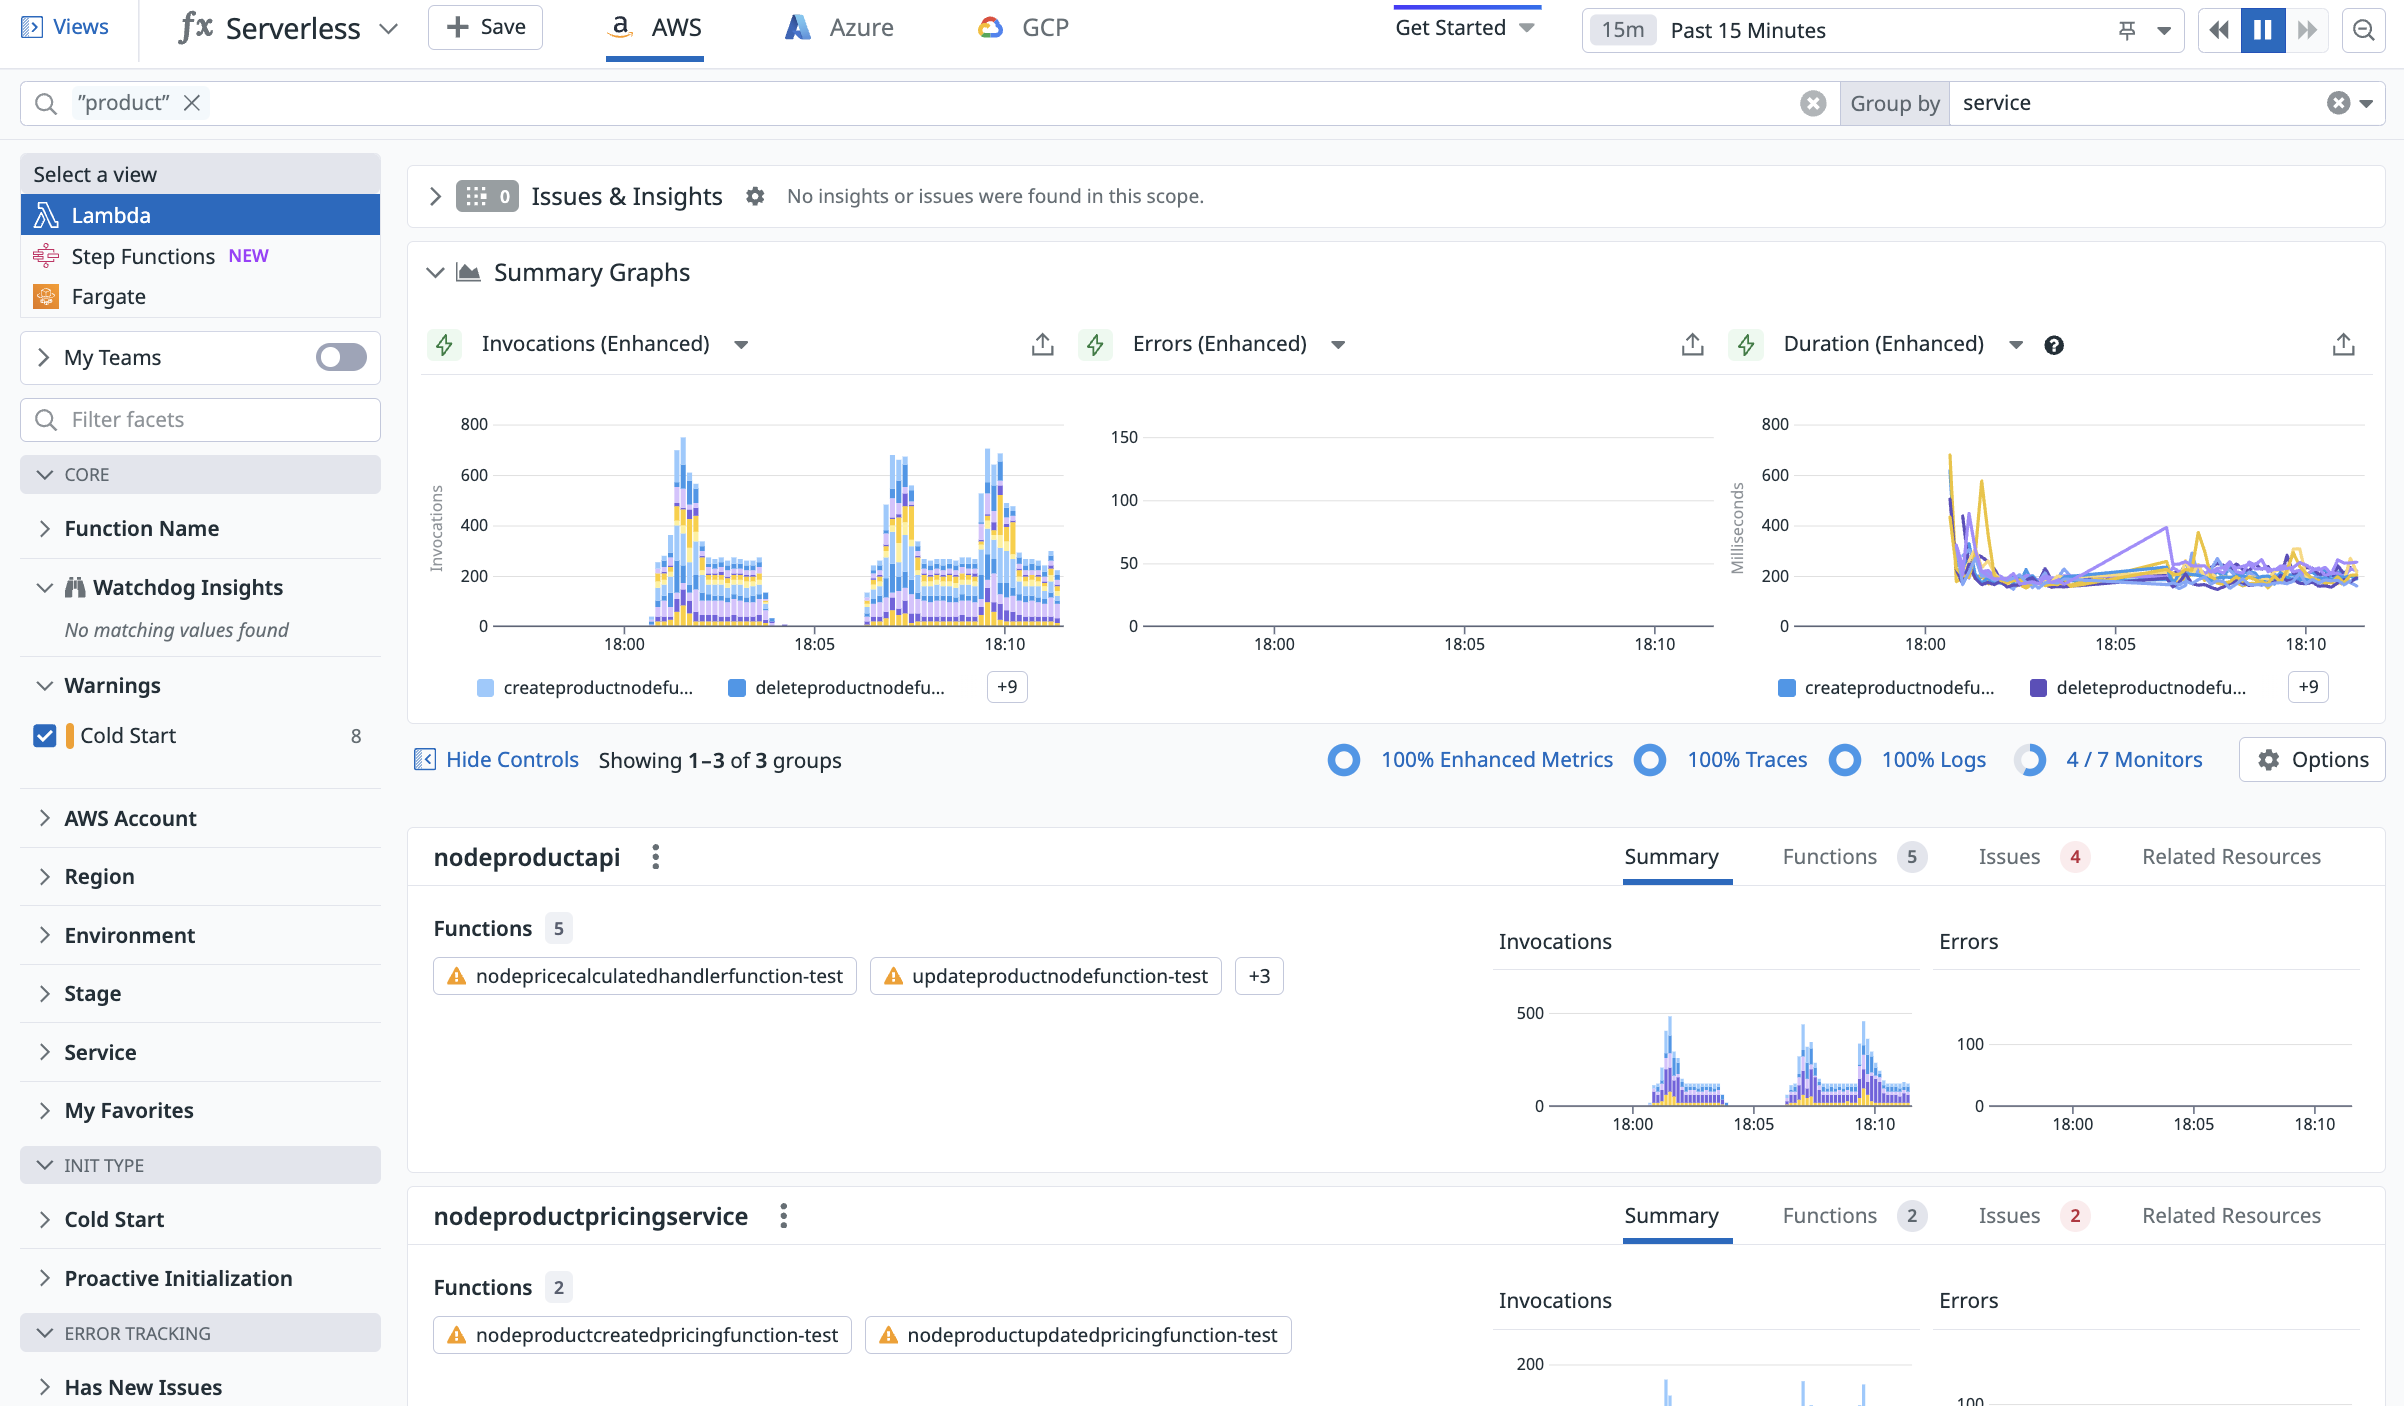
You can see your sample app functions in Serverless View.
Serverless View
The Serverless View displays telemetry from all serverless resources in your AWS environment. You can use this page as a starting point for monitoring, debugging, and optimizing your applications.
The Serverless View groups your resources by the SERVICE_NAME. If you have invoked your functions at least once, you will see a separate service group for each of the individual backend services.
Serverless Insights
In Serverless View, the rightmost column is titled Insights. Datadog automatically highlights potential issues in your serverless applications, such as high errors and high duration; these issues appear in the Insights column.
For your serverless sample application, Datadog has likely detected a cold start. Cold starts occur when your serverless application receives a sudden increase in traffic. This can happen if the function was previously receiving a relatively constant number of requests and abruptly started receiving more—or, as in this case, when the function was previously inactive and has been invoked for the first time.
Investigate Errors
The sample application periodically generates errors and has a slow response. This causes Lambda timeouts in the product pricing service.
Notice that both of the services under the product-pricing-service have errors. The Issues & Insights section at the top also identifies that one of your services has issues with timeouts.
Function details
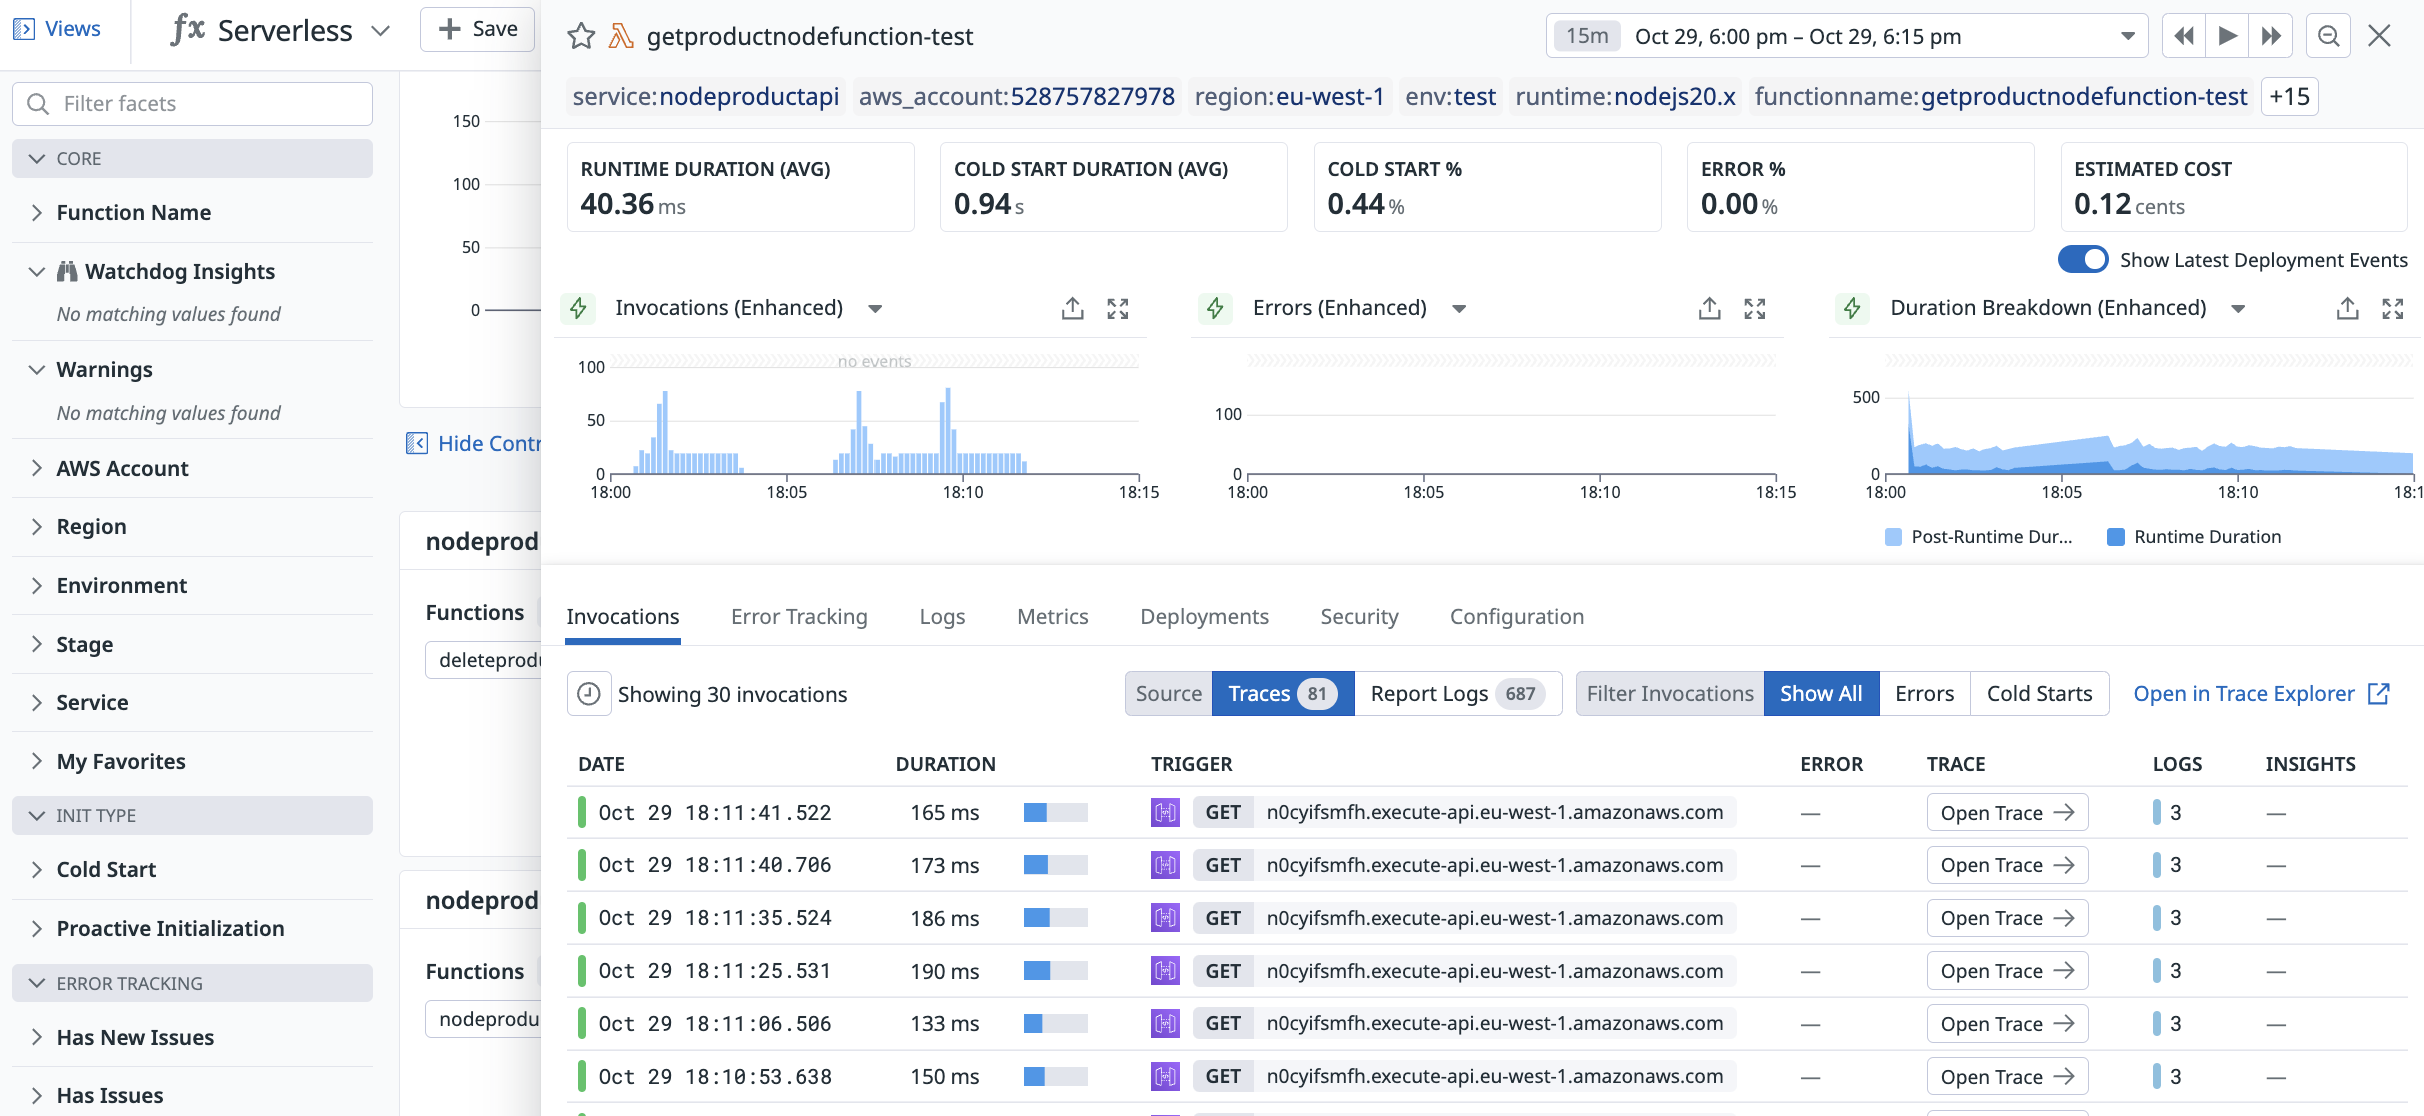
Click on your function to see more details regarding invocations and recent deployments.
The detailed view, as shown above, contains three graphs. You can set these to display any available metric; by default, they show three enhanced Lambda metrics: invocations, errors, and duration.
Datadog generates enhanced Lambda metrics out-of-the-box with low latency, several second granularity, and detailed metadata for cold starts and custom tags. You can also view the default enhanced Lambda metrics dashboard.
Invocations
The Invocations tab displays your function’s latest invocations.
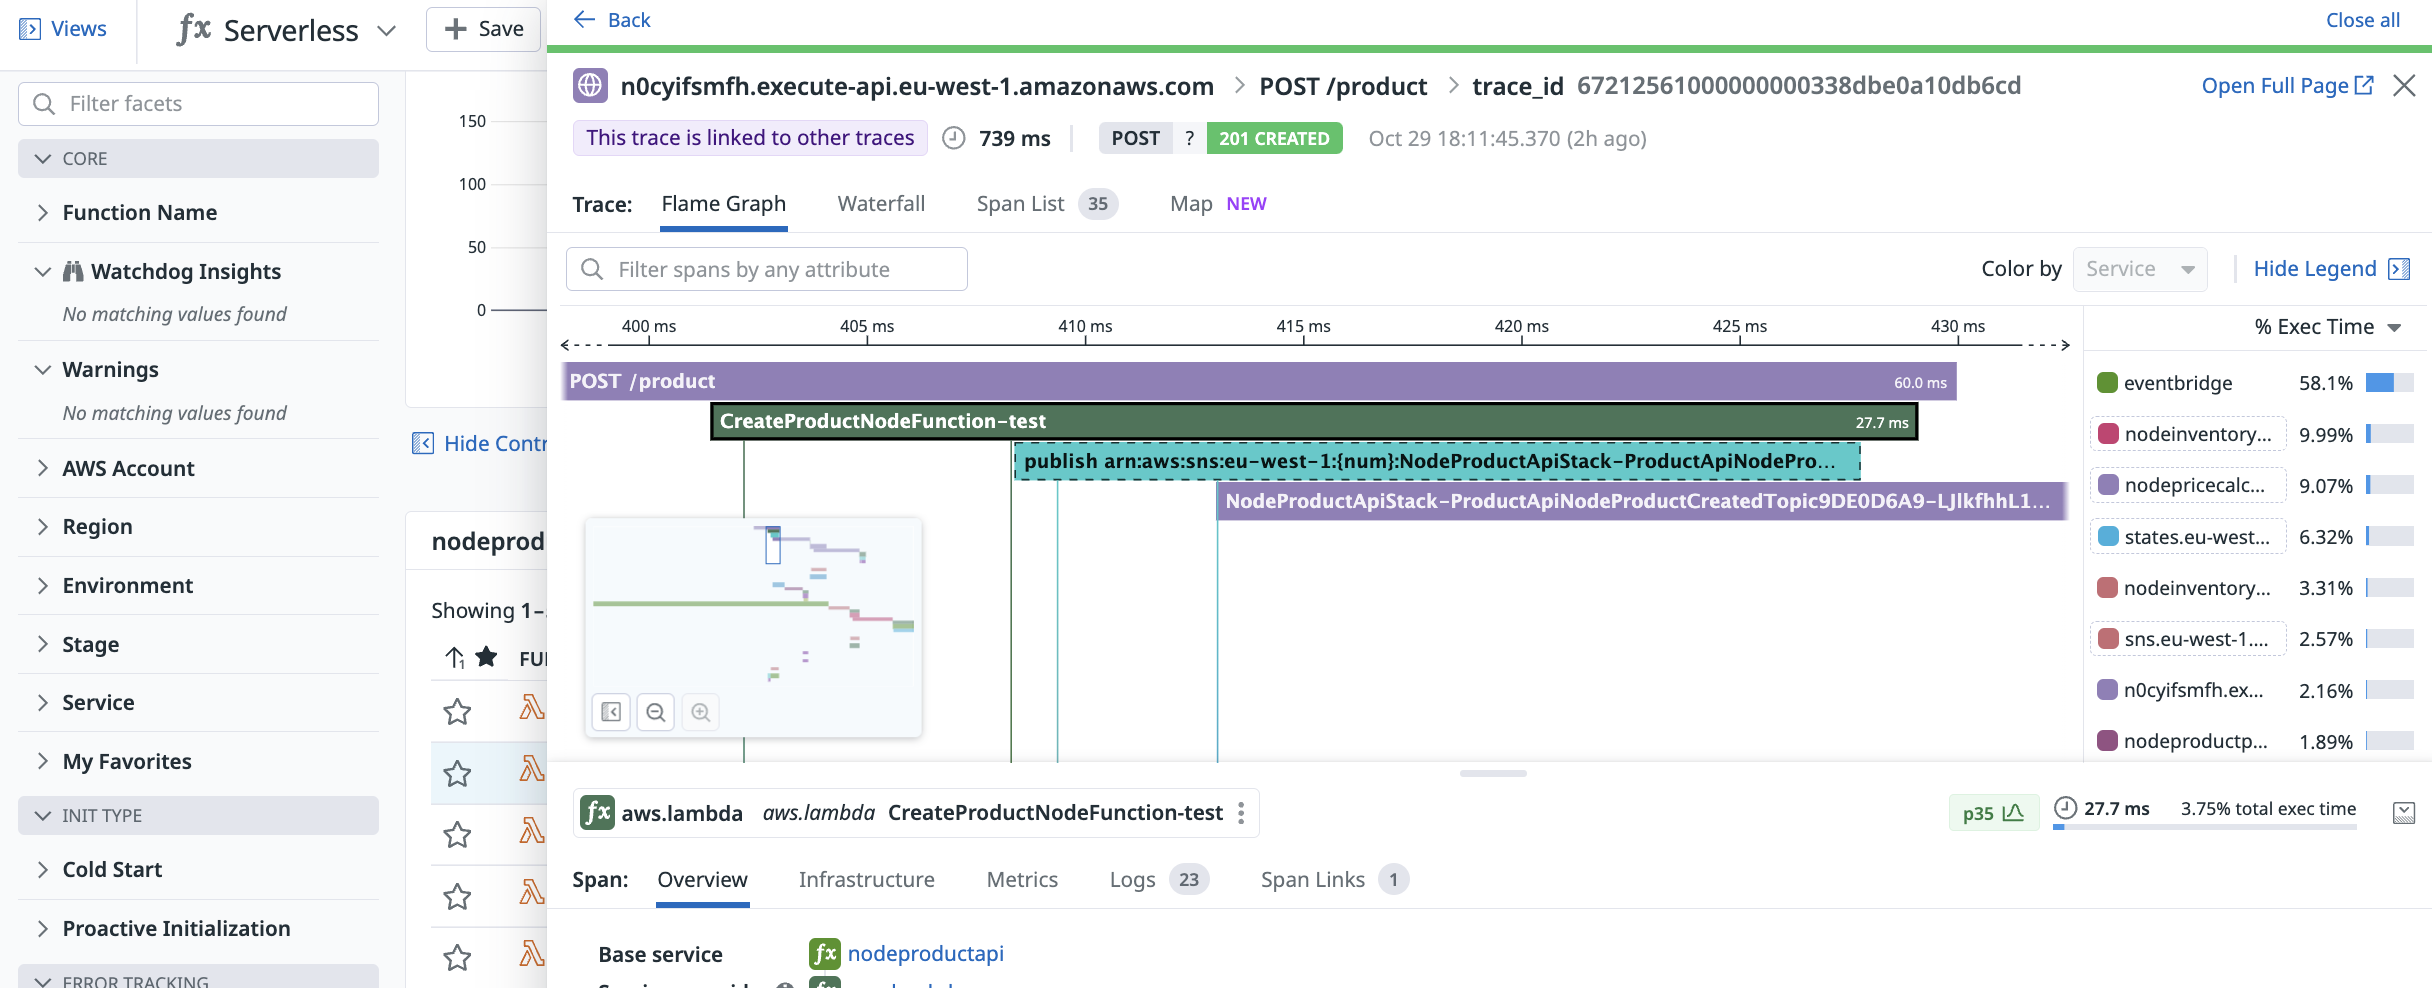
Each invocation is associated with a trace. Click on Open Trace to see the trace for each invocation:
The Flame Graph tab shows exactly what happened during the duration of this invocation, including which services had the highest percentage of the total execution time. The flame graph displays the request as it travels from APIGateway, through your create-product-function.
If you zoom out, you will also see the entire end to end trace through all of the downstream services.
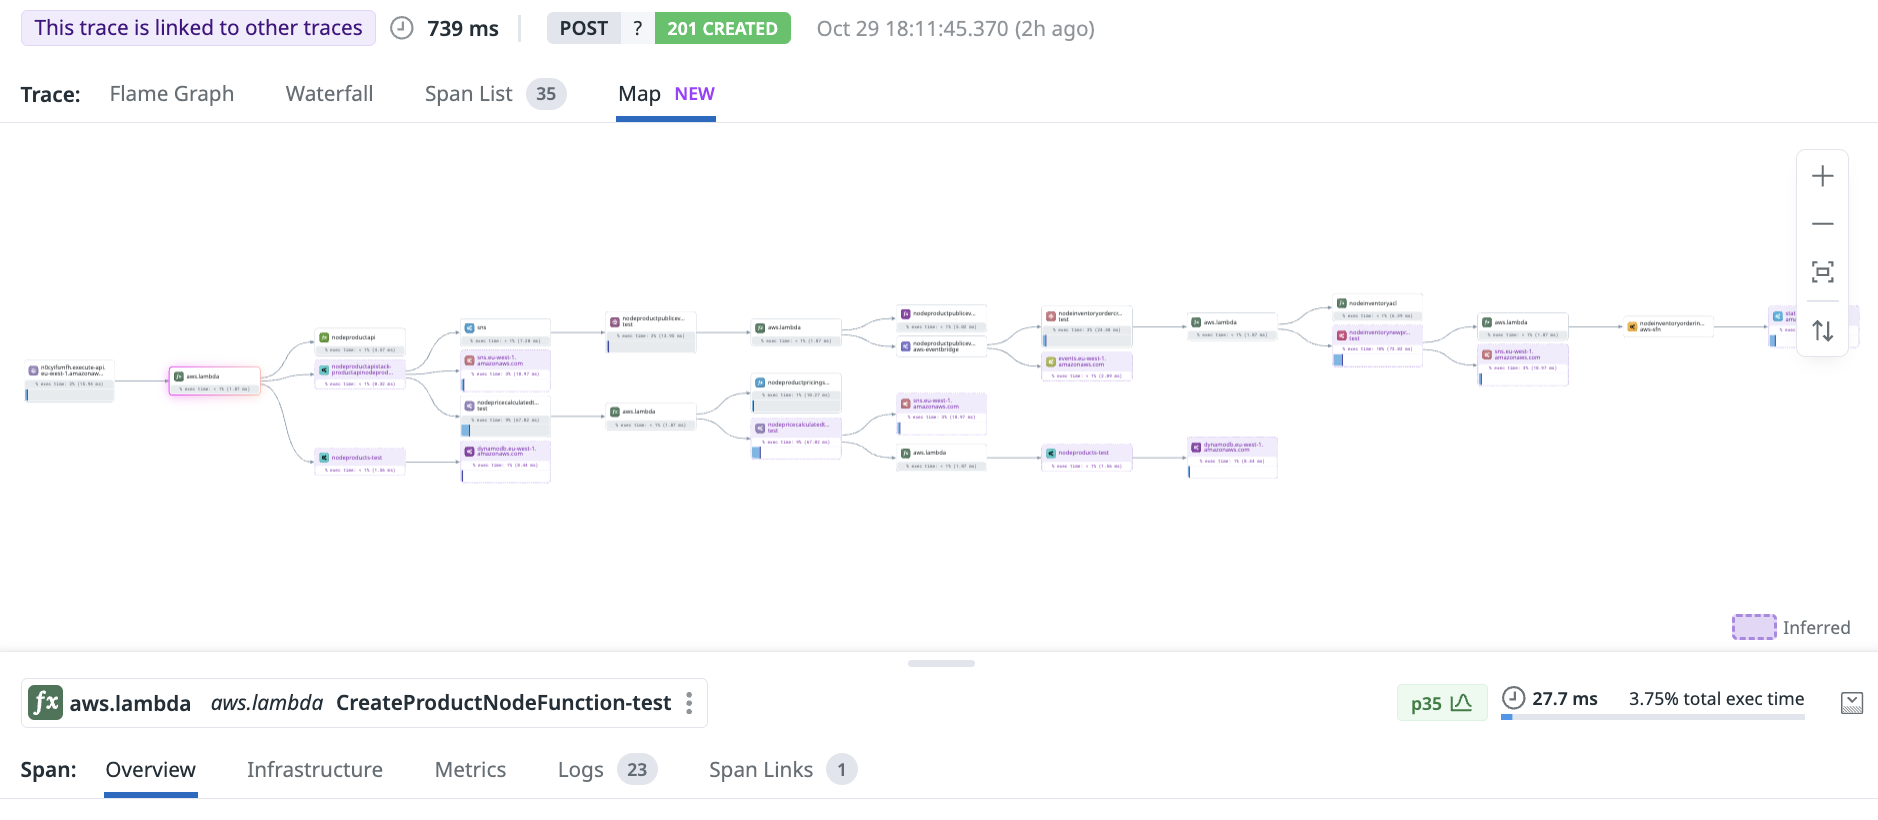
The Trace Map tab visualizes the flow of your services and how they connect to each other.
If you are viewing a trace with an error, the lower half of the detailed trace view shows the details:
Error: Failure generating prices
  at PricingService.calculate (/var/task/index.js:94382:13)
  at ProductUpdatedEventHandler.handle (/var/task/index.js:95826:51)
  at handler (/var/task/index.js:95854:34)
Underneath, you can also examine your Lambda request and response payloads. Datadog collects event payloads for every Lambda invocation.
Logs
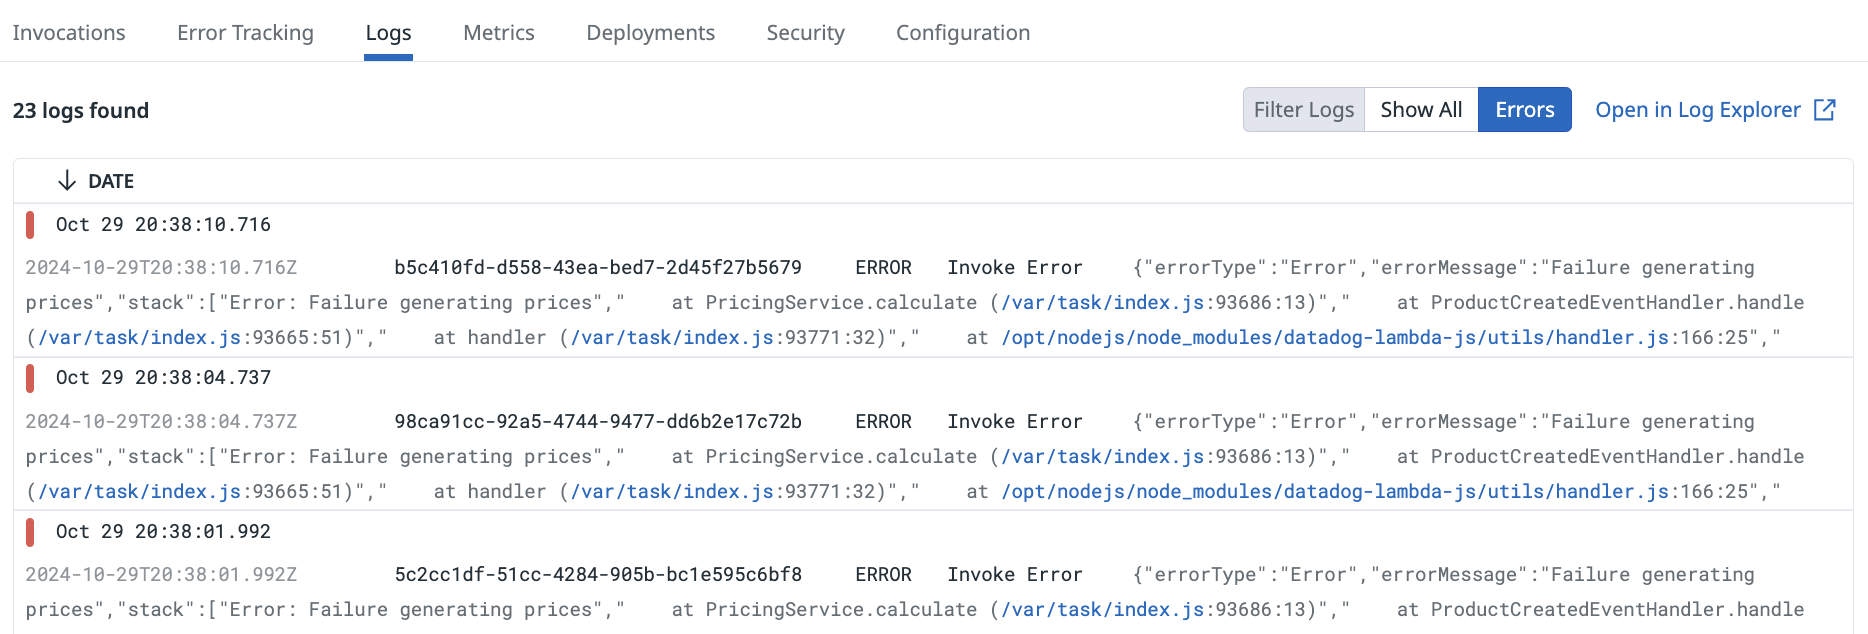
The serverless sample app has logs enabled by default. You can see each function’s logs under its Logs tab.
You can filter these logs to only see errors, or view them in the Log Explorer.
