- Essentials
- Getting Started
- Agent
- API
- APM Tracing
- Containers
- Dashboards
- Database Monitoring
- Datadog
- Datadog Site
- DevSecOps
- Incident Management
- Integrations
- Internal Developer Portal
- Logs
- Monitors
- Notebooks
- OpenTelemetry
- Profiler
- Search
- Session Replay
- Security
- Serverless for AWS Lambda
- Software Delivery
- Synthetic Monitoring and Testing
- Tags
- Workflow Automation
- Learning Center
- Support
- Glossary
- Standard Attributes
- Guides
- Agent
- Integrations
- Developers
- Authorization
- DogStatsD
- Custom Checks
- Integrations
- Build an Integration with Datadog
- Create an Agent-based Integration
- Create an API-based Integration
- Create a Log Pipeline
- Integration Assets Reference
- Build a Marketplace Offering
- Create an Integration Dashboard
- Create a Monitor Template
- Create a Cloud SIEM Detection Rule
- Install Agent Integration Developer Tool
- Service Checks
- IDE Plugins
- Community
- Guides
- OpenTelemetry
- Administrator's Guide
- API
- Partners
- Datadog Mobile App
- DDSQL Reference
- CoScreen
- CoTerm
- Remote Configuration
- Cloudcraft (Standalone)
- In The App
- Dashboards
- Notebooks
- DDSQL Editor
- Reference Tables
- Sheets
- Monitors and Alerting
- Service Level Objectives
- Metrics
- Watchdog
- Bits AI
- Internal Developer Portal
- Error Tracking
- Change Tracking
- Event Management
- Incident Response
- Actions & Remediations
- Infrastructure
- Cloudcraft
- Resource Catalog
- Universal Service Monitoring
- End User Device Monitoring
- Hosts
- Containers
- Processes
- Serverless
- Network Monitoring
- Storage Management
- Cloud Cost
- Application Performance
- APM
- Continuous Profiler
- Database Monitoring
- Agent Integration Overhead
- Setup Architectures
- Setting Up Postgres
- Setting Up MySQL
- Setting Up SQL Server
- Setting Up Oracle
- Setting Up Amazon DocumentDB
- Setting Up MongoDB
- Connecting DBM and Traces
- Data Collected
- Exploring Database Hosts
- Exploring Query Metrics
- Exploring Query Samples
- Exploring Database Schemas
- Exploring Recommendations
- Troubleshooting
- Guides
- Data Streams Monitoring
- Data Observability
- Digital Experience
- Real User Monitoring
- Synthetic Testing and Monitoring
- Continuous Testing
- Product Analytics
- Session Replay
- Software Delivery
- CI Visibility
- CD Visibility
- Deployment Gates
- Test Optimization
- Code Coverage
- PR Gates
- DORA Metrics
- Feature Flags
- Security
- Security Overview
- Cloud SIEM
- Code Security
- Cloud Security
- App and API Protection
- Workload Protection
- Sensitive Data Scanner
- AI Observability
- Log Management
- Administration
Getting Started in Datadog

Try Datadog Core Skills in the Learning Center
Learn without cost on real cloud compute capacity and a Datadog trial account. Start these hands-on labs to get up to speed with tagging, metrics, monitors, and dashboards.
Overview
This page provides a high-level overview of capabilities available on the Datadog site.
The Datadog site navigation varies based on the width of your browser. You can have up to three types of navigation. To change the navigation type, adjust your browser width.
You can press Cmd/Ctrl + K to search for pages and entities, like dashboards and monitors, across Datadog.
You can press Cmd/Ctrl + K to search for pages and entities, like dashboards and monitors, across Datadog.
Infrastructure
The infrastructure list serves as a central view of all your infrastructure resources (hosts, containers, processes, etc.) and their associated metadata.
Key capabilities:
- Investigate infrastructure performance.
- Arrange, filter, and visualize hosts based on tags and metrics.
- Inspect hosts to review their tags, performance, health, and more.
Navigate to Infrastructure > Hosts in the app to get started. To learn more, read the Infrastructure List documentation.
Host and container maps
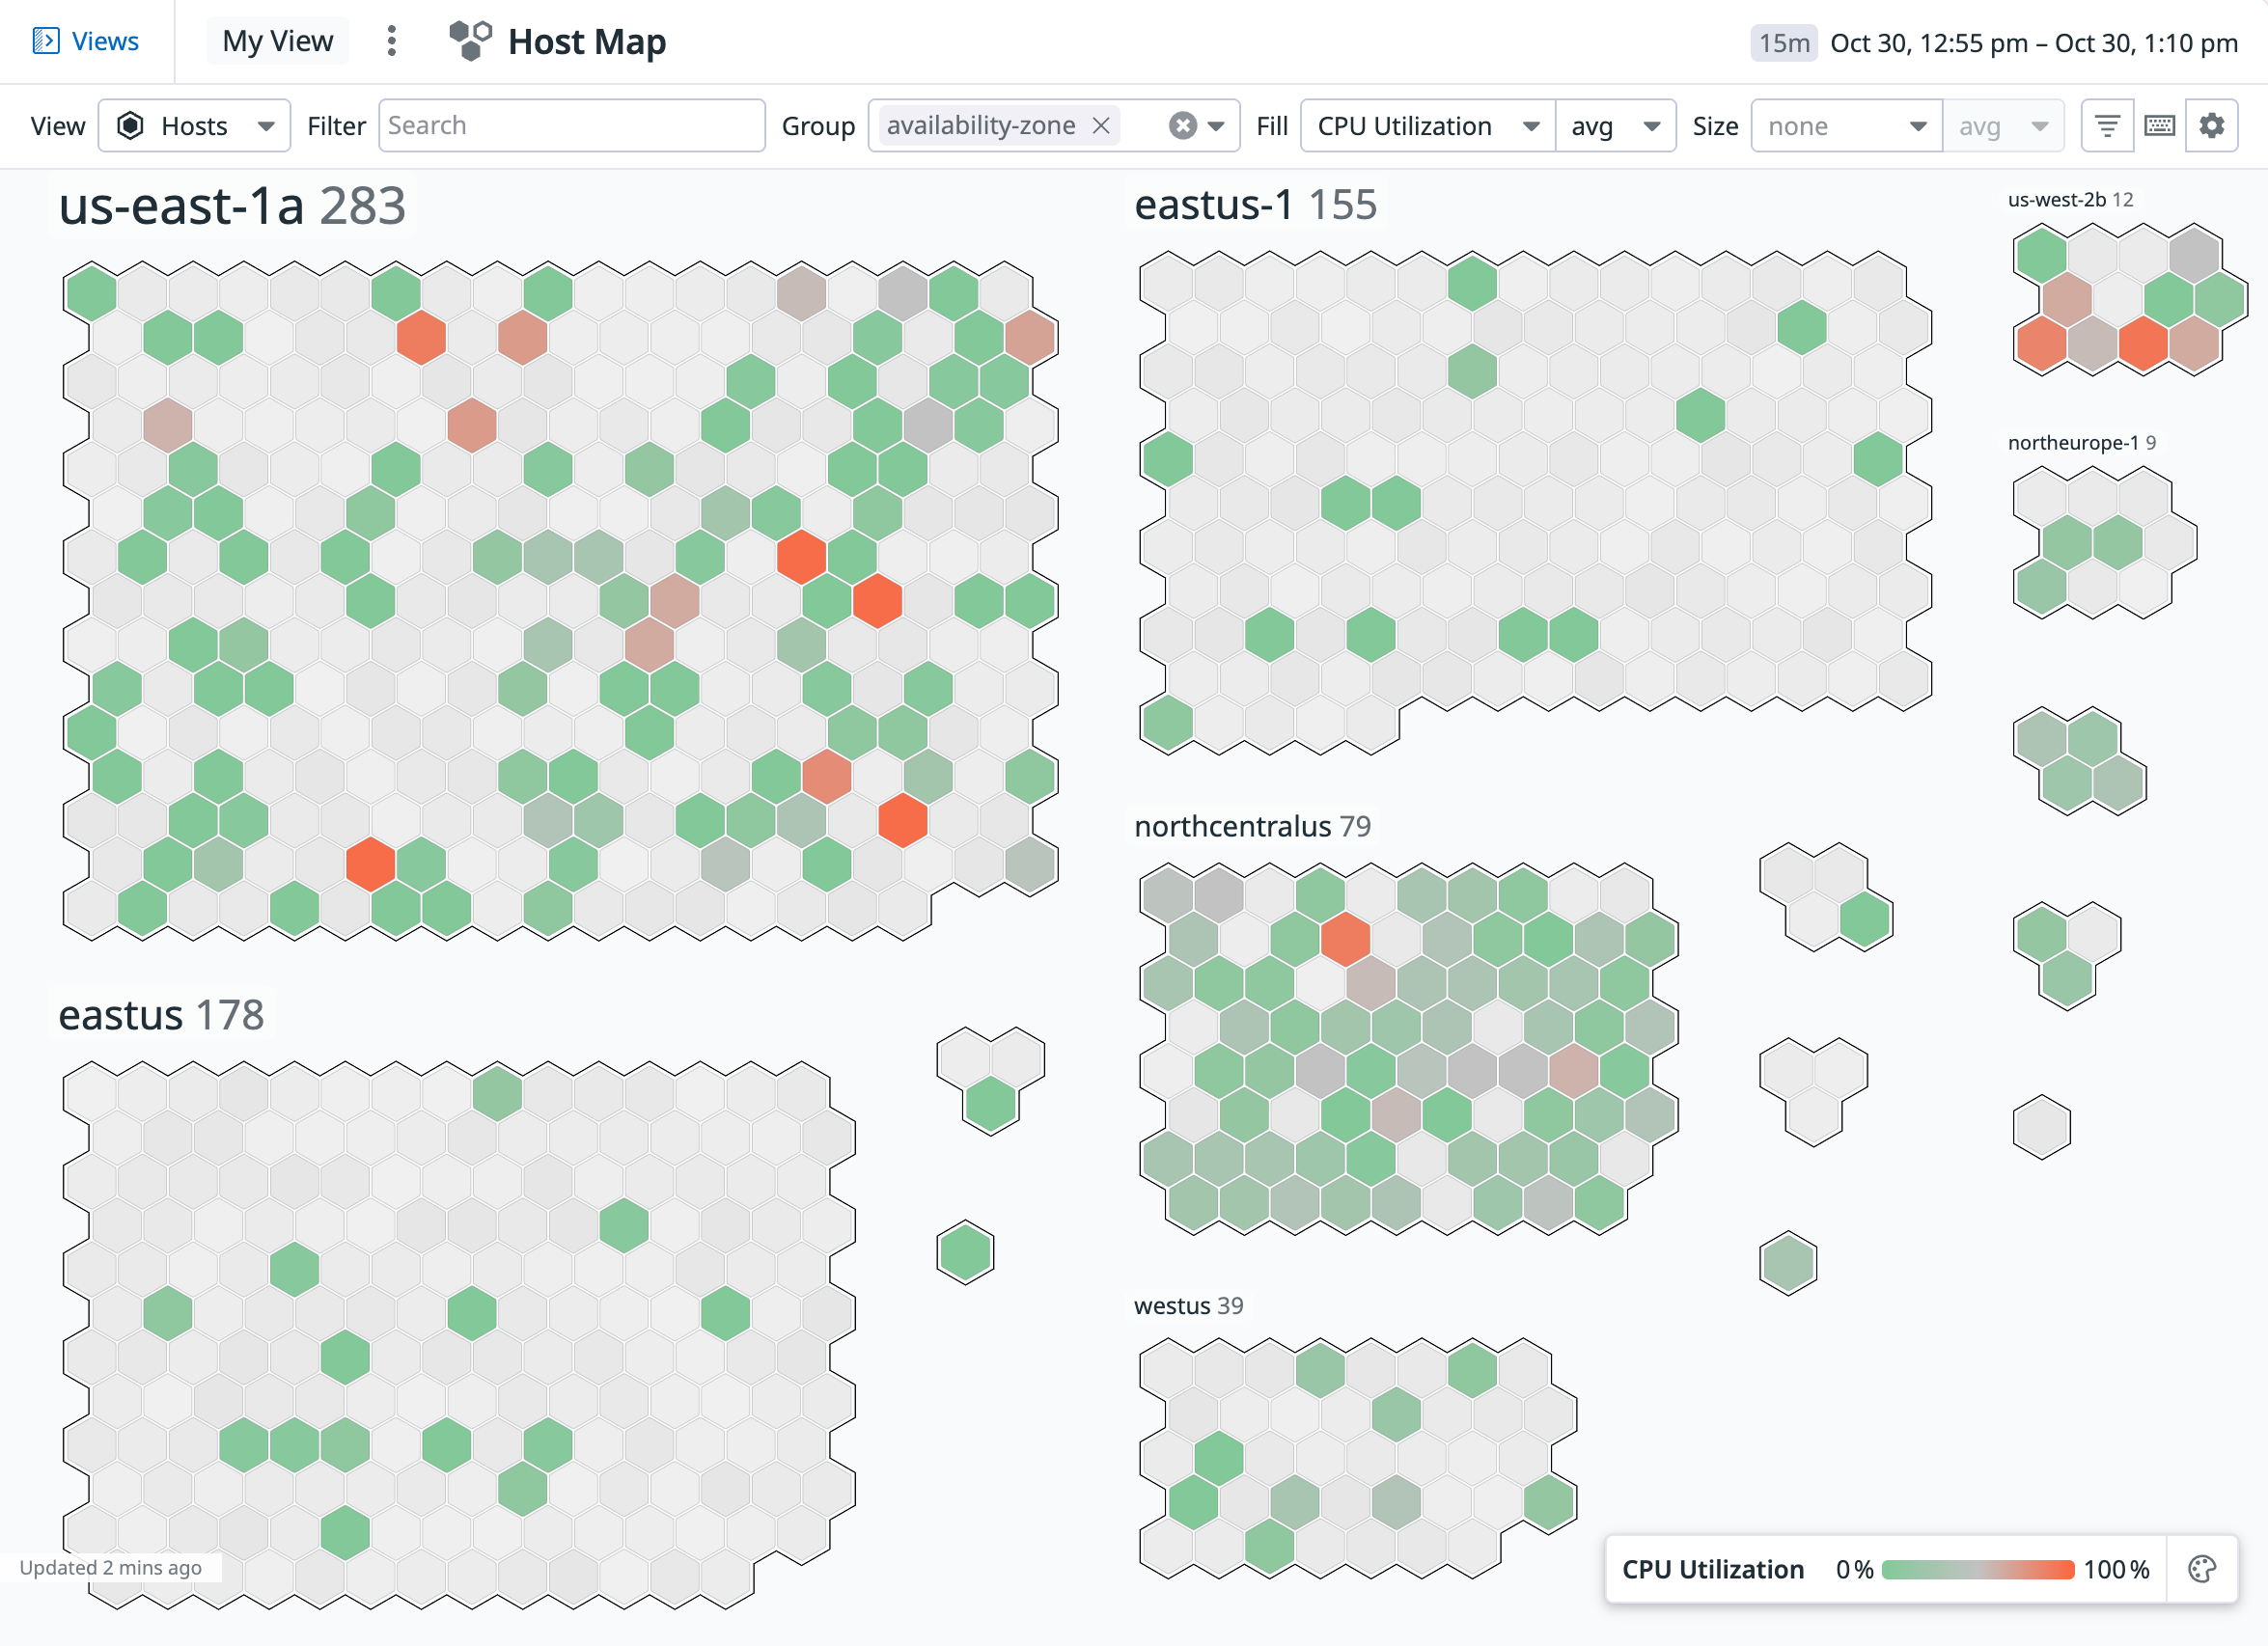
Host and container maps give you a visual overview of all your hosts and containers, color-coding them by key metrics like CPU usage so you can spot issues.
Key capabilities:
- View your entire infrastructure at once as a visual map.
- Color-code by a variety of metrics to help you spot performance issues, and filter and group by tags and metadata.
- Drill down into individual hosts or containers to troubleshoot.
Navigate to Infrastructure > Host Map in the app to get started. To learn more, read the Host and Container Maps documentation.
Log Management
Datadog Log Management lets you send and process every log produced by your applications and infrastructure. You can observe your logs in real-time using the Live Tail, without indexing them.
Key capabilities:
- Automatically collect logs from all services, applications, and platforms.
- View and search logs in real time and filter by things like service, host, and error type.
- Choose which logs to keep and for how long, reducing storage costs.
Navigate to Logs in the app to get started. To learn more, read the Log Management documentation.
APM
Datadog Application Performance Monitoring (APM or tracing) provides you with deep insight into your application’s performance side by side with your logs and infrastructure monitoring.
Key capabilities:
- Trace requests to an application from end to end across a distributed system.
- See performance bottlenecks by visualizing time spent at each step of the request.
- Visualize service dependencies and data flows with the Service Map.
- Correlate traces with corresponding logs, metrics, and user sessions for full-stack context.
Navigate to APM in the app to get started. To learn more, read the APM documentation.
RUM & Session Replay
Datadog Real User Monitoring (RUM) allows you to visualize and analyze real-time user activities and experiences across web and mobile applications. With Session Replay, you can capture and view user sessions to better understand their behavior.
Key capabilities:
- Monitor performance across web browsers and mobile platforms (iOS, Android, React Native, Flutter, and more) with Core Web Vitals and Mobile Vitals.
- Track and troubleshoot errors with automated grouping, crash reporting, and suspect commit identification.
- Detect user frustration signals like rage clicks and error clicks to identify UX issues.
- Monitor feature flag performance and adoption.
- Correlate frontend issues with backend traces, logs, and infrastructure metrics for full-stack visibility.
Navigate to the RUM explorer in the app to get started. To learn more, read the RUM documentation.
Synthetic Monitoring
Datadog Synthetic Monitoring allows you to create and run API, browser, mobile, and Network Path tests that proactively monitor simulated requests and actions from around the globe. These tests monitor your applications and APIs to detect performance issues and downtime before they impact users.
Key capabilities:
- Test business-critical API endpoints and user journeys.
- Detect errors, identify regressions, and automate rollbacks to prevent issues from surfacing in production.
- Find and alert on performance issues for users in various locations.
Navigate to Synthetic Monitoring & Testing in the app to get started. To learn more, read the Synthetic Monitoring documentation.
Integrations
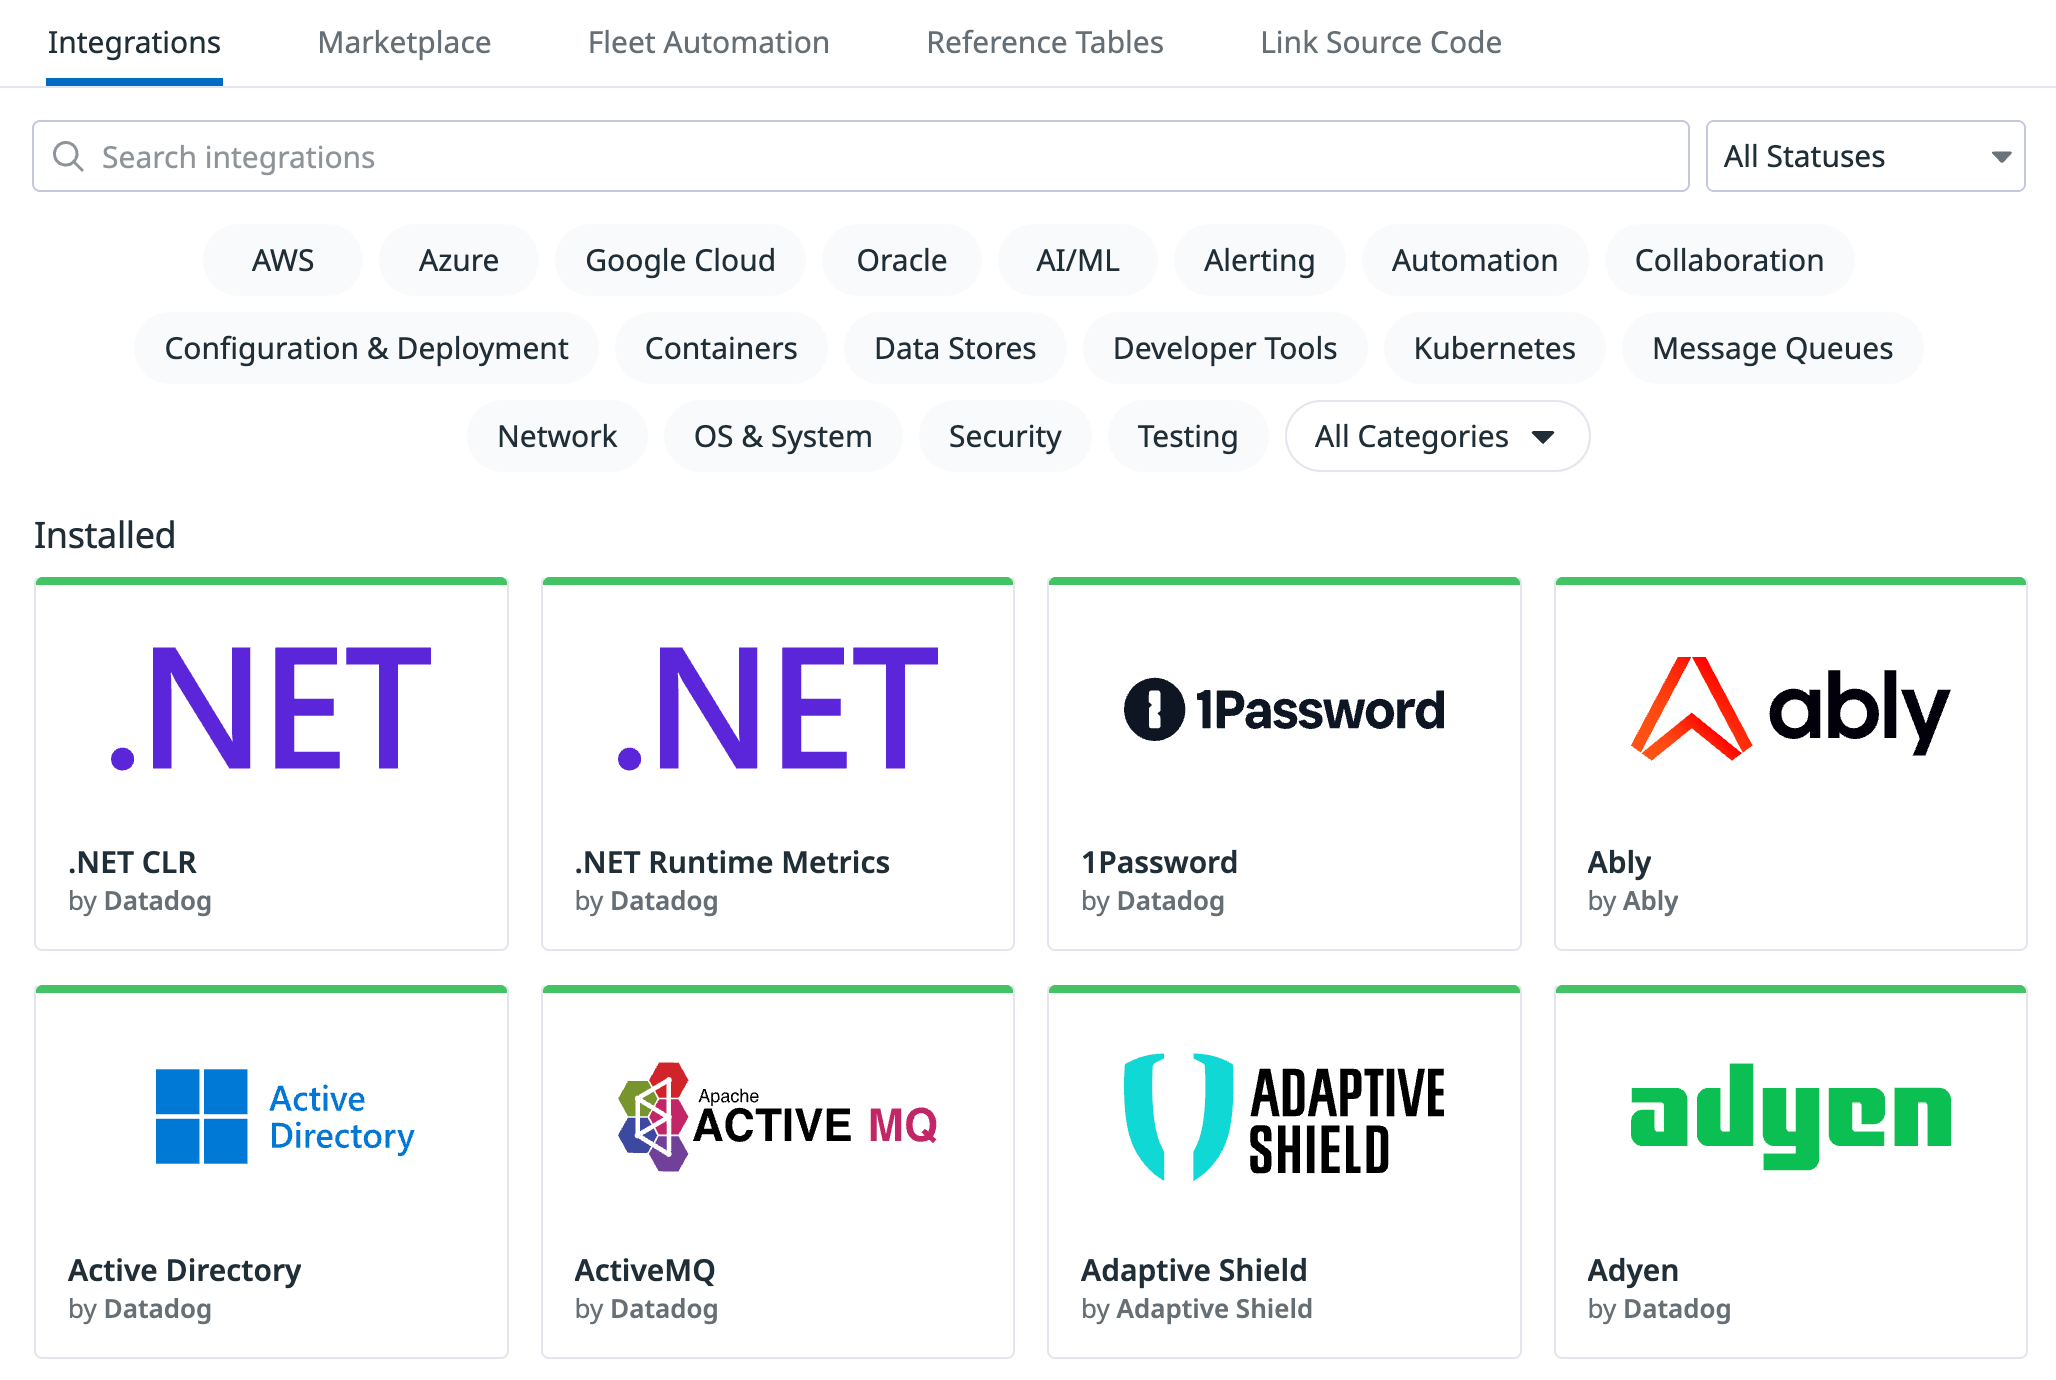
Use Datadog’s 1,000 integrations to bring together all of the metrics and logs from your infrastructure and gain insights into your entire observability system.
Key capabilities:
- Available integrations cover cloud technologies, incident response, data layers, security, AI, and more.
- After integrations have been configured, all data is treated the same throughout Datadog, whether it is living in a data center or in an online service.
- Build your own integration using the developer documentation.
Navigate to Integrations in the app to get started, or browse the list of integrations in the documentation.
Dashboards
Dashboards contain graphs with real-time performance metrics, unifying your view of data across metrics, logs, traces, and more.
Key capabilities:
- Start with out-of-the-box dashboards or build your own to suit your specific questions.
- Customize dashboards with drag-and-drop widgets, custom queries, and flexible layouts.
- Combine multiple data types (including metrics, logs, APM, and RUM) in one place and view data in real time.
- Annotate your graphs with comments or events for your team’s context.
Navigate to the Dashboard List in the app to get started. To learn more, read the Dashboards documentation.
Monitors
Monitors provide alerts and notifications based on metric thresholds, integration availability, network endpoints, and more.
- Create monitors using any metric reporting to Datadog.
- Build complex alerting logic using multiple trigger conditions.
- Send alerts to Slack, email, PagerDuty, and more, by adding
@in alert messages to direct notifications to the right people. - Schedule downtimes to suppress notifications for system shutdowns, offline maintenance, and more.
Navigate to the Monitors List in the app to get started. To learn more, read the Monitors documentation.
Further Reading
Additional helpful documentation, links, and articles:


