- Essentials
- Getting Started
- Agent
- API
- APM Tracing
- Containers
- Dashboards
- Database Monitoring
- Datadog
- Datadog Site
- DevSecOps
- Incident Management
- Integrations
- Internal Developer Portal
- Logs
- Monitors
- OpenTelemetry
- Profiler
- Session Replay
- Security
- Serverless for AWS Lambda
- Software Delivery
- Synthetic Monitoring and Testing
- Tags
- Workflow Automation
- Learning Center
- Support
- Glossary
- Standard Attributes
- Guides
- Agent
- Integrations
- Developers
- Authorization
- DogStatsD
- Custom Checks
- Integrations
- Create an Agent-based Integration
- Create an API Integration
- Create a Log Pipeline
- Integration Assets Reference
- Build a Marketplace Offering
- Create a Tile
- Create an Integration Dashboard
- Create a Monitor Template
- Create a Cloud SIEM Detection Rule
- OAuth for Integrations
- Install Agent Integration Developer Tool
- Service Checks
- IDE Plugins
- Community
- Guides
- OpenTelemetry
- Administrator's Guide
- API
- Partners
- Datadog Mobile App
- DDSQL Reference
- CoScreen
- CoTerm
- Cloudcraft (Standalone)
- In The App
- Dashboards
- Notebooks
- DDSQL Editor
- Reference Tables
- Sheets
- Monitors and Alerting
- Metrics
- Watchdog
- Bits AI
- Internal Developer Portal
- Error Tracking
- Change Tracking
- Service Management
- Actions & Remediations
- Infrastructure
- Cloudcraft
- Resource Catalog
- Universal Service Monitoring
- Hosts
- Containers
- Processes
- Serverless
- Network Monitoring
- Cloud Cost
- Application Performance
- APM
- APM Terms and Concepts
- Application Instrumentation
- APM Metrics Collection
- Trace Pipeline Configuration
- Correlate Traces with Other Telemetry
- Trace Explorer
- Recommendations
- Code Origins for Spans
- Service Observability
- Endpoint Observability
- Dynamic Instrumentation
- Live Debugger
- Error Tracking
- Data Security
- Guides
- Troubleshooting
- Continuous Profiler
- Database Monitoring
- Agent Integration Overhead
- Setup Architectures
- Setting Up Postgres
- Setting Up MySQL
- Setting Up SQL Server
- Setting Up Oracle
- Setting Up Amazon DocumentDB
- Setting Up MongoDB
- Connecting DBM and Traces
- Data Collected
- Exploring Database Hosts
- Exploring Query Metrics
- Exploring Query Samples
- Exploring Database Schemas
- Exploring Recommendations
- Troubleshooting
- Guides
- Data Streams Monitoring
- Data Jobs Monitoring
- Data Observability
- Digital Experience
- Real User Monitoring
- Synthetic Testing and Monitoring
- Continuous Testing
- Product Analytics
- Software Delivery
- CI Visibility
- CD Visibility
- Deployment Gates
- Test Optimization
- Quality Gates
- DORA Metrics
- Security
- Security Overview
- Cloud SIEM
- Code Security
- Cloud Security
- App and API Protection
- Workload Protection
- Sensitive Data Scanner
- AI Observability
- Log Management
- Observability Pipelines
- Log Management
- Administration
Getting Started in Datadog

Try Datadog Foundation in the Learning Center
Learn without cost on real cloud compute capacity and a Datadog trial account. Start these hands-on labs to get up to speed with services, logs, metrics, integrations, and dashboards.
Overview
This page provides a high-level overview of capabilities available on the Datadog site.
The Datadog site navigation varies based on the width of your browser. You can have up to three types of navigation. To change the navigation type, adjust your browser width.
Tip: You can press Cmd/Ctrl + K to search for pages and entities, like dashboards and monitors, across Datadog.
Integrations
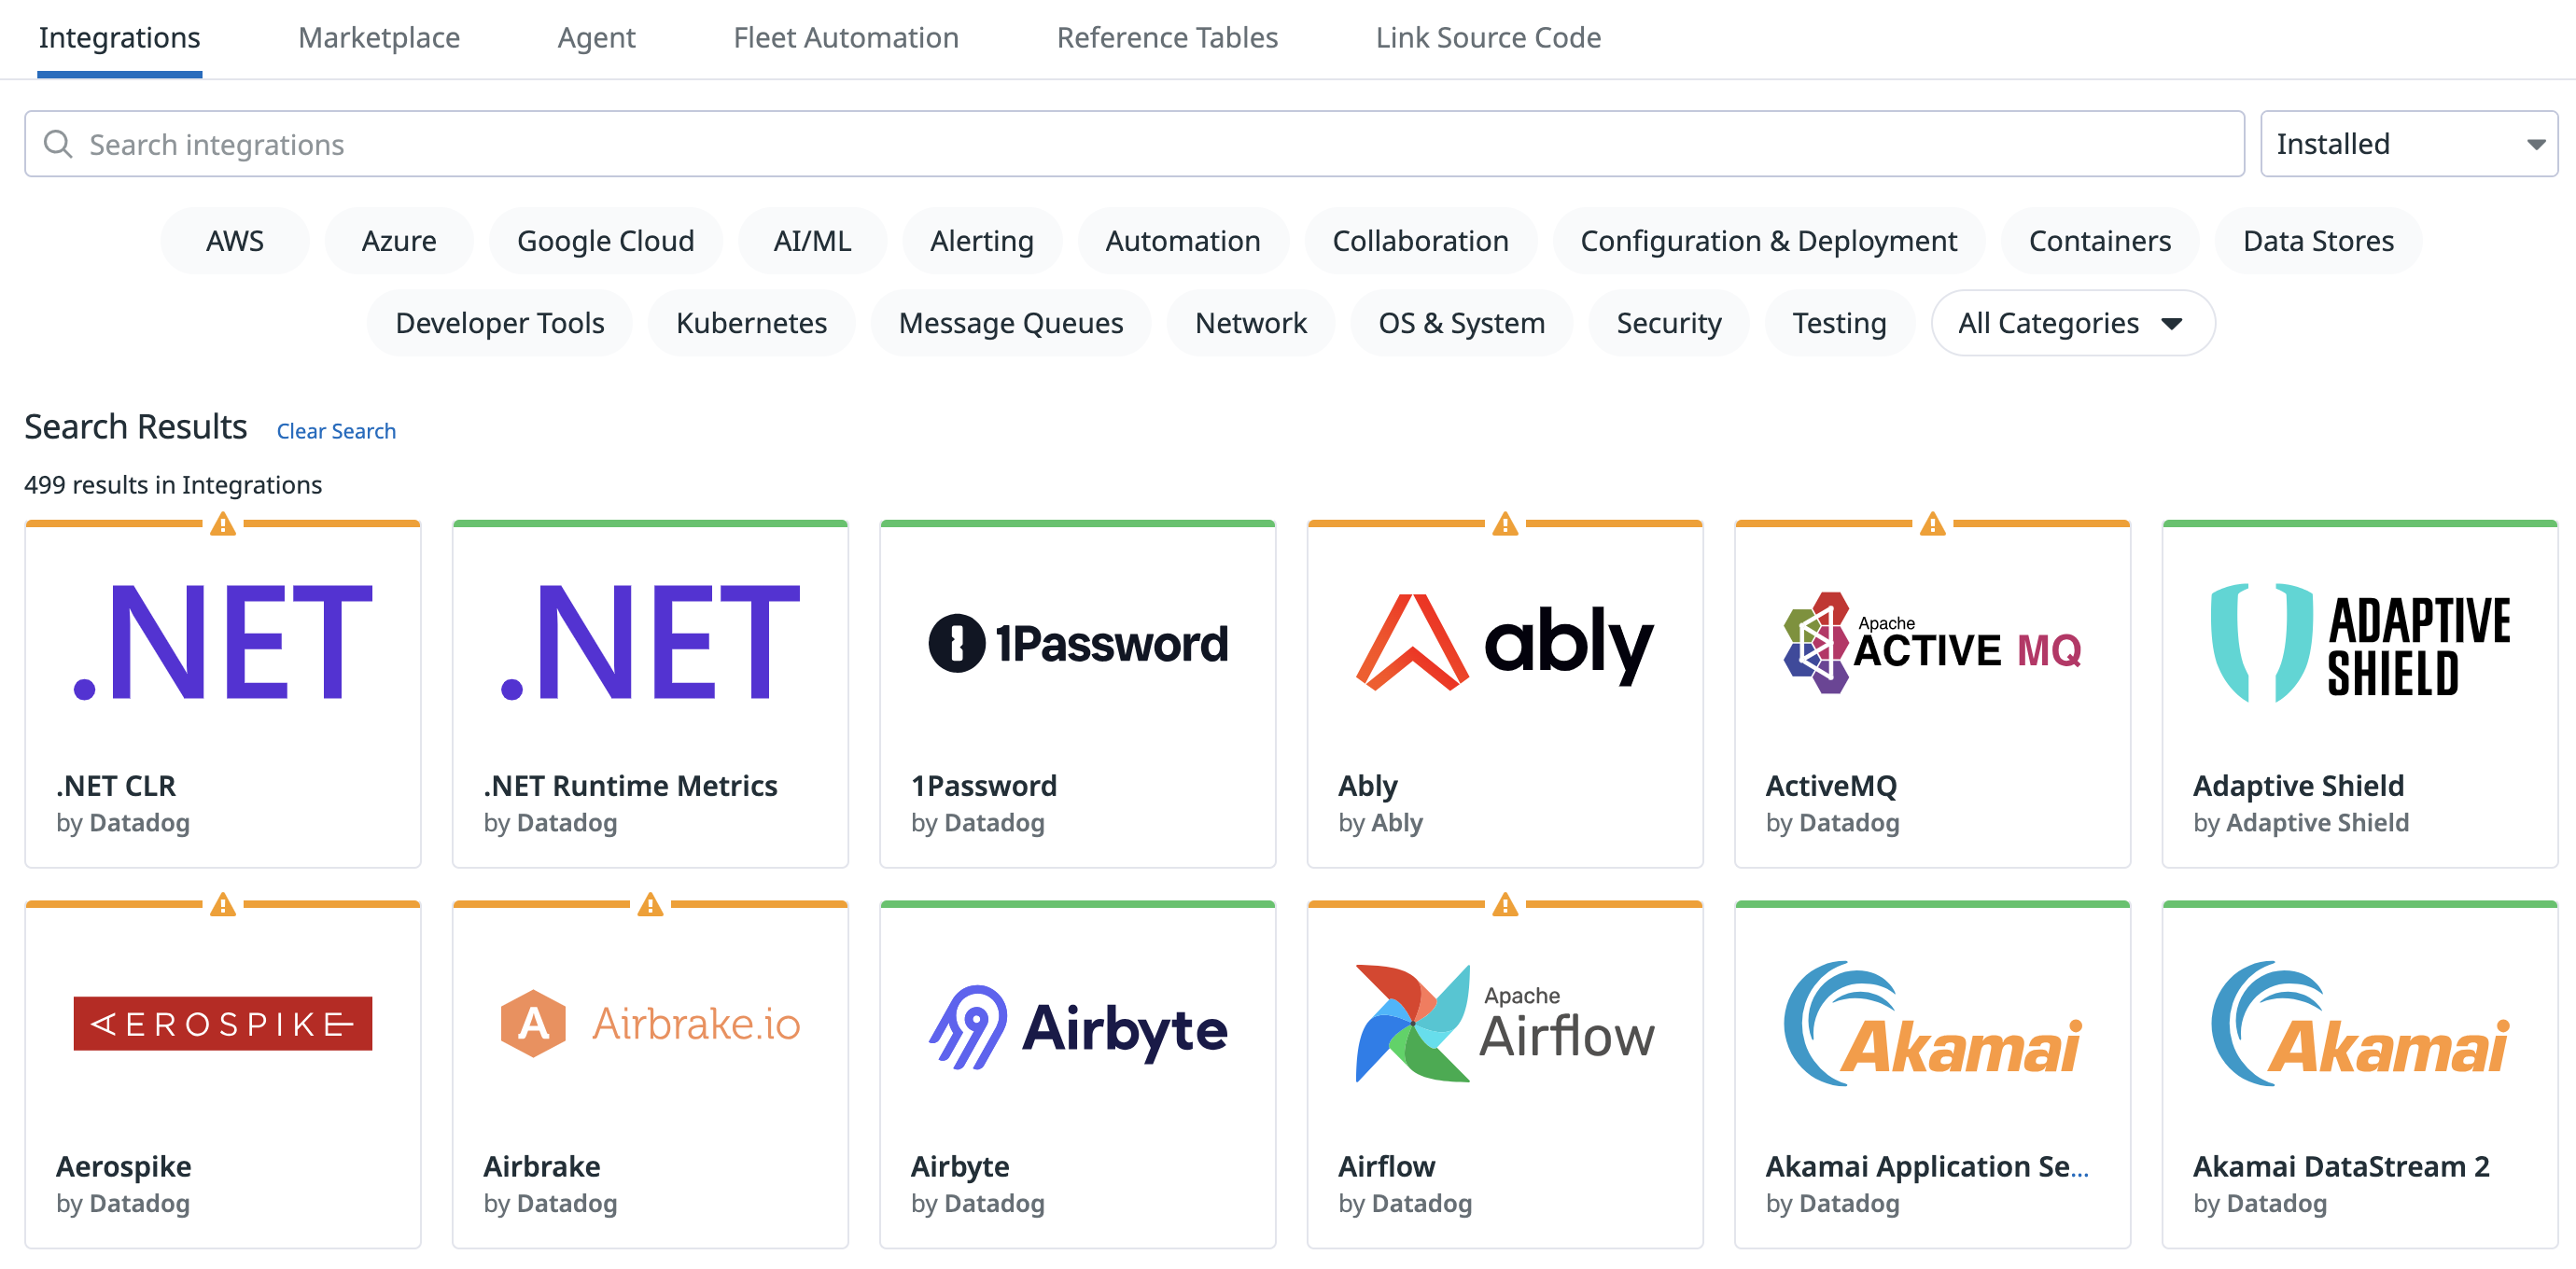
- Datadog has over 850 integrations officially listed.
- Custom integrations are available through the Datadog API.
- The Agent is open source.
- Once integrations have been configured, all data is treated the same throughout Datadog, whether it is living in a datacenter or in an online service.
Dashboards
Dashboards contain graphs with real-time performance metrics.
- Synchronous mousing across all graphs in a screenboard.
- Vertical bars are events. They put a metric into context.
- Click and drag on a graph to zoom in on a particular timeframe.
- As you hover over the graph, the event stream moves with you.
- Display by zone, host, or total usage.
- Datadog exposes a JSON editor for the graph, allowing for arithmetic and functions to be applied to metrics.
- Share a graph snapshot that appears in the stream.
- Graphs can be embedded in an iframe. This enables you to give a third party access to a live graph without also giving access to your data or any other information.
Monitors
Monitors provide alerts and notifications based on metric thresholds, integration availability, network endpoints, and more.
- Use any metric reporting to Datadog
- Set up multi alerts by device, host, and more
- Use
@in alert messages to direct notifications to the right people - Schedule downtimes to suppress notifications for system shutdowns, off-line maintenance, and more
Events
The Event Explorer displays the most recent events generated by your infrastructure and services.
Events can include the following:
- Code deployments
- Service health changes
- Configuration changes
- Monitoring alerts
The Event Explorer automatically gathers events collected by the Agent and installed integrations.
You can also submit your own custom events using the Datadog API, custom Agent checks, DogStatsD, or the Events email API.
In the Event Explorer, filter your events by facets or search queries. Group or filter events by attribute and graphically represent them with event analytics.
Infrastructure
- All machines show up in the infrastructure list.
- You can see the tags applied to each machine. Tagging allows you to indicate which machines have a particular purpose.
- Datadog attempts to automatically categorize your servers. If a new machine is tagged, you can immediately see the stats for that machine based on what was previously set up for that tag. Read more on tagging.
Host map
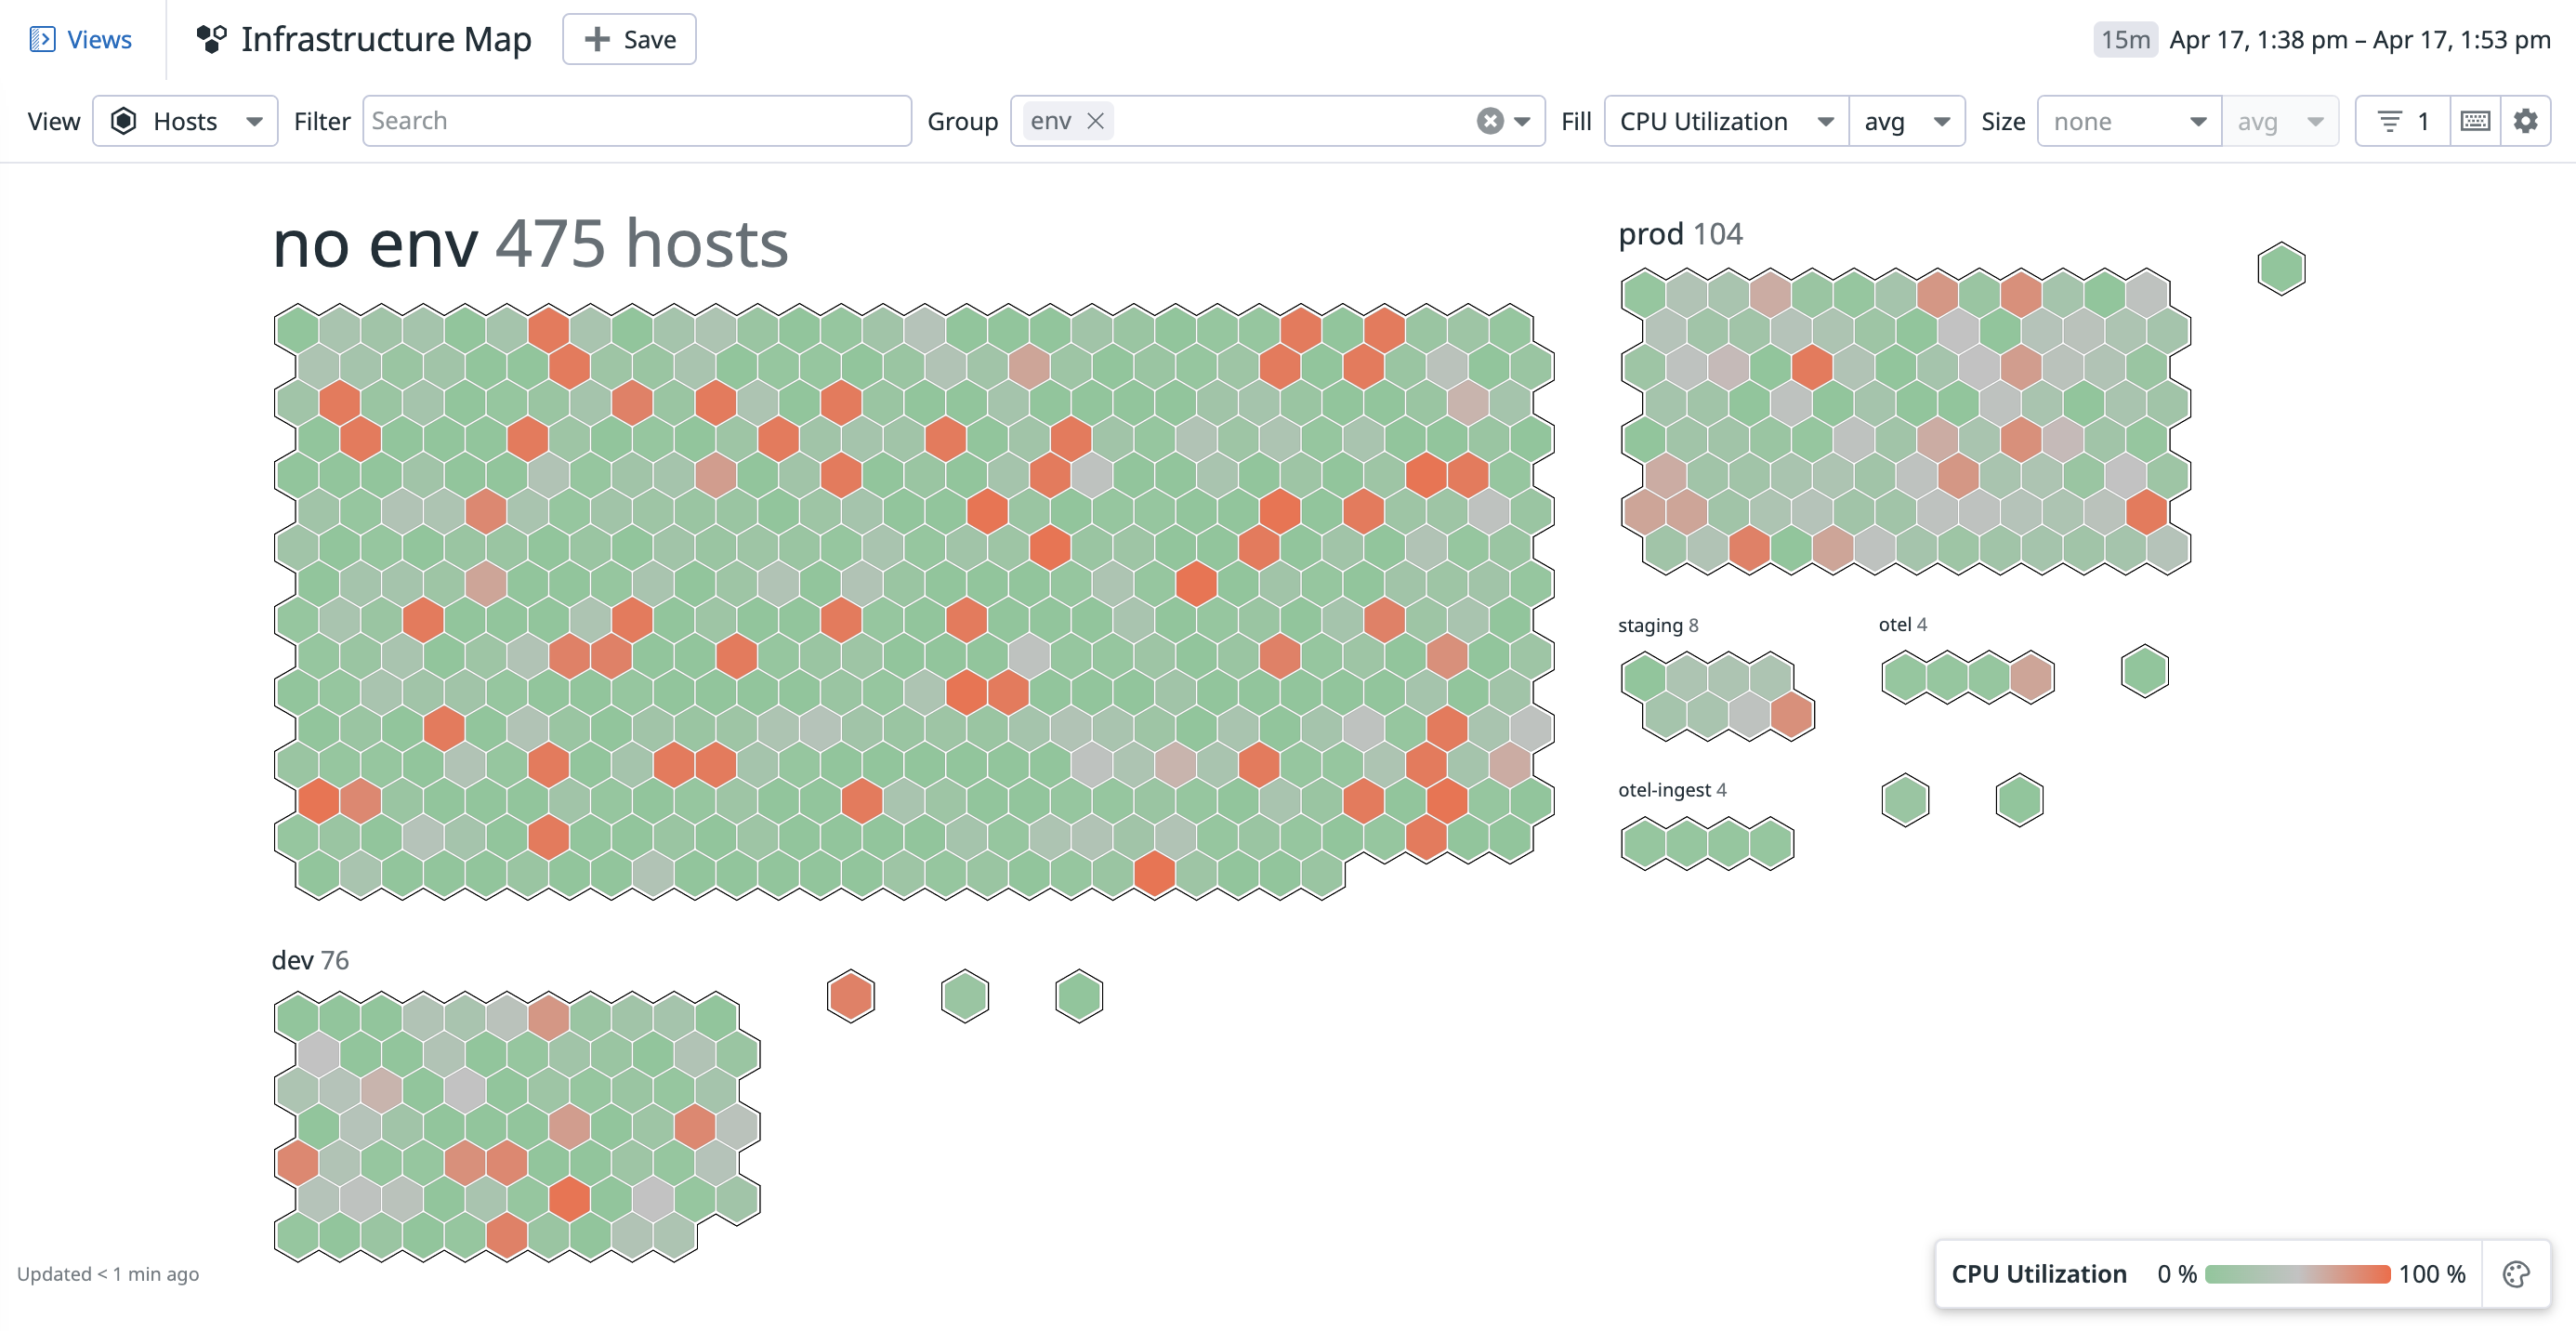
The host map can be found under the Infrastructure menu. It offers the ability to:
- Quickly visualize your environment
- Identify outliers
- Detect usage patterns
- Optimize resources
See Host Map for more details.
Serverless
Serverless lets you write event-driven code and upload it to a cloud provider, which manages all of the underlying compute resources. Datadog Serverless brings together metrics, traces, and logs from your AWS Lambda functions running serverless applications into one view, so that you can optimize performance by filtering to functions that are generating errors, high latency, or cold starts.
APM & Continuous Profiler
Datadog Application Performance Monitoring (APM or tracing) provides you with deep insight into your application’s performance—from automatically generated dashboards for monitoring key metrics, like request volume and latency, to detailed traces of individual requests—side by side with your logs and infrastructure monitoring. When a request is made to an application, Datadog can see the traces across a distributed system, and show you systematic data about precisely what is happening to this request.
Cloud Network Monitoring
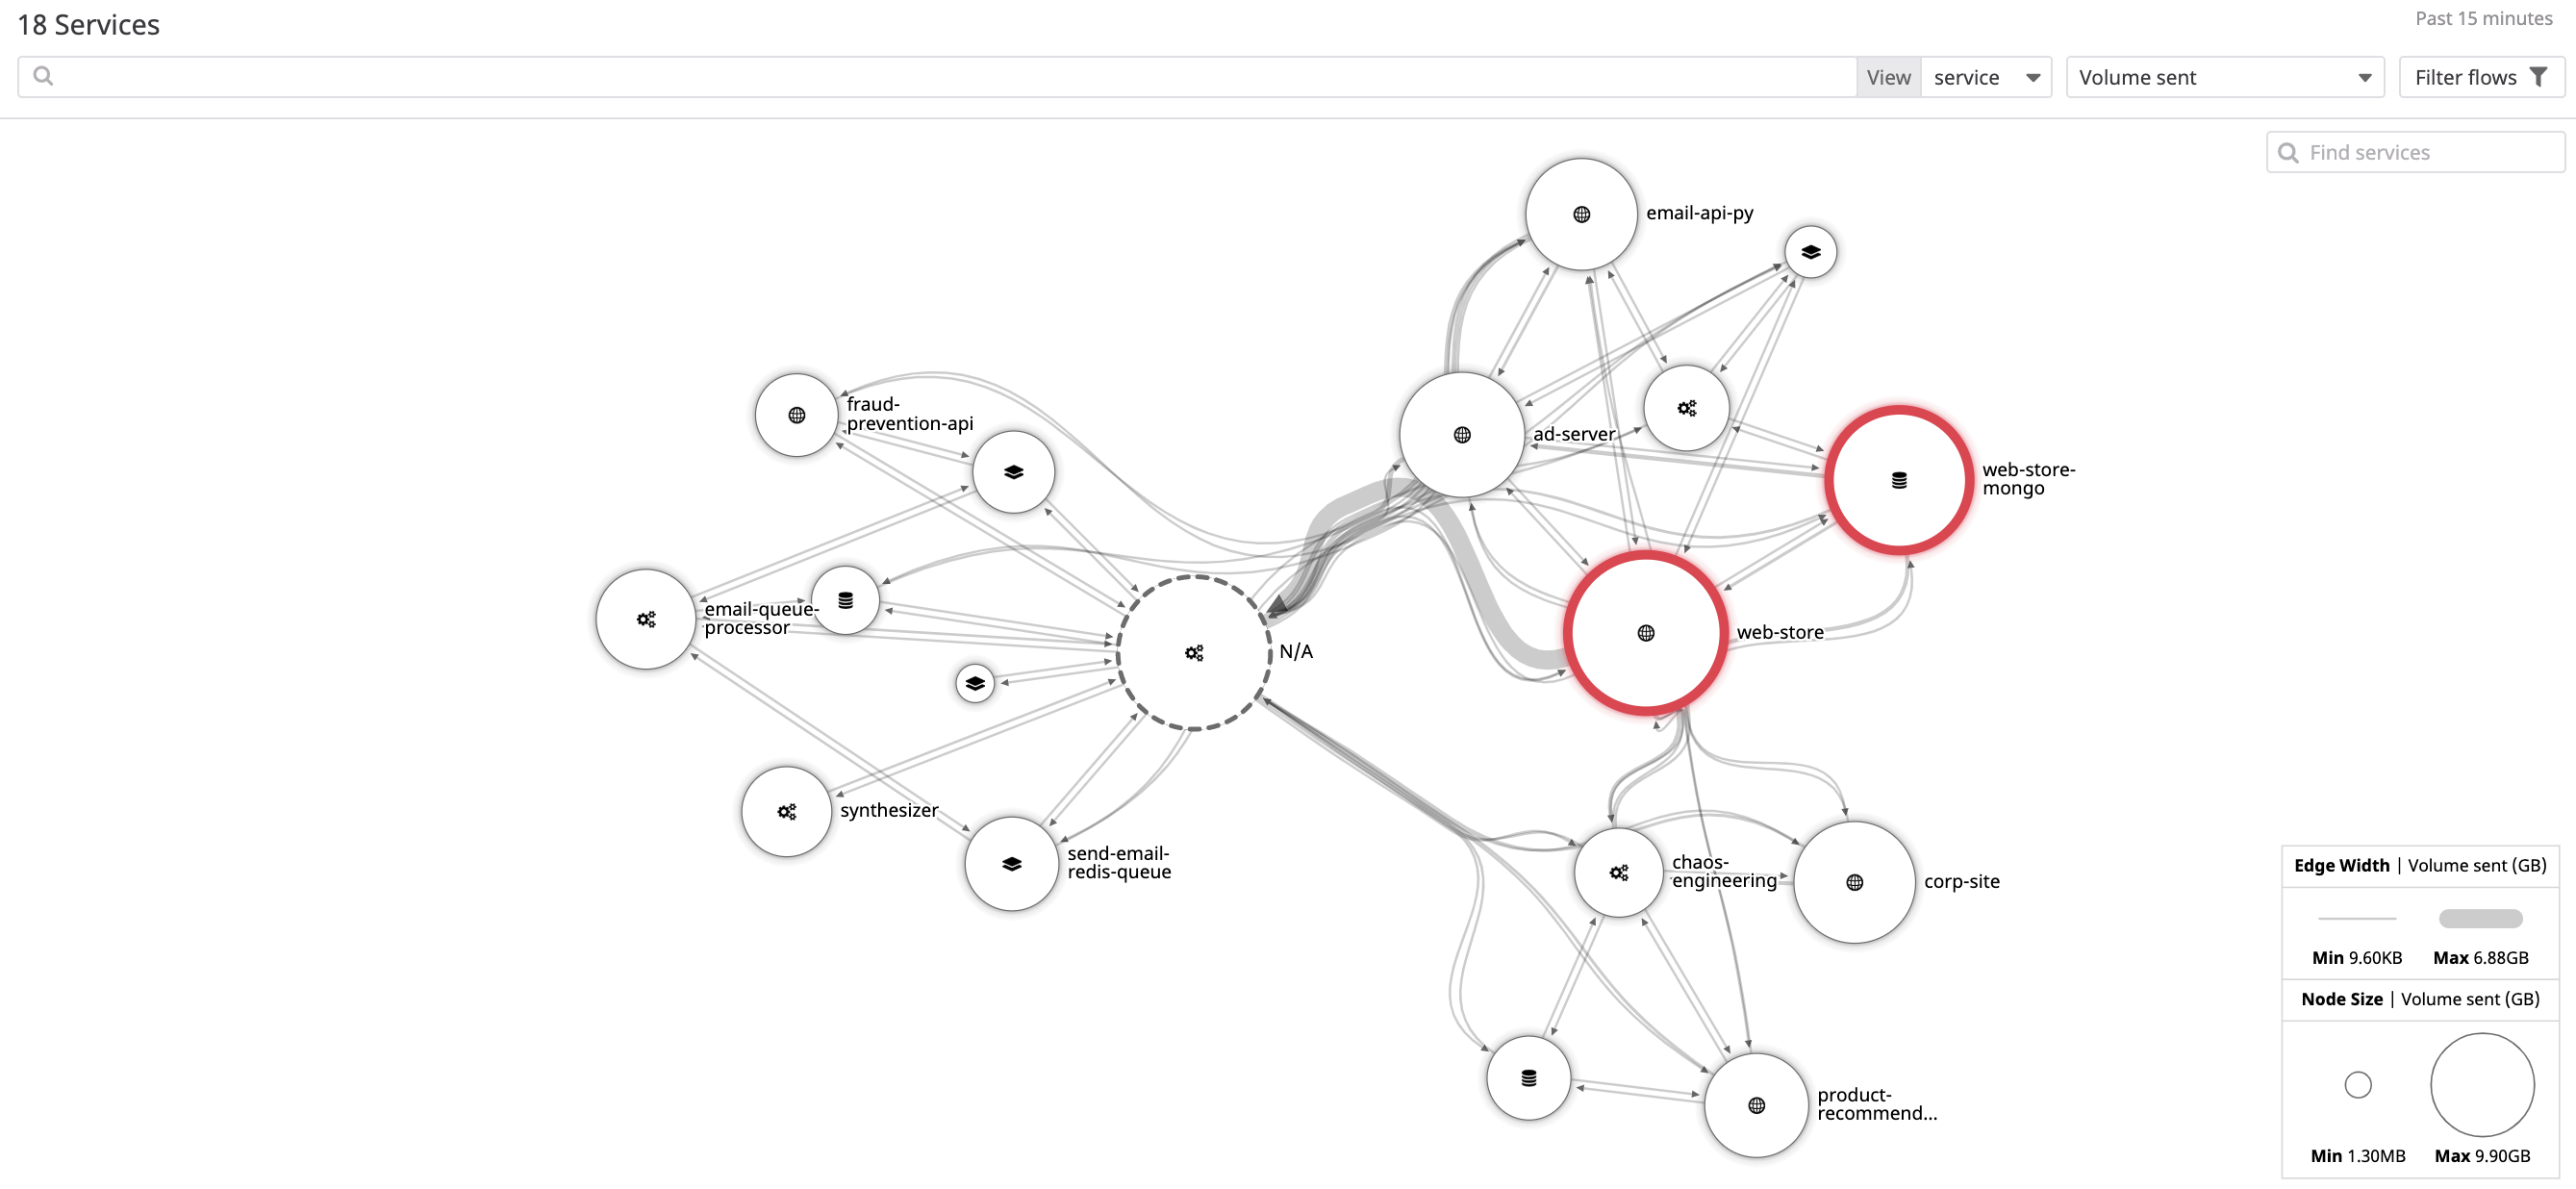
Datadog Cloud Network Monitoring (NPM) gives you visibility into your network traffic across any tagged object in Datadog: from containers to hosts, services, and availability zones. Group by anything—from datacenters to teams to individual containers. Use tags to filter traffic by source and destination. The filters then aggregate into flows, each showing traffic between one source and one destination, through a customizable network page and network map. Each flow contains network metrics such as throughput, bandwidth, retransmit count, and source/destination information down to the IP, port, and PID levels. It then reports key metrics such as traffic volume and TCP retransmits.
Synthetic Monitoring
Datadog Synthetic Monitoring allow you to create and run API and browser tests that proactively simulate user transactions on your applications and monitor all internal and external network endpoints across your system’s layers. You can detect errors, identify regressions, and automate rollbacks to prevent issues from surfacing in production.
RUM & Session Replay
Datadog Real User Monitoring (RUM) allows you to visualize and analyze real-time user activities and experiences. With Session Replay, you can capture and view the web browsing sessions of your users to better understand their behavior. In the RUM Explorer, you can not only visualize load times, frontend errors, and page dependencies, but also you can correlate business and application metrics to troubleshoot issues with application, infrastructure, and business metrics in one dashboard.
Cloud SIEM
Datadog Cloud SIEM (Security Information and Event Management) automatically detects threats to your application or infrastructure. For example, a targeted attack, an IP communicating with your systems matching a threat intel list, or an insecure configuration. These threats are surfaced in Datadog as Security Signals and can be correlated and triaged in the Security Explorer.
Log Management
Datadog Log Management lets you send and process every log produced by your applications and infrastructure. You can observe your logs in real-time using the Live Tail, without indexing them. You can ingest all of the logs from your applications and infrastructure, decide what to index dynamically with filters, and then store them in an archive.
Datadog on Mobile
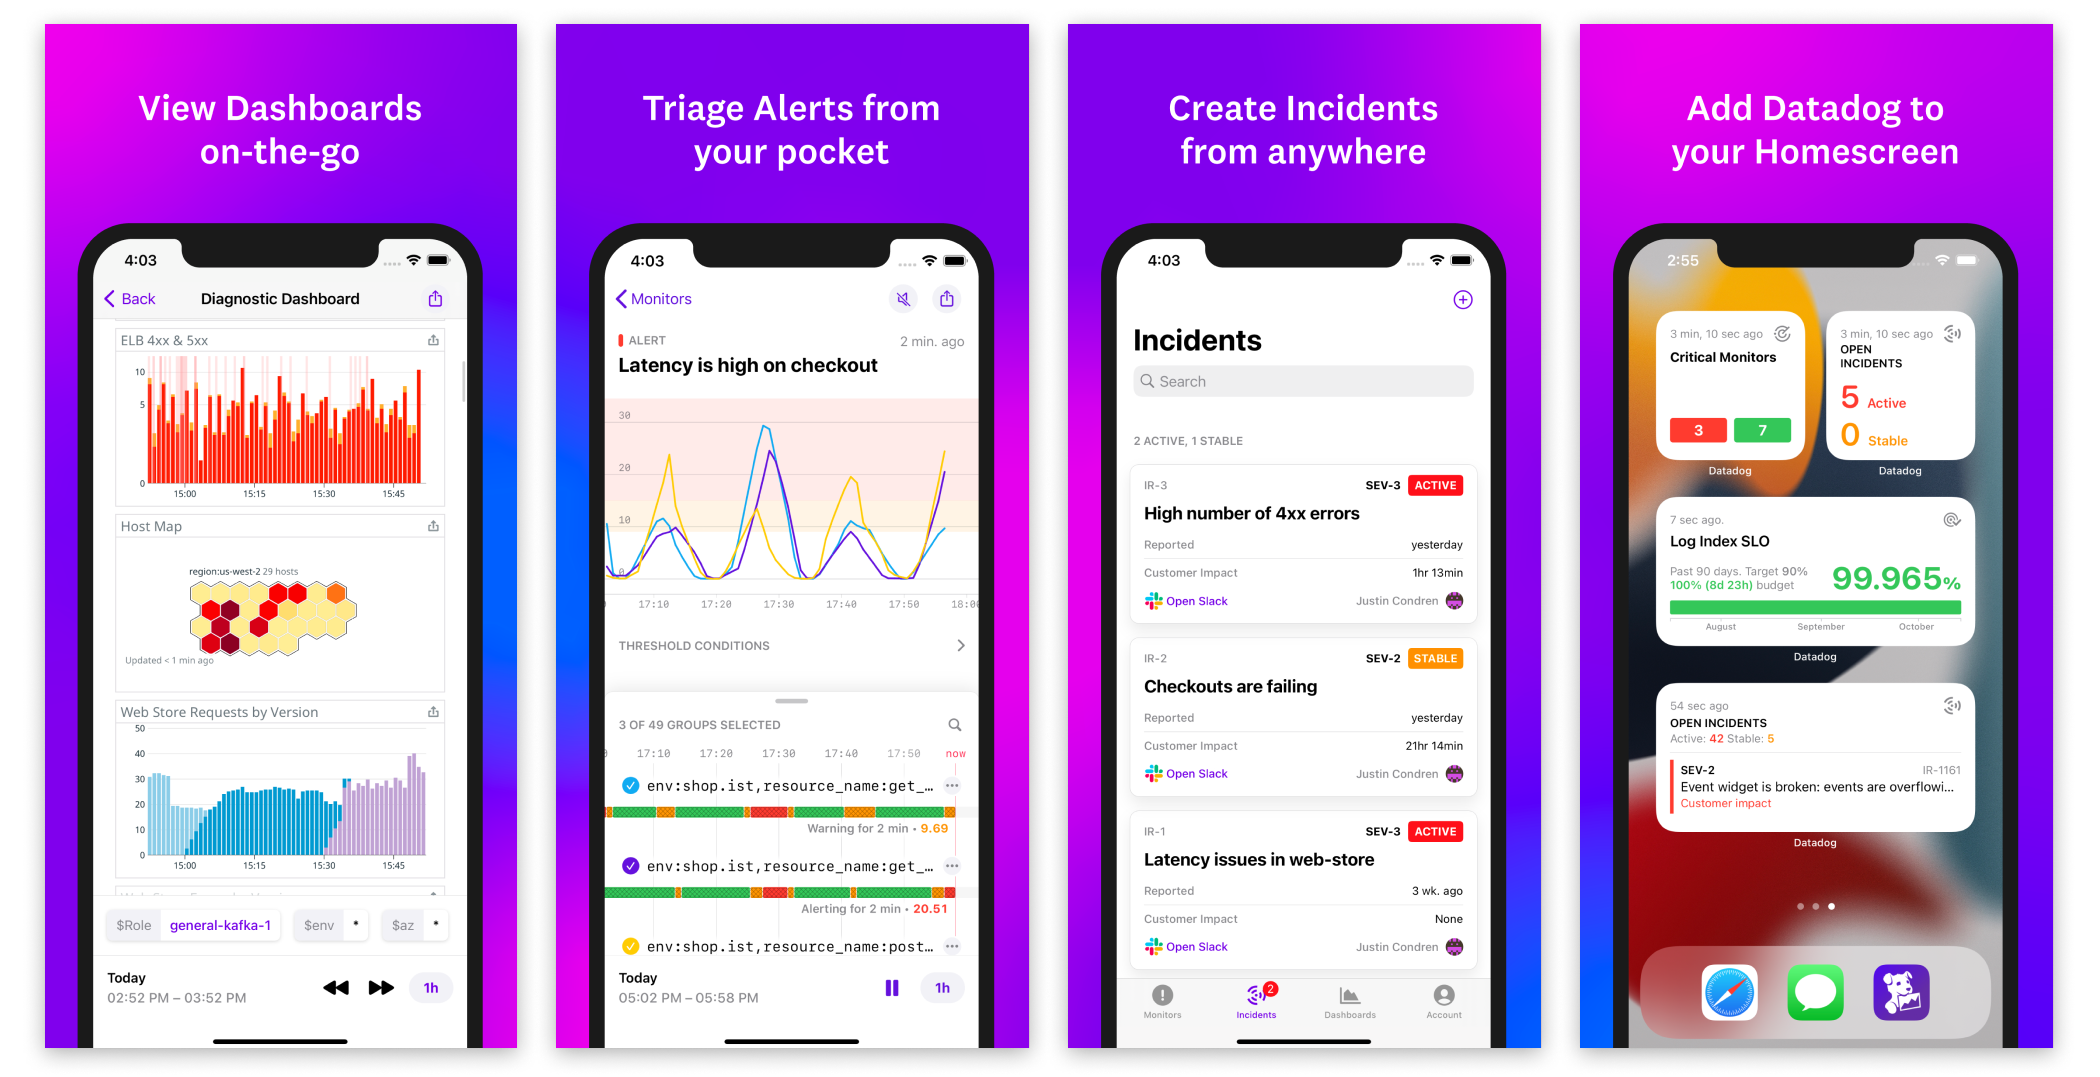
The Datadog Mobile App, available on the Apple App Store and Google Play Store, gives key data for on-call engineers and business users to follow their service health and triage issues quickly without opening their laptop. Access your organization’s Dashboards, Monitors, Incidents, SLOs and more directly from your mobile device.
Further Reading
Additional helpful documentation, links, and articles:


