Cette page n'est pas encore disponible en français, sa traduction est en cours. Si vous avez des questions ou des retours sur notre projet de traduction actuel, n'hésitez pas à nous contacter.
Overview
This tutorial walks you through the steps for enabling tracing on a sample Python application installed on a host. In this scenario, you install a Datadog Agent on the same host as the application.
For other scenarios, including applications in containers, Agent in a container, and applications written in different languages, see the other Enabling Tracing tutorials.
If you haven’t installed a Datadog Agent on your machine, go to Integrations > Agent and select your operating system. For example, on most Linux platforms, you can install the Agent by running the following script, replacing <YOUR_API_KEY> with your Datadog API key:
To send data to a Datadog site other than datadoghq.com, replace the DD_SITE environment variable with your Datadog site.
If you have an Agent already installed on the host, ensure it is at least version 7.28. The minimum version of Datadog Agent required to use ddtrace to trace Python applications is documented in the tracing library developer docs.
Verify that the Agent is running and sending data to Datadog by going to Events > Explorer, optionally filtering by the Datadog Source facet, and looking for an event that confirms the Agent installation on the host:
If after a few minutes you don't see your host in Datadog (under Infrastructure > Host map), ensure you used the correct API key for your organization, available at Organization Settings > API Keys.
Install and run a sample Python application
Next, install a sample application to trace. The code sample for this tutorial can be found at github.com/Datadog/apm-tutorial-python. Clone the git repository by running:
The sample notes_app application is a basic REST API that stores data in an in-memory database. Open another terminal and use curl to send a few API requests:
curl -X GET 'localhost:8080/notes'
Returns {} because there is nothing in the database yet
curl -X POST 'localhost:8080/notes?desc=hello'
Adds a note with the description hello and an ID value of 1. Returns ( 1, hello).
curl -X GET 'localhost:8080/notes?id=1'
Returns the note with id value of 1: ( 1, hello)
curl -X POST 'localhost:8080/notes?desc=otherNote'
Adds a note with the description otherNote and an ID value of 2. Returns ( 2, otherNote)
curl -X GET 'localhost:8080/notes'
Returns the contents of the database: { "1": "hello", "2": "otherNote" }
curl -X PUT 'localhost:8080/notes?id=1&desc=UpdatedNote'
Updates the description value for the first note to UpdatedNote.
curl -X DELETE 'localhost:8080/notes?id=1'
Removes the first note from the database.
Run more API calls to see the application in action. When you’re done, type Ctrl+C to stop the application.
Install Datadog tracing
Next, install the tracing library by using Poetry or pip (minimum version 18). From your apm-tutorial-python directory, run:
poetry add ddtrace
poetry install
pip install ddtrace
Launch the Python application with automatic instrumentation
To start generating and collecting traces, restart the sample application in a slightly different way than previously. Run:
DD_SERVICE=notes DD_ENV=dev DD_VERSION=0.1.0 \
 poetry run ddtrace-run python -m notes_app.app
That command sets the DD_SERVICE, DD_VERSION, and DD_ENV environment variables to enable Unified Service Tagging, enabling data correlation across Datadog.
Use curl to again send requests to the application:
curl -X GET 'localhost:8080/notes'
{}
curl -X POST 'localhost:8080/notes?desc=hello'
( 1, hello)
curl -X GET 'localhost:8080/notes?id=1'
( 1, hello)
curl -X POST 'localhost:8080/notes?desc=newNote'
( 2, newNote)
curl -X GET 'localhost:8080/notes'
{ "1": "hello", "2": "newNote" }
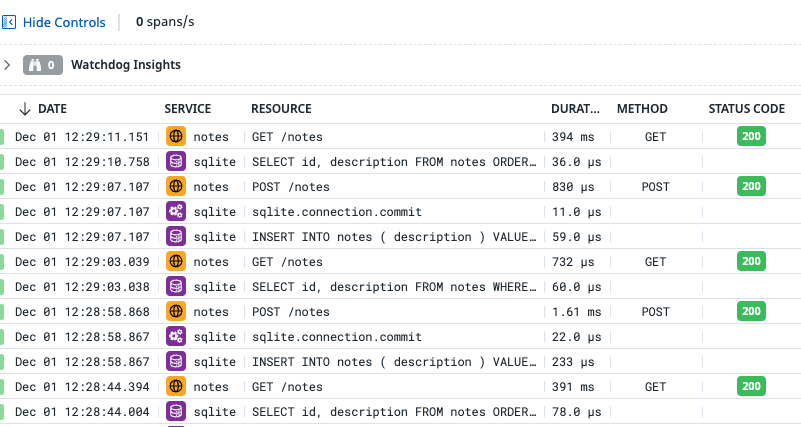
Wait a few moments, and take a look at your Datadog UI. Navigate to APM > Traces). The Traces list shows something like this:
If you don’t see traces, clear any filter in the Traces Search field (sometimes it filters on an environment variable such as ENV that you aren’t using).
Examine a trace
In the Traces page, click on a POST /notes trace and you’ll see a flame graph that shows how long each span took and what other spans occurred before a span completed. The bar at the top of the graph is the span you selected on the previous screen (in this case, the initial entry point into the notes application).
The width of a bar indicates how long it took to complete. A bar at a lower depth represents a span that completes during the lifetime of a bar at a higher depth.
The flame graph for a POST trace looks something like this:
A GET /notes trace looks something like this:
Add custom instrumentation to the Python application
Automatic instrumentation is convenient, but sometimes you want more fine-grained spans. Datadog’s Python DD Trace API allows you to specify spans within your code using annotations or code.
The following steps walk you through adding annotations to the code to trace some sample methods.
Open notes_app/notes_helper.py.
Add the following import:
fromddtraceimporttracer
Inside the NotesHelper class, add a tracer wrapper called notes_helper to better see how the notes_helper.long_running_process method works:
classNotesHelper:@tracer.wrap(service="notes_helper")deflong_running_process(self):time.sleep(.3)logging.info("Hello from the long running process")self.__private_method_1()
Now, the tracer automatically labels the resource with the function name it is wrapped around, in this case, long_running_process.
Resend some HTTP requests, specifically some GET requests.
On the Trace Explorer, click on one of the new GET requests, and see a flame graph like this:
Note the higher level of detail in the stack trace now that the get_notes function has custom tracing.
Add a second application to see distributed traces
Tracing a single application is a great start, but the real value in tracing is seeing how requests flow through your services. This is called distributed tracing.
The sample project includes a second application called calendar_app that returns a random date whenever it is invoked. The POST endpoint in the Notes application has a second query parameter named add_date. When it is set to y, Notes calls the calendar application to get a date to add to the note.
Start the calendar application by running:
DD_SERVICE=notes DD_ENV=dev DD_VERSION=0.1.0 \
poetry run ddtrace-run python -m calendar_app.app
defcreate_note(self,desc,add_date=None):if(add_date):if(add_date.lower()=="y"):try:withtracer.trace(name="notes_helper",service="notes_helper",resource="another_process")asspan:self.nh.another_process()note_date=requests.get(f"http://localhost:9090/calendar")note_date=note_date.textdesc=desc+" with date "+note_dateprint(desc)exceptExceptionase:print(e)raiseIOError("Cannot reach calendar service.")note=Note(description=desc,id=None)note.id=self.db.create_note(note)
Send more HTTP requests, specifically POST requests, with the add_date argument.
In the Trace Explorer, click into one of these new POST traces to see a custom trace across multiple services:
Note the new span labeled notes_helper.another_process.
If you’re not receiving traces as expected, set up debug mode in the ddtrace Python package. Read Enable debug mode to find out more.
Further reading
Documentation, liens et articles supplémentaires utiles: