- Principales informations
- Getting Started
- Agent
- API
- Tracing
- Conteneurs
- Dashboards
- Database Monitoring
- Datadog
- Site Datadog
- DevSecOps
- Incident Management
- Intégrations
- Internal Developer Portal
- Logs
- Monitors
- OpenTelemetry
- Profileur
- Session Replay
- Security
- Serverless for AWS Lambda
- Software Delivery
- Surveillance Synthetic
- Tags
- Workflow Automation
- Learning Center
- Support
- Glossary
- Standard Attributes
- Guides
- Agent
- Intégrations
- Développeurs
- OpenTelemetry
- Administrator's Guide
- API
- Partners
- Application mobile
- DDSQL Reference
- CoScreen
- CoTerm
- Remote Configuration
- Cloudcraft
- In The App
- Dashboards
- Notebooks
- DDSQL Editor
- Reference Tables
- Sheets
- Alertes
- Watchdog
- Métriques
- Bits AI
- Internal Developer Portal
- Error Tracking
- Change Tracking
- Service Management
- Actions & Remediations
- Infrastructure
- Cloudcraft
- Resource Catalog
- Universal Service Monitoring
- Hosts
- Conteneurs
- Processes
- Sans serveur
- Surveillance réseau
- Cloud Cost
- Application Performance
- APM
- Termes et concepts de l'APM
- Sending Traces to Datadog
- APM Metrics Collection
- Trace Pipeline Configuration
- Connect Traces with Other Telemetry
- Trace Explorer
- Recommendations
- Code Origin for Spans
- Observabilité des services
- Endpoint Observability
- Dynamic Instrumentation
- Live Debugger
- Suivi des erreurs
- Sécurité des données
- Guides
- Dépannage
- Profileur en continu
- Database Monitoring
- Agent Integration Overhead
- Setup Architectures
- Configuration de Postgres
- Configuration de MySQL
- Configuration de SQL Server
- Setting Up Oracle
- Setting Up Amazon DocumentDB
- Setting Up MongoDB
- Connecting DBM and Traces
- Données collectées
- Exploring Database Hosts
- Explorer les métriques de requête
- Explorer des échantillons de requêtes
- Exploring Database Schemas
- Exploring Recommendations
- Dépannage
- Guides
- Data Streams Monitoring
- Data Jobs Monitoring
- Data Observability
- Digital Experience
- RUM et Session Replay
- Surveillance Synthetic
- Continuous Testing
- Product Analytics
- Software Delivery
- CI Visibility
- CD Visibility
- Deployment Gates
- Test Visibility
- Code Coverage
- Quality Gates
- DORA Metrics
- Feature Flags
- Securité
- Security Overview
- Cloud SIEM
- Code Security
- Cloud Security Management
- Application Security Management
- Workload Protection
- Sensitive Data Scanner
- AI Observability
- Log Management
- Pipelines d'observabilité
- Log Management
- CloudPrem
- Administration
Test Impact Analysis
Ce produit n'est pas pris en charge par le site Datadog que vous avez sélectionné. ().
Cette page n'est pas encore disponible en français, sa traduction est en cours.
Si vous avez des questions ou des retours sur notre projet de traduction actuel, n'hésitez pas à nous contacter.
Si vous avez des questions ou des retours sur notre projet de traduction actuel, n'hésitez pas à nous contacter.
This feature was formerly known as Intelligent Test Runner, and some tags still contain "itr".
Overview
Test Impact Analysis automatically selects and runs only the relevant tests for a given commit based on the code being changed. Significantly reduce time spent testing and overall CI costs, while maintaining test coverage.
Test Impact Analysis works by analyzing your test suite to identify the code each test covers. It then cross-references that coverage with the files impacted by a new code change. Datadog uses this information to run a selection of relevant, impacted tests, omitting the ones unaffected by the code change and reducing the overall testing duration. Find out more details about How It Works.
By minimizing the number of tests run per commit, Test Impact Analysis reduces the frequency of flaky tests disrupting your pipelines. This can be particularly frustrating when the test flaking is unrelated to the code change being tested. After enabling Test Impact Analysis for your test services, you can limit each commit to its relevant tests to ensure that flaky tests unrelated to your code change don’t end up arbitrarily breaking your build.
Out-of-the-box configuration limitations
With the default configuration, there are known situations that can cause Test Impact Analysis to skip tests that should have been run. Specifically, Test Impact Analysis is not able to automatically detect changes in:
- Library dependencies
- Compiler options
- External services
- Changes to data files in data-driven tests
In these scenarios, Test Impact Analysis might skip impacted tests with the out-of-the-box configuration.
There are several configuration mechanisms that you can use in these scenarios to ensure that no tests are skipped:
- You can mark certain files in your repository as tracked files, which causes all tests to run whenever these files are changed. Dockerfiles, Makefiles, dependency files, and other build configuration files are good candidates for tracked files.
- You can mark certain tests in your source as unskippable to ensure they are always run. This is a good fit for data-driven tests or tests that interact with external systems. More information in the setup page.
- If you are authoring a risky commit and you’d like to run all tests, add
ITR:NoSkip(case insensitive) anywhere in your Git commit message. - If GitHub is your source code management provider, use the
ITR:NoSkiplabel (case insensitive) to prevent Test Impact Analysis from skipping tests in pull requests. To use this feature, configure the GitHub App using the GitHub integration tile with theSoftware Delivery: Collect Pull Request Informationfeature enabled. This mechanism does not work with tests executed on GitHub actions triggered bypull_requestevents. - You can add a list of excluded branches, which disables Test Impact Analysis in those branches.
Set up a Datadog library
Before setting up Test Impact Analysis, you must configure Test Optimization for your particular language. If you are reporting data through the Agent, use v6.40 or 7.40 and later.
Choose a language to set up Test Impact Analysis in Datadog:
Configuration
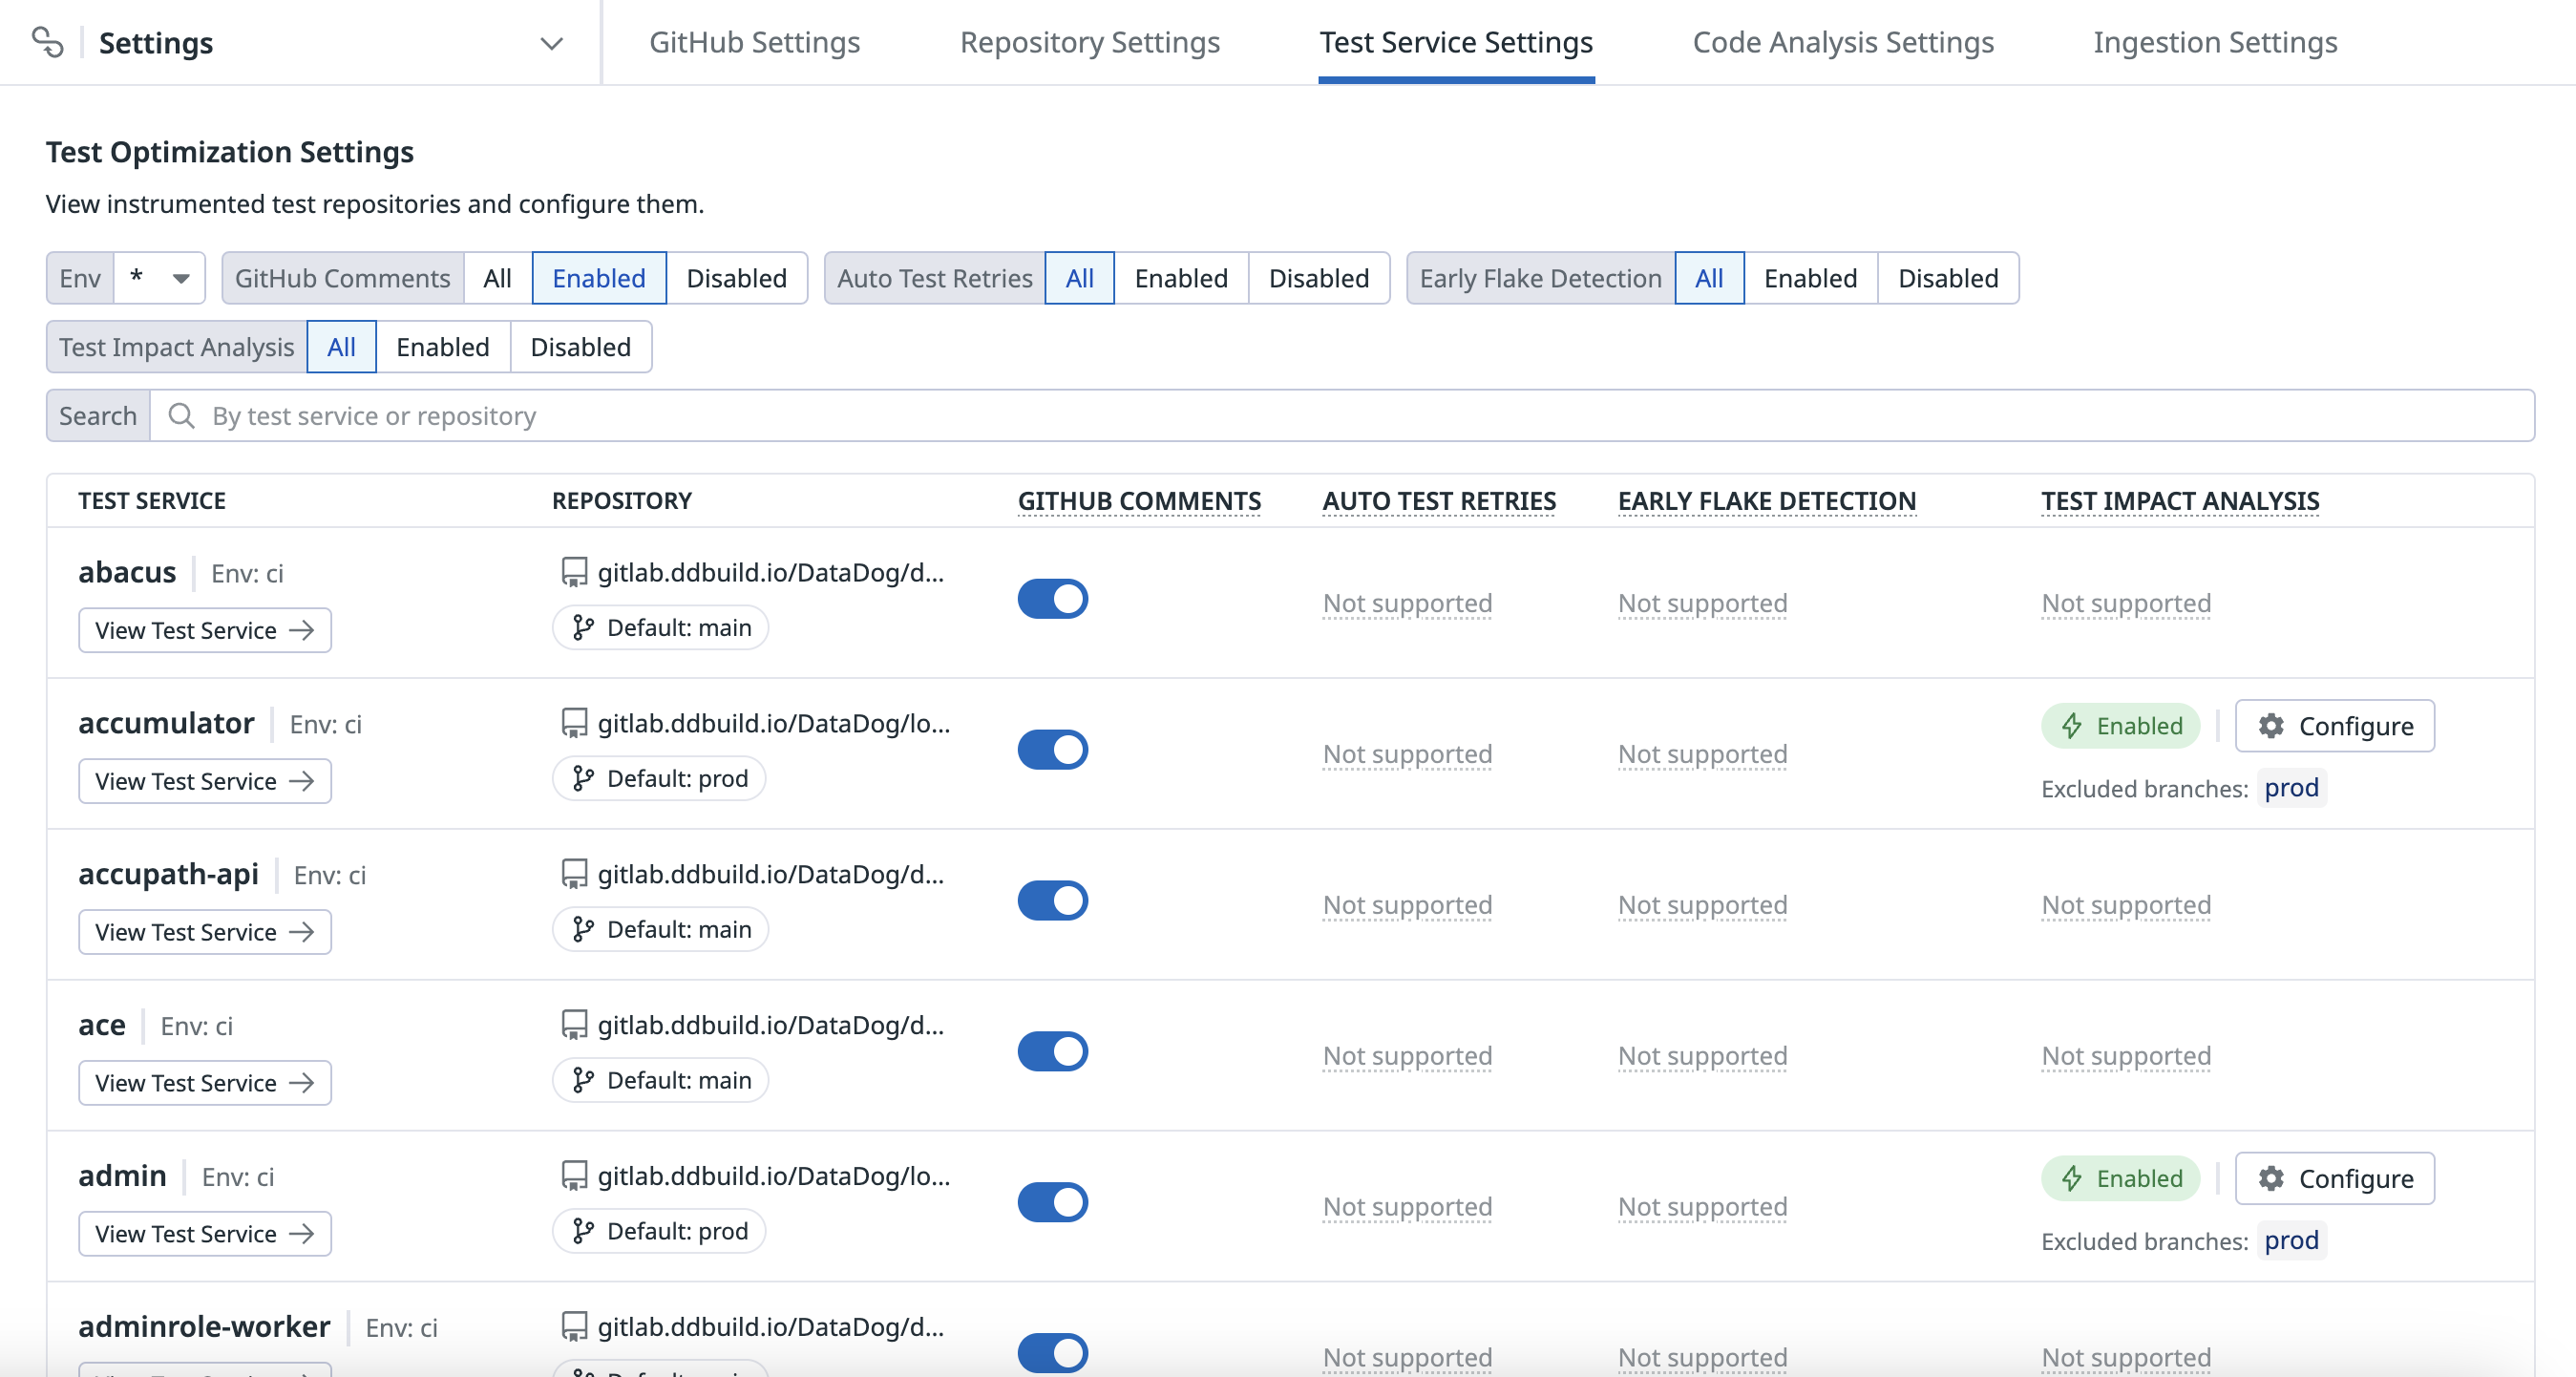
Once you have set up your Datadog library for Test Impact Analysis, configure it from the Test Service Settings page. Enabling Test Impact Analysis requires the Test Optimization Settings Write permission.
Git executable
For Test Impact Analysis to work, Git needs to be available in the host running tests.
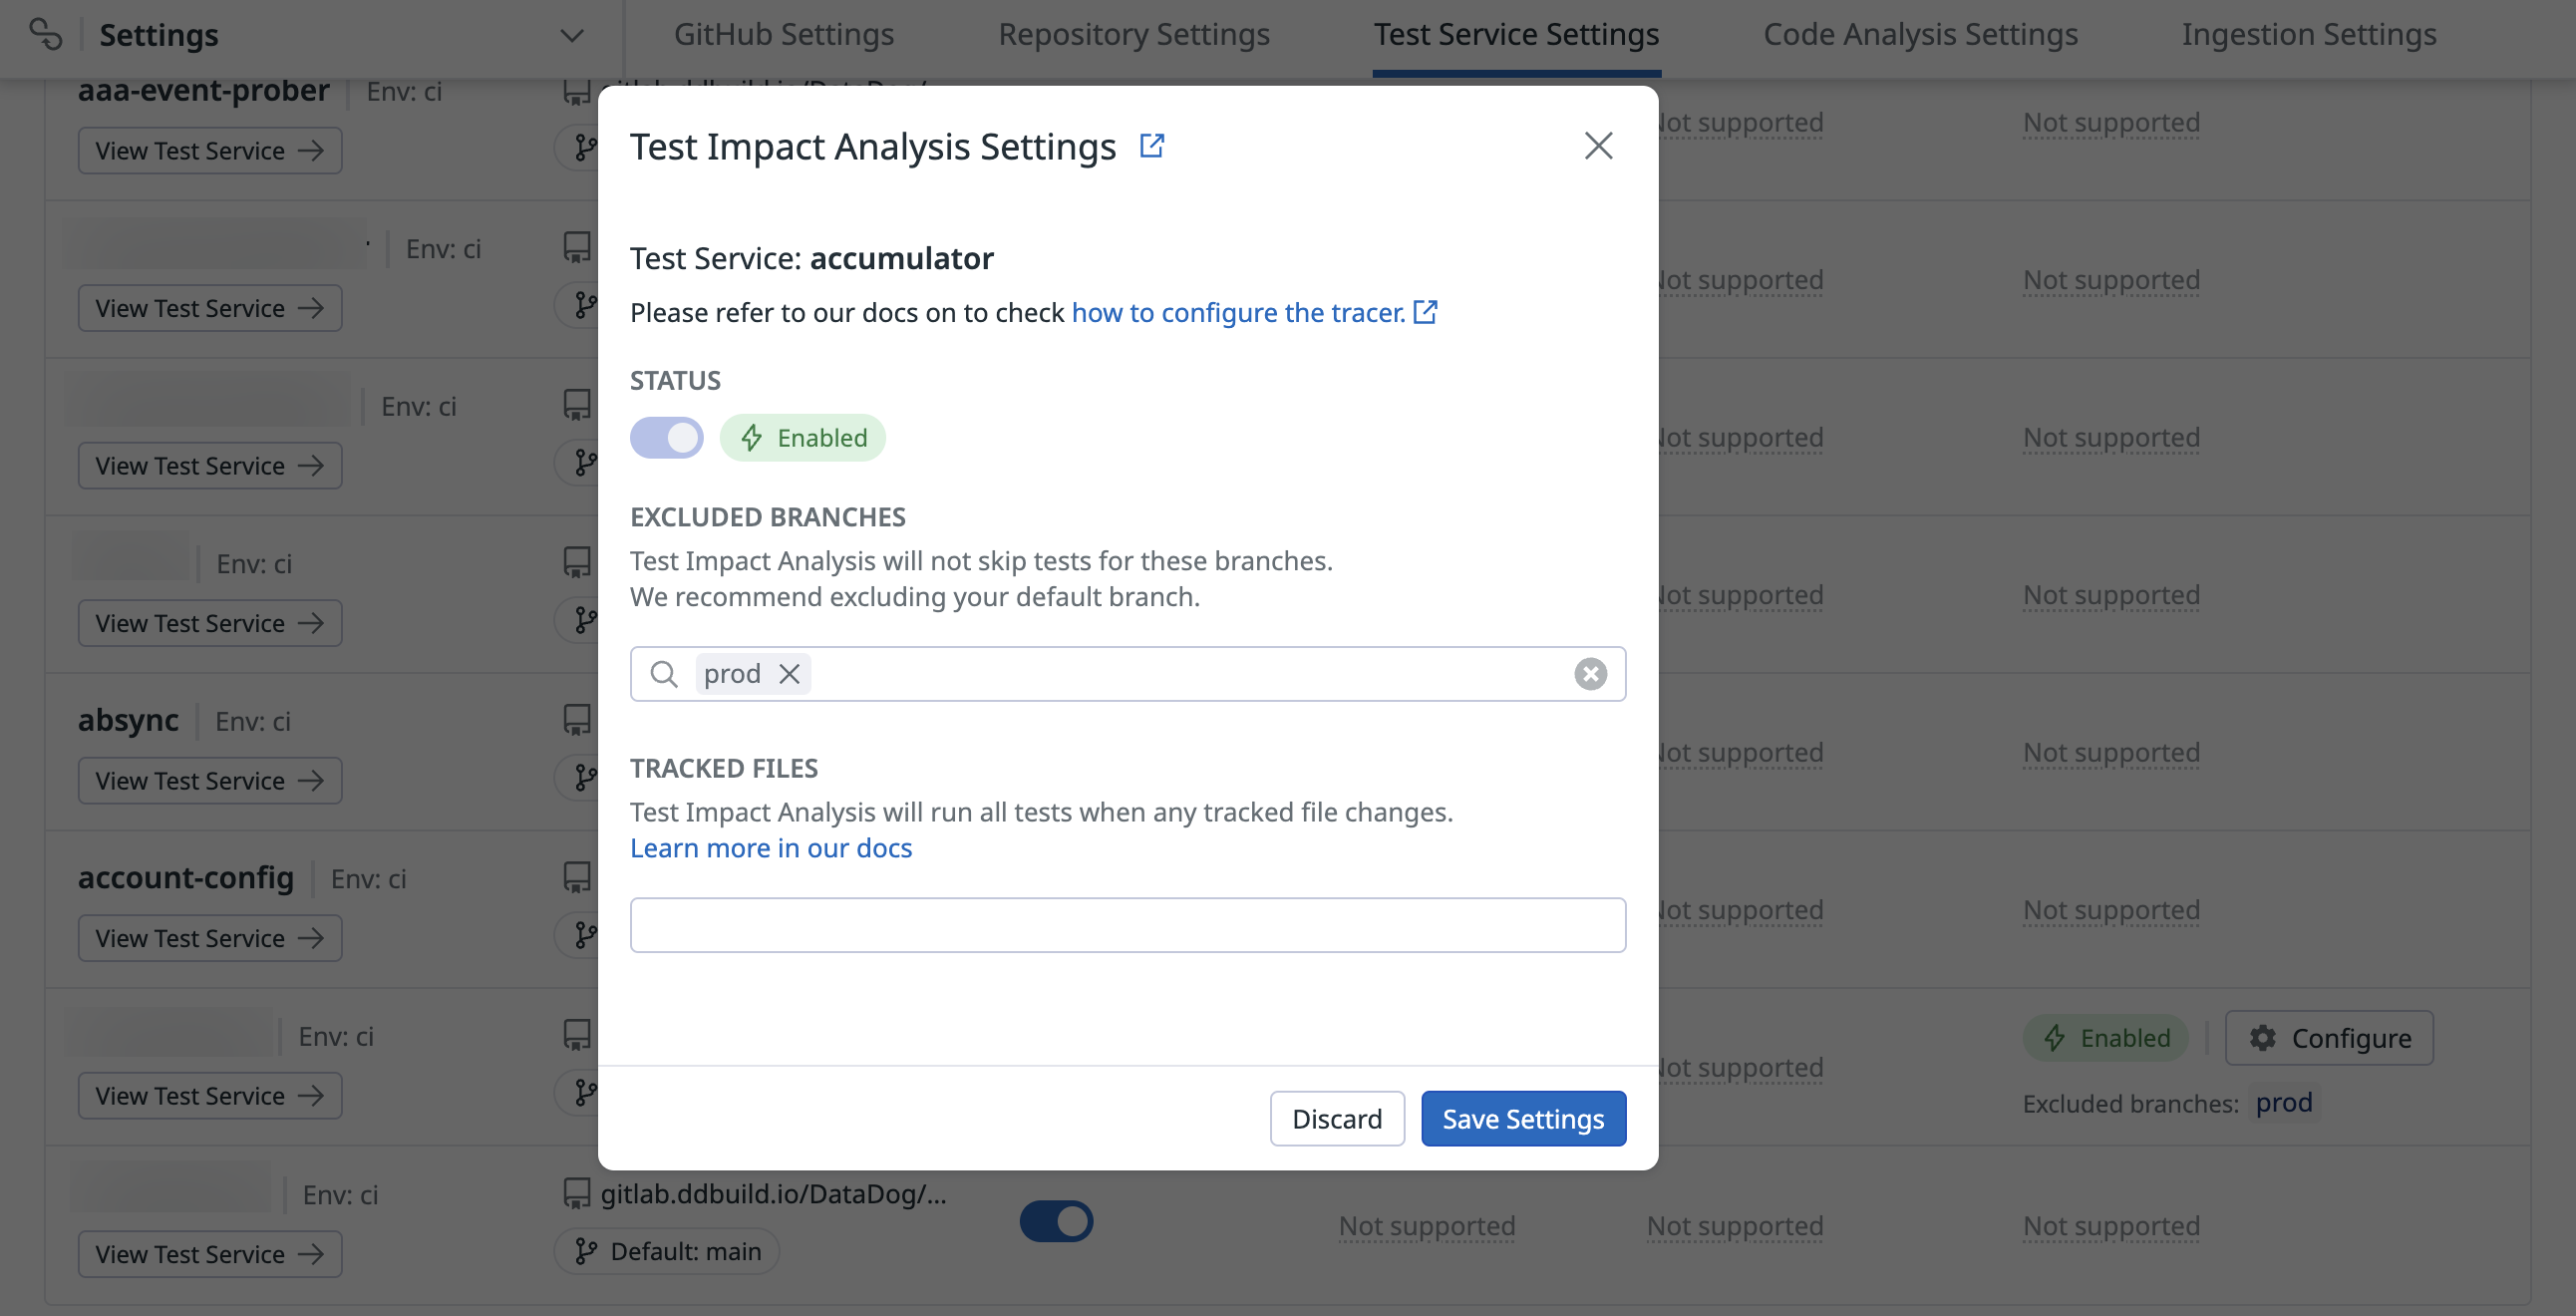
Excluded branches
Due to the limitations described above, the default branch of your repository is automatically excluded from having Test Impact Analysis enabled. Datadog recommends this configuration to ensure that all of your tests run prior to reaching production.
If there are other branches you want to exclude, add them on the Test Optimization Settings page. The query bar supports using the wildcard character * to exclude any branches that match, such as release_*.
Excluded branches collect per-test code coverage, which has a performance impact on the total testing time. However, this performance impact is mitigated by only collecting code coverage when Datadog detects that running with code coverage generates enough new coverage information that it offsets the cost of collecting the coverage. You can check whether a test session has code coverage enabled or not by looking at the @test.code_coverage.enabled field.
Tracked files
Tracked files are non-code files that can potentially impact your tests. Changes in tracked files could make your tests fail or change the code coverage of your tests. Examples of files that are good candidates to add as tracked files are:
- Dockerfiles used for the CI environment
- Files that define your dependencies (for example,
pom.xmlin Maven,requirements.txtin Python, orpackage.jsonin Javascript) - Makefiles
When you specify a set of tracked files, Test Impact Analysis runs all tests if any of these files change.
All file paths are considered to be relative to the root of the repository. You may use the * and ** wildcard characters to match multiple files or directories. For instance, **/*.mdx matches any .mdx file in the repository.
Explore test sessions
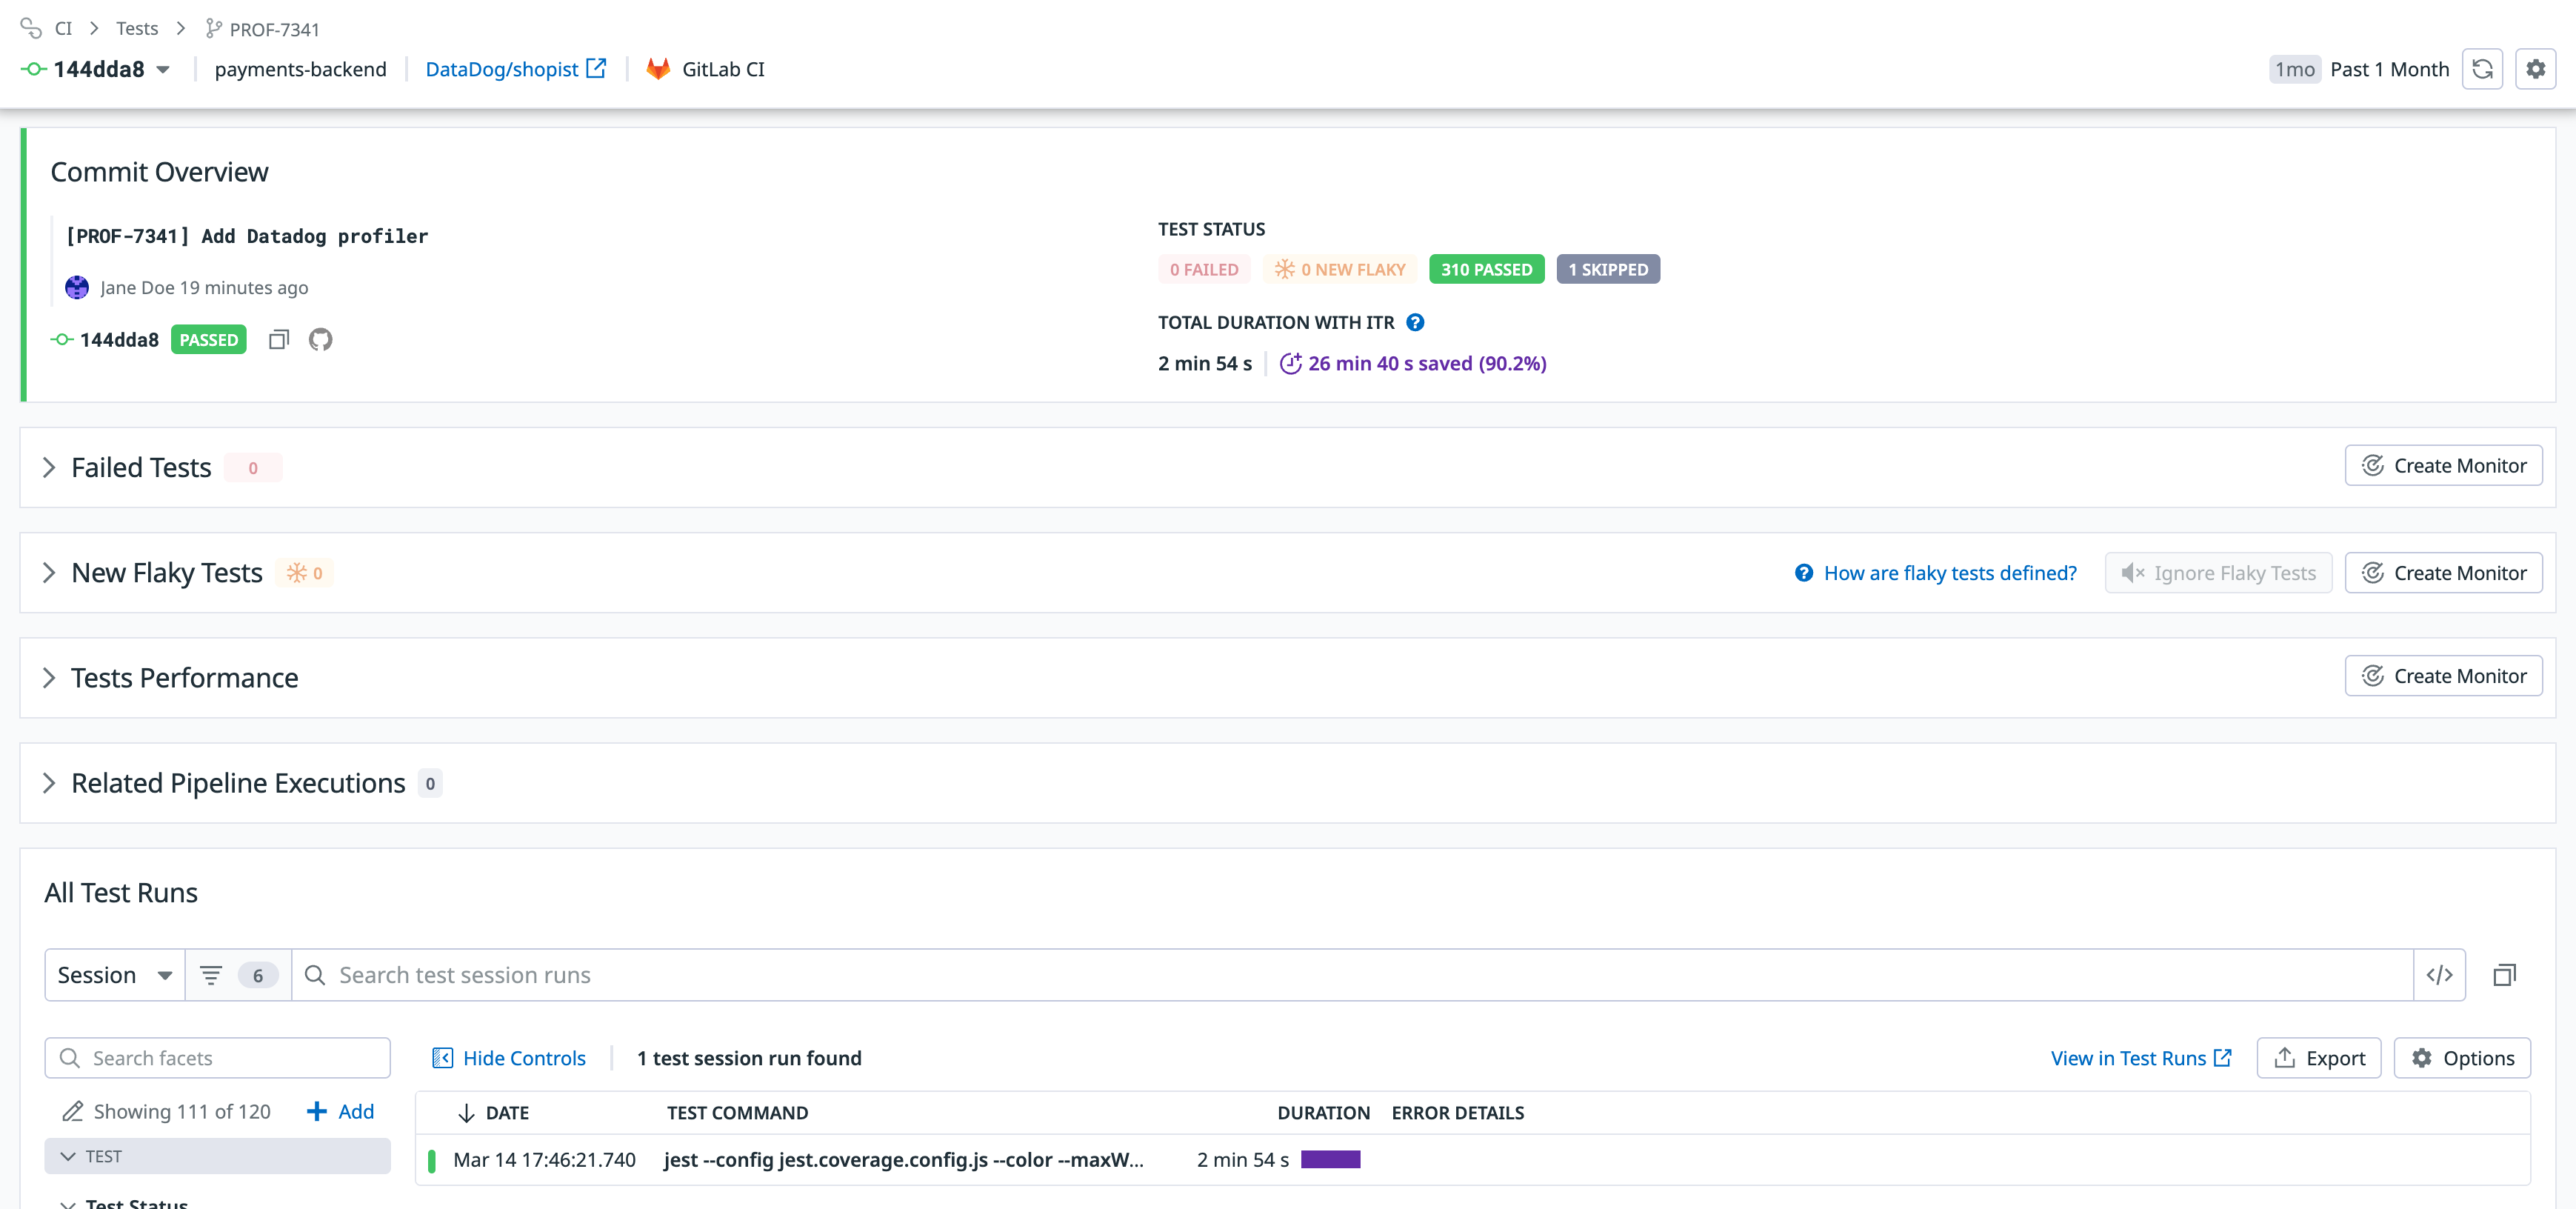
You can explore the time savings you get from Test Impact Analysis by looking at the test commit page and test sessions panel.
When Test Impact Analysis is active and skipping tests, purple text displays the amount of time saved on each test session or on each commit. The duration bar also changes color to purple so you can identify which test sessions are using Test Impact Analysis on the Test Runs page.
Explore adoption and global savings
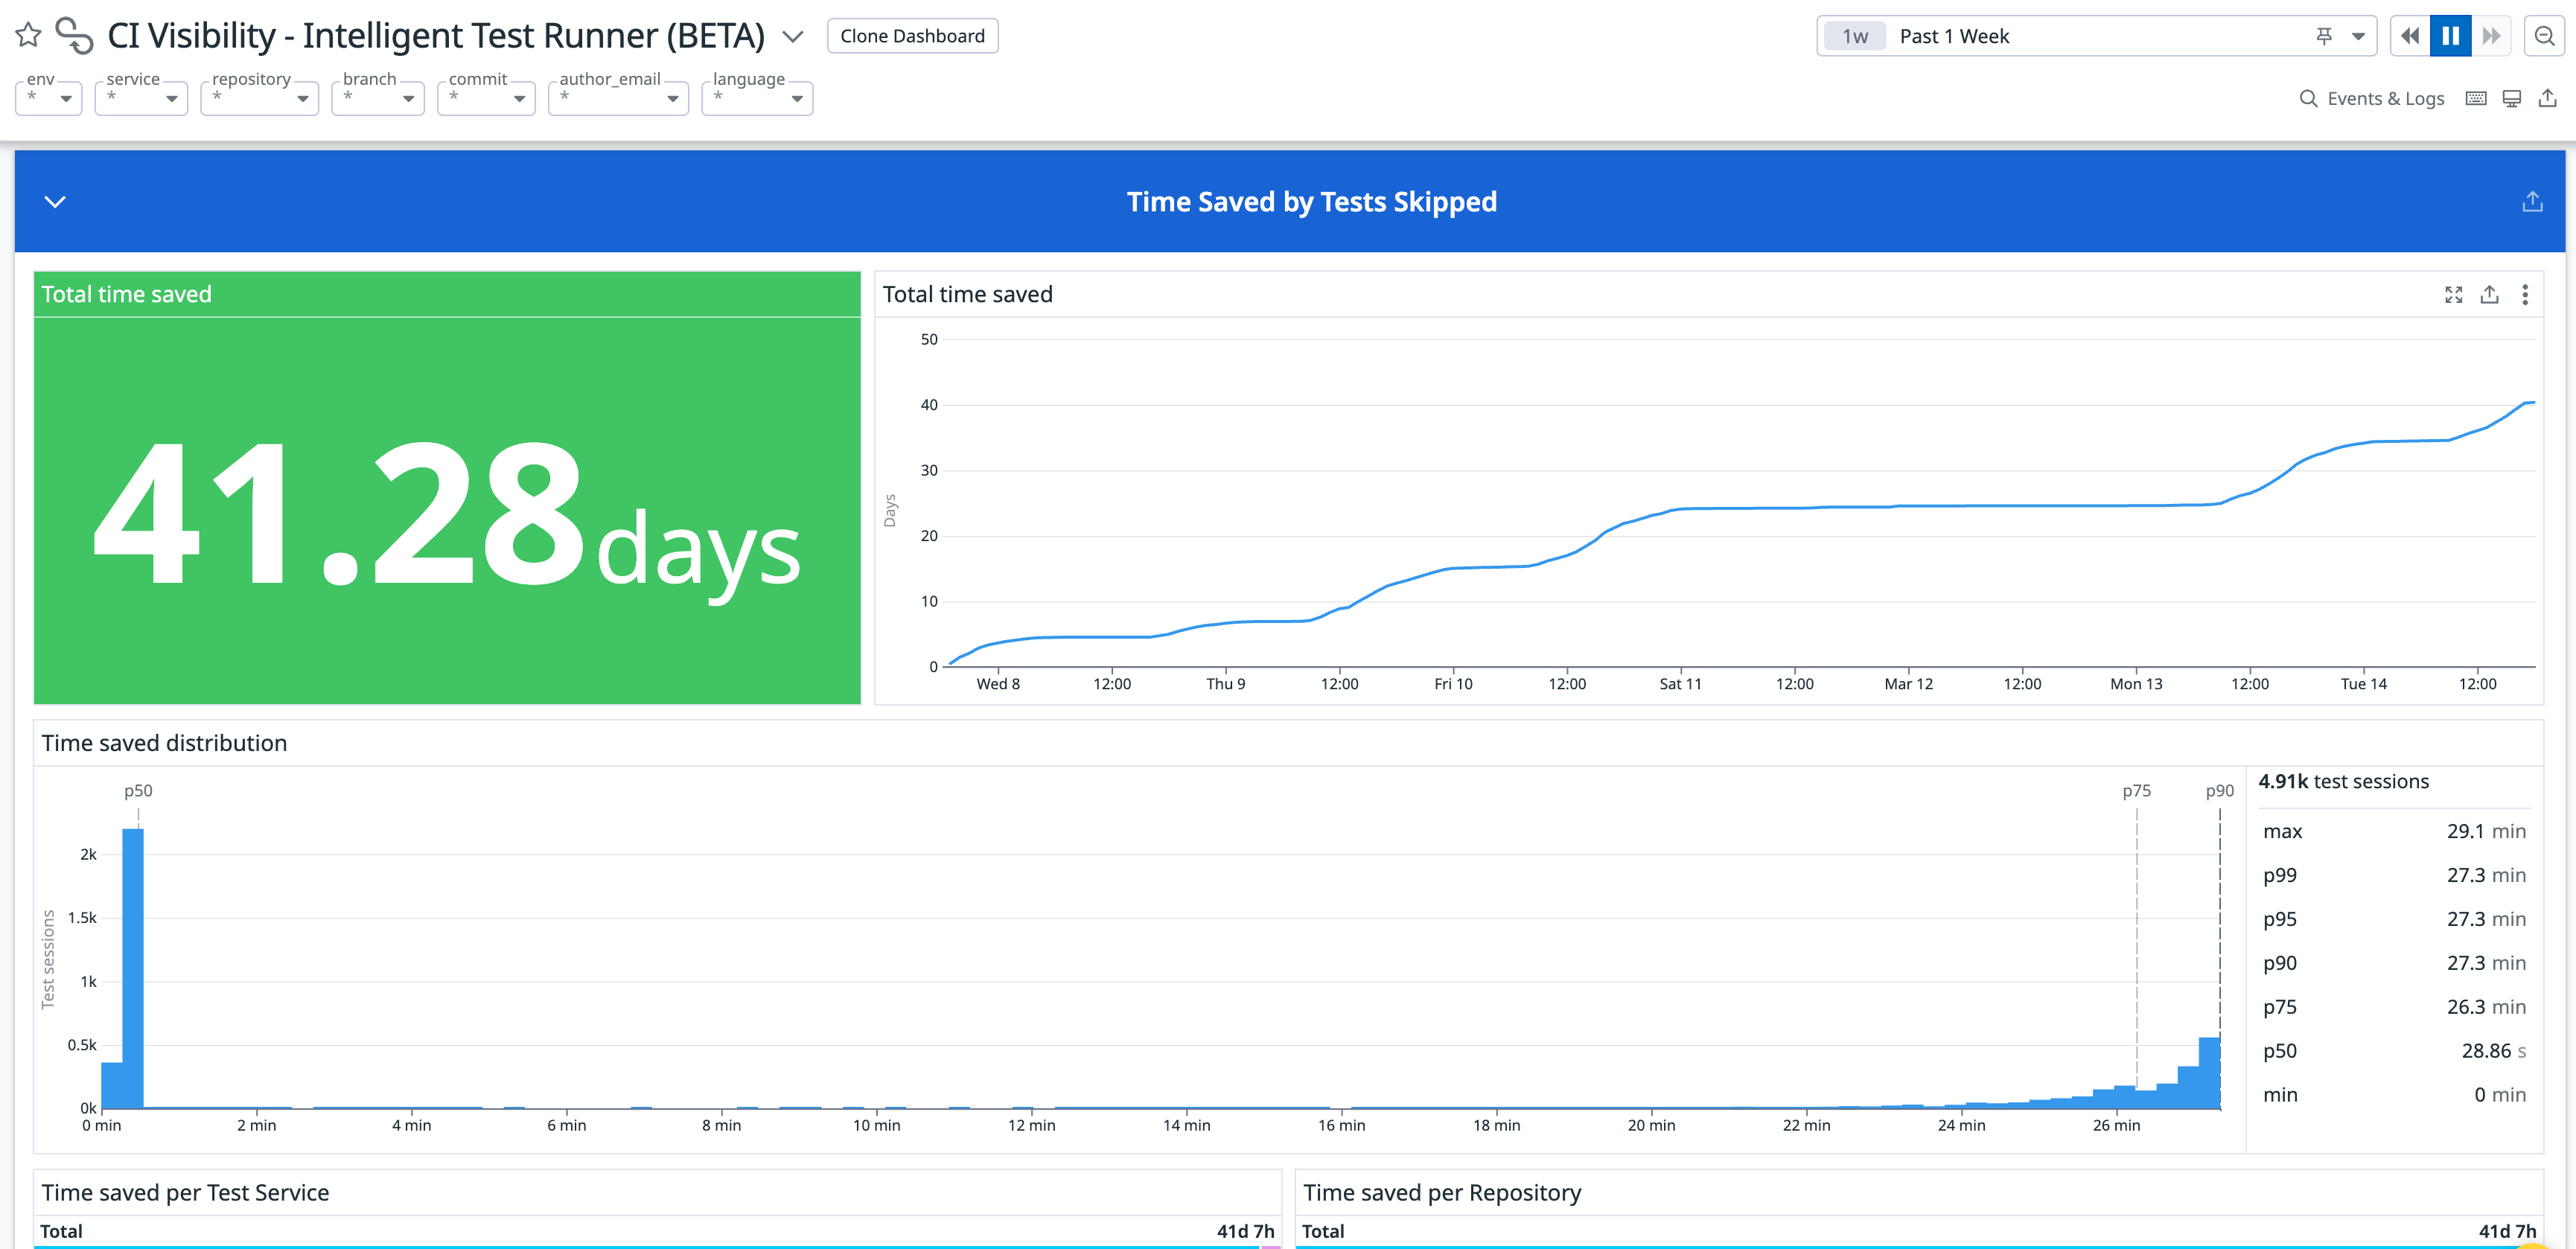
Track your organization’s savings and adoption of Test Impact Analysis through the out-of-the-box Test Impact Analysis dashboard. The dashboard includes widgets to track your overall savings as well as a per-repository, per-committer, and per-service view of the data. View the dashboard to understand which parts of your organization are using and getting the most out of Test Impact Analysis.
The dashboard also tracks adoption of Test Impact Analysis throughout your organization.
Further Reading
Documentation, liens et articles supplémentaires utiles:


