- Principales informations
- Getting Started
- Agent
- API
- Tracing
- Conteneurs
- Dashboards
- Database Monitoring
- Datadog
- Site Datadog
- DevSecOps
- Incident Management
- Intégrations
- Internal Developer Portal
- Logs
- Monitors
- OpenTelemetry
- Profileur
- Session Replay
- Security
- Serverless for AWS Lambda
- Software Delivery
- Surveillance Synthetic
- Tags
- Workflow Automation
- Learning Center
- Support
- Glossary
- Standard Attributes
- Guides
- Agent
- Intégrations
- Développeurs
- OpenTelemetry
- Administrator's Guide
- API
- Partners
- Application mobile
- DDSQL Reference
- CoScreen
- CoTerm
- Remote Configuration
- Cloudcraft
- In The App
- Dashboards
- Notebooks
- DDSQL Editor
- Reference Tables
- Sheets
- Alertes
- Watchdog
- Métriques
- Bits AI
- Internal Developer Portal
- Error Tracking
- Change Tracking
- Service Management
- Actions & Remediations
- Infrastructure
- Cloudcraft
- Resource Catalog
- Universal Service Monitoring
- Hosts
- Conteneurs
- Processes
- Sans serveur
- Surveillance réseau
- Cloud Cost
- Application Performance
- APM
- Termes et concepts de l'APM
- Sending Traces to Datadog
- APM Metrics Collection
- Trace Pipeline Configuration
- Connect Traces with Other Telemetry
- Trace Explorer
- Recommendations
- Code Origin for Spans
- Observabilité des services
- Endpoint Observability
- Dynamic Instrumentation
- Live Debugger
- Suivi des erreurs
- Sécurité des données
- Guides
- Dépannage
- Profileur en continu
- Database Monitoring
- Agent Integration Overhead
- Setup Architectures
- Configuration de Postgres
- Configuration de MySQL
- Configuration de SQL Server
- Setting Up Oracle
- Setting Up Amazon DocumentDB
- Setting Up MongoDB
- Connecting DBM and Traces
- Données collectées
- Exploring Database Hosts
- Explorer les métriques de requête
- Explorer des échantillons de requêtes
- Exploring Database Schemas
- Exploring Recommendations
- Dépannage
- Guides
- Data Streams Monitoring
- Data Jobs Monitoring
- Data Observability
- Digital Experience
- RUM et Session Replay
- Surveillance Synthetic
- Continuous Testing
- Product Analytics
- Software Delivery
- CI Visibility
- CD Visibility
- Deployment Gates
- Test Visibility
- Code Coverage
- Quality Gates
- DORA Metrics
- Feature Flags
- Securité
- Security Overview
- Cloud SIEM
- Code Security
- Cloud Security Management
- Application Security Management
- Workload Protection
- Sensitive Data Scanner
- AI Observability
- Log Management
- Pipelines d'observabilité
- Log Management
- CloudPrem
- Administration
Scoping Downtime
Cette page n'est pas encore disponible en français, sa traduction est en cours.
Si vous avez des questions ou des retours sur notre projet de traduction actuel, n'hésitez pas à nous contacter.
Si vous avez des questions ou des retours sur notre projet de traduction actuel, n'hésitez pas à nous contacter.
Overview
Downtimes are scheduled for system shutdowns, off-line maintenance, or upgrades without triggering your monitors. Downtimes silence all monitor alerts and notifications, but do not prevent monitor state transitions.
In most cases, you don’t want to completely mute all monitor notifications due to the risk of missing important alerts that are not related to any scheduled maintenance.
This guide illustrates how proper scoping of Downtimes can be done through the UI.Scoping Downtimes is a two-step process:
- Select the monitor or monitors you want to apply the downtime.
- Scope the query to filter the exact notifications to mute for each of the monitors.
Choose which monitors to silence
Define which monitors you want the downtime to target. There are three different options: target one specific monitor, multiple monitors, or all monitors.
Target one specific monitor
You can choose to temporarily mute one specific monitor. For example, if the monitor is sending many alerts at the moment or if it is the only monitor impacted by an upcoming maintenance.
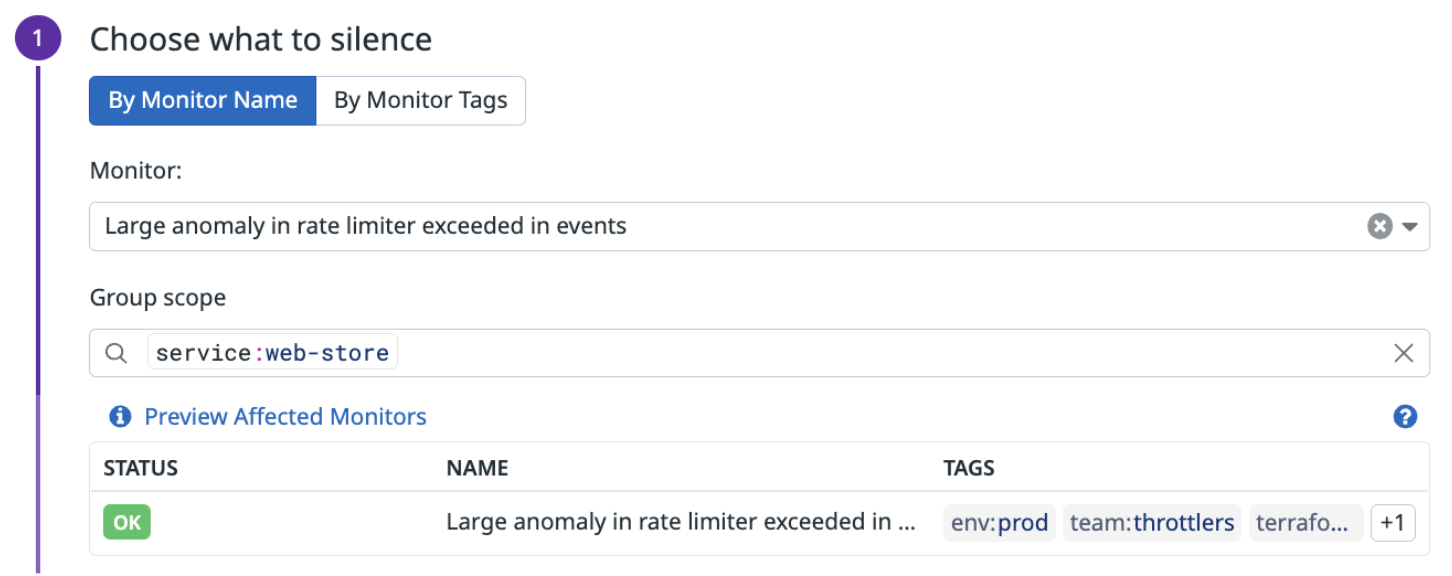
In the downtime configuration, select By Monitor Name and search for the monitor in question.
Target multiple monitors based on monitor tags
Monitor tags are independent of tags sent by the Agent or integrations and tags assigned to the data you are querying.
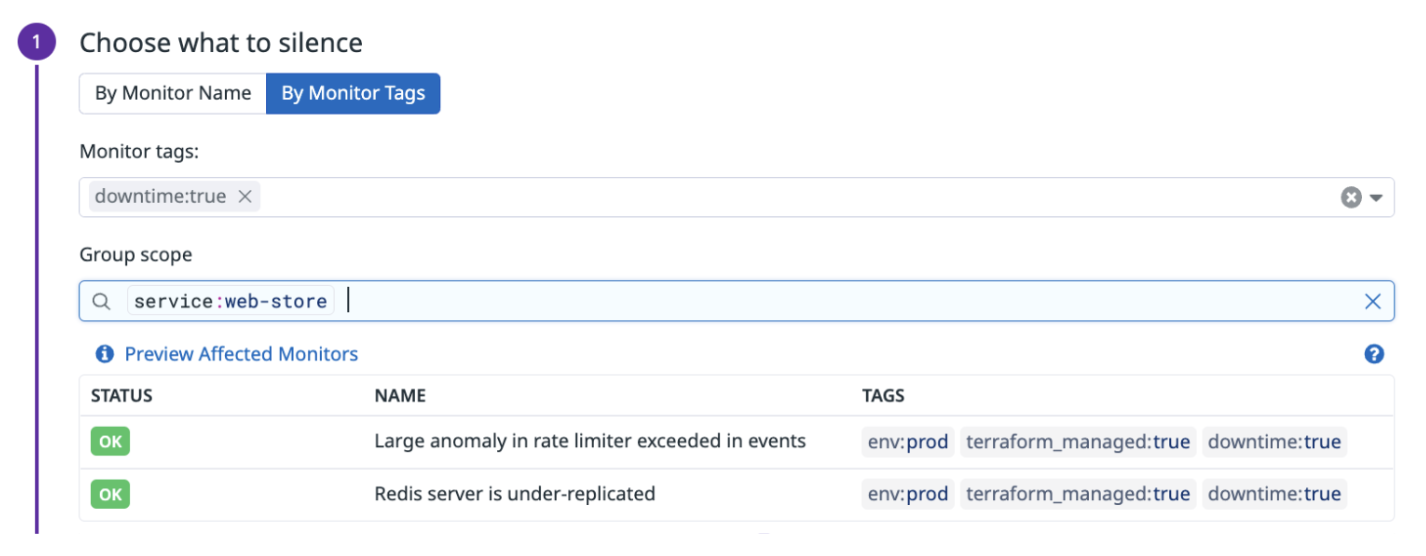
Downtimes can be scheduled for monitors based on their monitor tags, and further scoped down by tags grouped in the monitor query. Select By Monitor Tags and enter the monitor tags that you want to target.
Note: Tags are additive, meaning that an input of env:dev team:automations will target monitors that are tagged with both, env:dev AND team:automations.
Target all monitors
For both By Monitor Name or By Monitor Tags options, you can scope to target all monitors by selecting the first item in the dropdown menu labeled All Monitors.
Granularly scope downtimes
Use group scope to apply additional filters to your downtime and have granular control over which monitors to mute. The group scope of a downtime is matched after the monitor specific target. If you target multiple monitors by using monitor tags, it first needs to find monitors that are tagged accordingly before it matches the group scope.
The examples in this guide show how the Group scope may be applied to monitors where multi alert grouping is configured
Mute monitors for a specific tag
- To schedule a downtime on only one group (in this case,
service:web-store), enter that group in theGroup scopefield. - Click Preview affected monitors to verify that the monitor chosen is still in scope, so alerts for the group
service:web-storeare muted during the scheduled downtime.
After the scheduled downtime begins, only alerts for the group service:web-store are muted for this monitor.
This mutes any alerts that includes the tag service:web-store, for example:
| Monitor Group | Muted |
|---|---|
host:A, service:web-store | Yes |
host:A, host:B, service:synthesizer, service:demo, service:web-store | Yes |
host:A, host:B, service:synthesizer | No (missing service:web-store) |
Mute monitors scoped to multiple tags
- To schedule a downtime on multiple groups (for example,
service:web-storeandenv:prod), enter that group in theGroup scopefield. - Click Preview affected monitors to verify the monitors that are in scope.
- After the scheduled downtime begins, alerts are muted for the group:
env:prodANDservice:web-store
| Monitor Group | Muted |
|---|---|
env:prod, service:web-store | Yes |
env:prod, env:dev, service:synthesizer, service:demo, service:web-store | Yes |
env:dev, env:demo, service:web-store | No (missing env:prod) |
env:prod, env:demo, service:synthesizer | No (missing service:web-store) |
Mute monitors by the union of tags
To combine multiple tag values into a more complex scope, use OR unions in a single downtime. For instance, you want to mute all notifications related to either your development or staging environments. Use env:(dev OR staging) as your scope query.
Note: The union of different tags (for example, env:dev OR service:web-store) is not supported. For such cases, you need to create a separate downtime for each tag.
Query env:(dev OR staging)
| Monitor Group | Muted |
|---|---|
env:staging, service:web-store | Yes |
env:dev, env:prod, service:web-store | Yes |
env:demo, env:staging, service:web-store | Yes |
env:demo, env:prod, service:web-store | No (missing both env:dev and env:staging) |
Mute monitors with wildcard scopes
Running large upgrades within your infrastructure is not uncommon. Downtimes can help mute all impacted entities, without much extra scripting. For instance, you could be upgrading all hosts of a given service. These hosts could follow certain naming conventions in your organization, such as being prefixed with their related application. This could result in hundreds of hosts named something like host:mydemoapplication-host-1and host:mydemoapplication-host-2.
Create a downtime scoped by host:mydemoapplication-*. This matches and mutes all hosts that are prefixed accordingly. You can also apply the inverse where the downtime is scoped by host:*-mydemoapplication. This matches and mutes all hosts that end with mydemoapplication.
Exclude groups from being muted
If you are running your application and infrastructure on multiple environments, you likely have one production environment and multiple non-production environments (for example, testing, regression checks, or demo). To avoid receiving alerts for non-production environments, you could set up a downtime that is scoped with: env:* -env:prod. This scope targets all alerts that have the env tag set and then excludes your production environment as a secondary step.
Multiple monitors scoped with the same tag
- Monitor A is a multi alert monitor for hosts reporting a metric averaged across multiple
servicegroups. - Monitor B is a multi alert monitor for hosts reporting the same metric for
service:web-store. - Downtime is scheduled for any monitor that has the
downtime:truemonitor tag. - This downtime is constrained to the group
service:web-store. - Click Preview affected monitors to verify the monitors that are in scope. In this example, it shows both monitors have the group
service:web-storein scope.
Monitor A shows downtime has started, but only for the group in scope:
service:web-storeMonitor B shows downtime has started for
service:web-store. Because all the monitor’s groups (byhost) belong toservice:web-store, the result is that all hosts are muted during downtime for this monitor.
Further reading
Documentation, liens et articles supplémentaires utiles:


