JFrog Platform (Self-hosted)
JFrog Artifactory Logs dashboard
JFrog Artifactory Metrics dashboard
JFrog Xray Logs dashboard
JFrog Xray Violations dashboard
JFrog Xray Metrics dashboard
Cette page n'est pas encore disponible en français, sa traduction est en cours.
Si vous avez des questions ou des retours sur notre projet de traduction actuel,
n'hésitez pas à nous contacter.
The existing agent check to gather JFrog metrics has been replaced with Fluentd. The agent check is deprecated.
Overview
JFrog is a universal, hybrid, and end-to-end DevOps platform. This integration helps any JFrog self-hosted customer seamlessly stream logs, violations and metrics from JFrog Artifactory and JFrog Xray straight into Datadog. This integration comes packaged with Datadog log pipelines which enrich and index logs to make them more searchable and treatable using Datadog facets.
Let JFrog know how we can improve the integration. Feel free to visit our GitHub for more detailed documentation.
JFrog dashboards
You can find the dashboards packaged with this integration under the Assets tab on the integration tile.
JFrog Artifactory dashboard
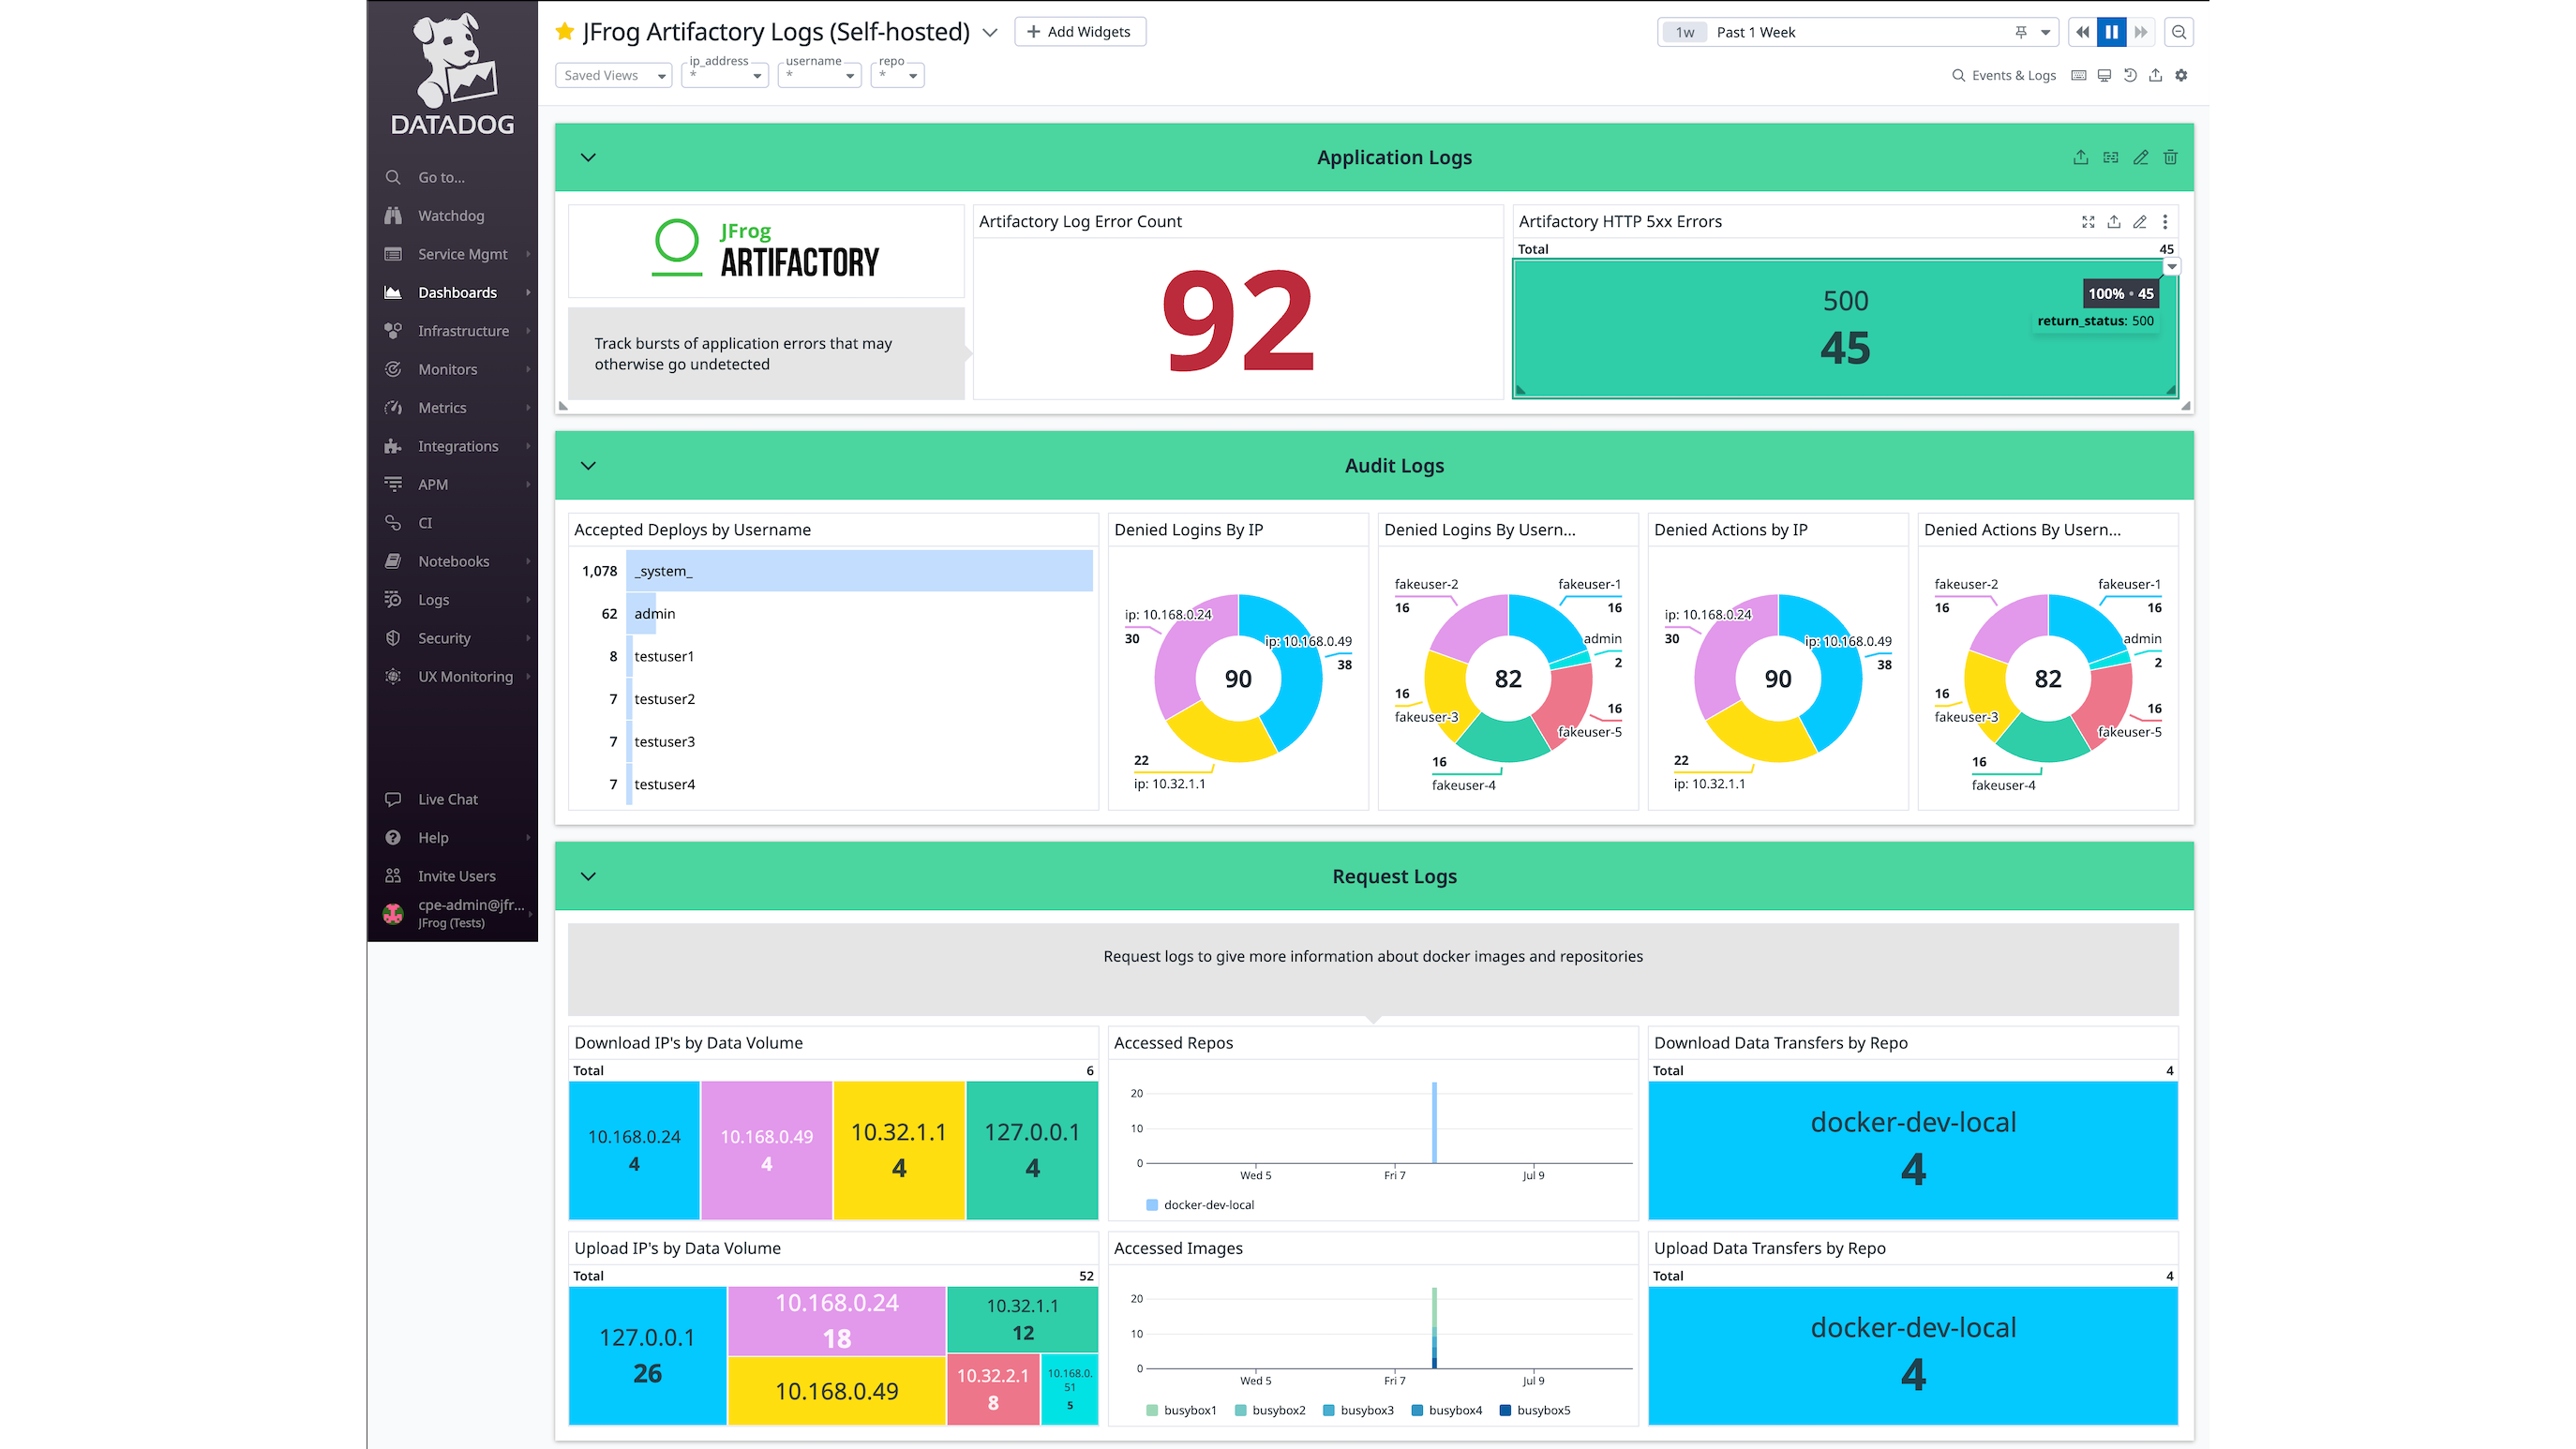
This dashboard is divided into three sections: Application, Audit and Requests.
- Application - This section tracks Log Volume (information about different log sources) and Artifactory Errors over time (bursts of application errors that may otherwise go undetected).
- Audit - This section tracks audit logs that help you determine who is accessing your Artifactory instance and from where. These can help you track potentially malicious requests or processes (such as CI jobs) using expired credentials.
- Requests - This section tracks HTTP response codes and the top 10 IP addresses for uploads and downloads.
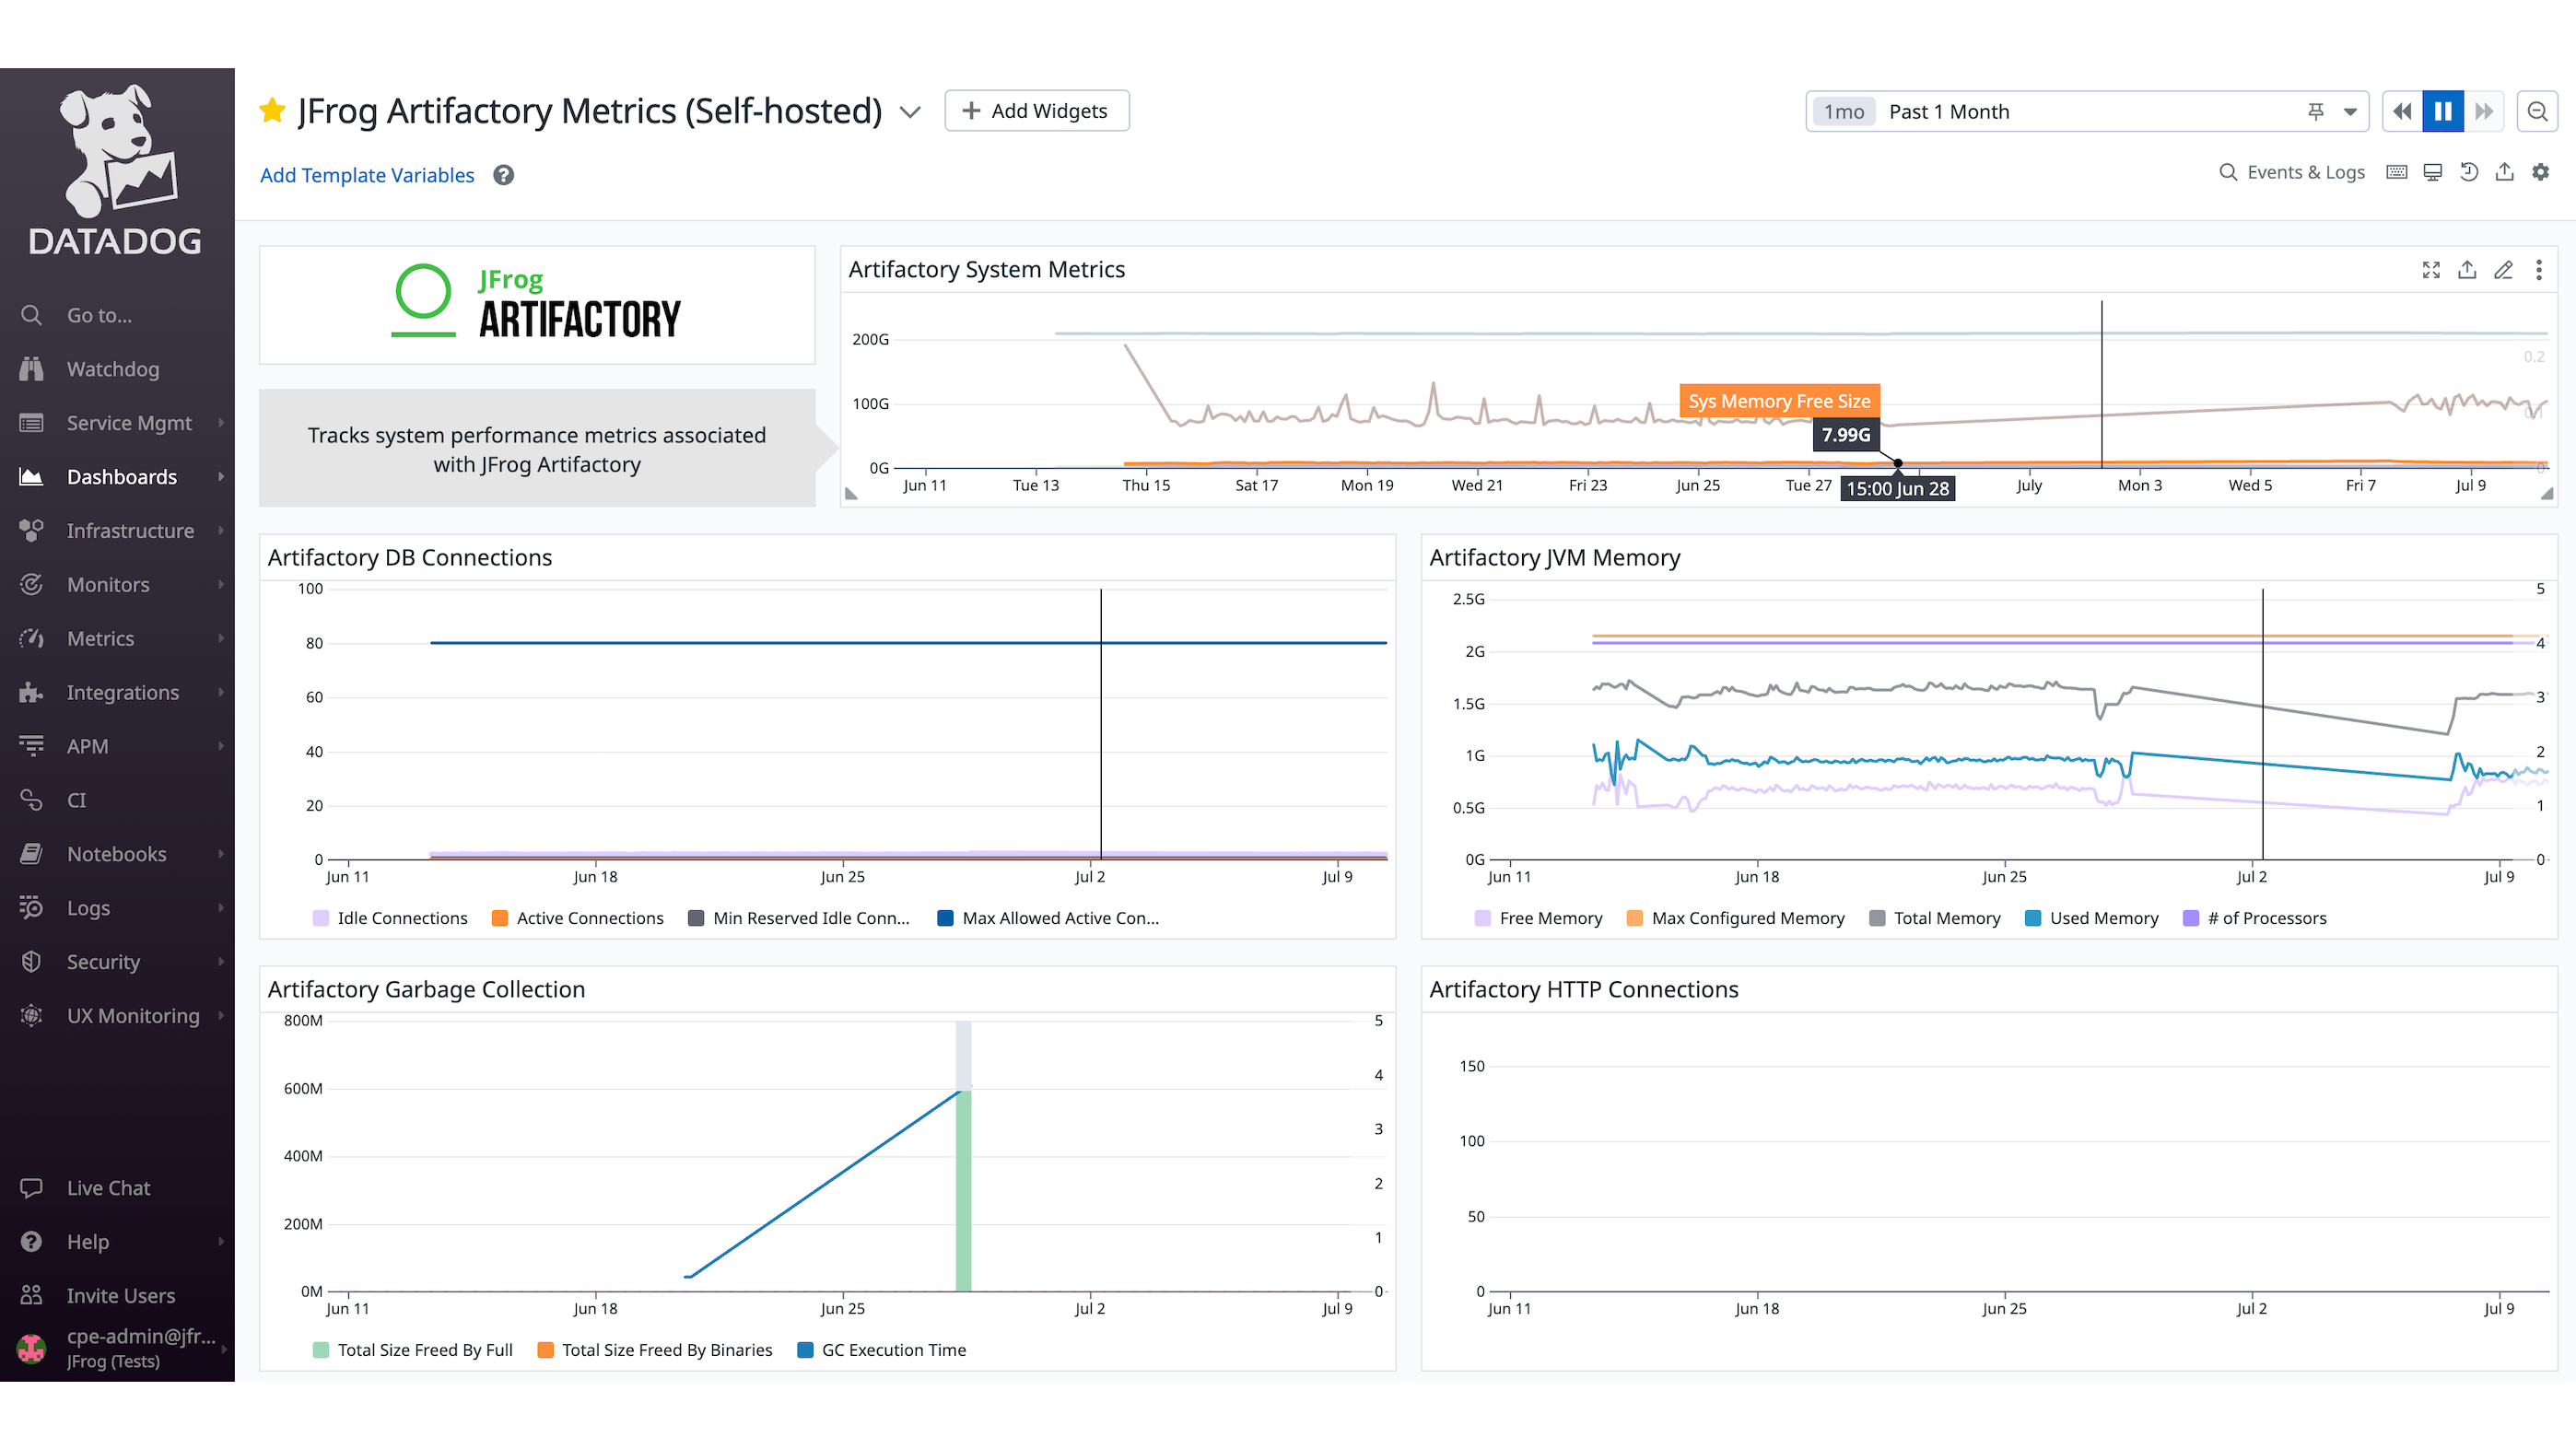
JFrog Artifactory Metrics dashboard
This dashboard tracks Artifactory System Metrics, JVM memory, Garbage Collection, Database Connections, and HTTP Connections metrics.
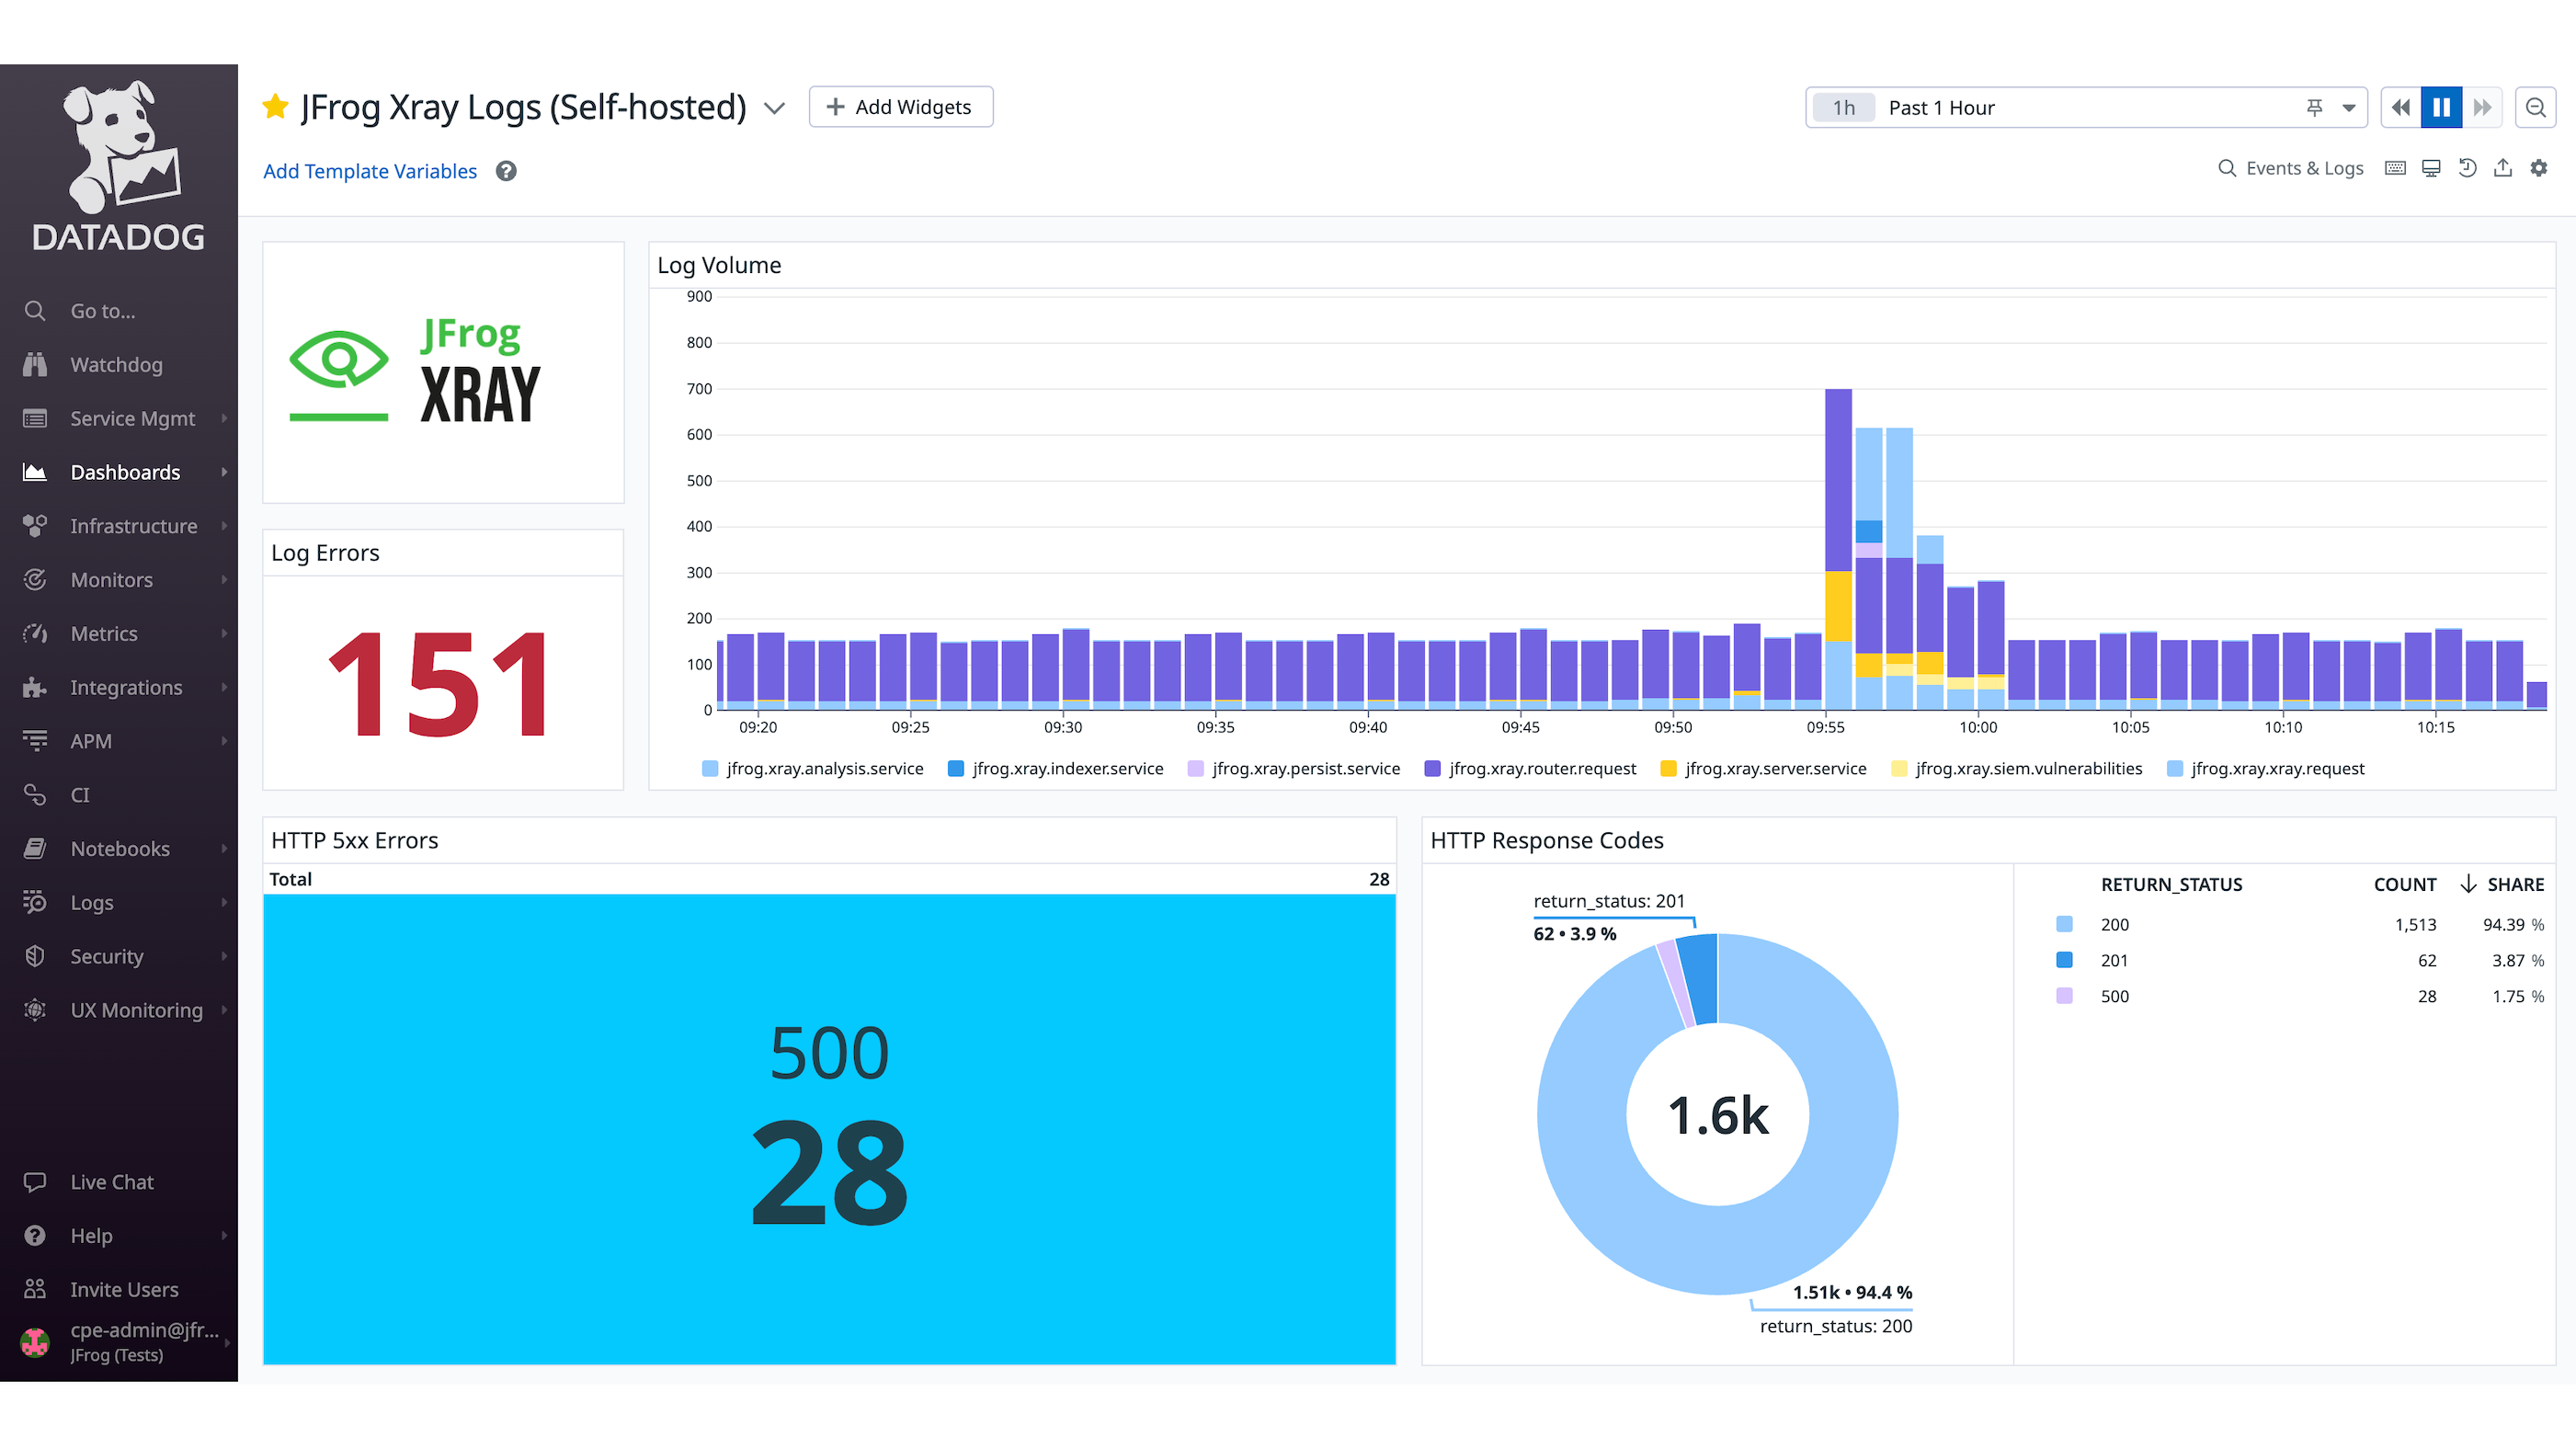
JFrog Xray Logs dashboard
This dashboard provides a summary of access, service and traffic log volumes associated with Xray. Additionally, customers are also able to track various HTTP response codes, HTTP 500 errors, and log errors for greater operational insight.
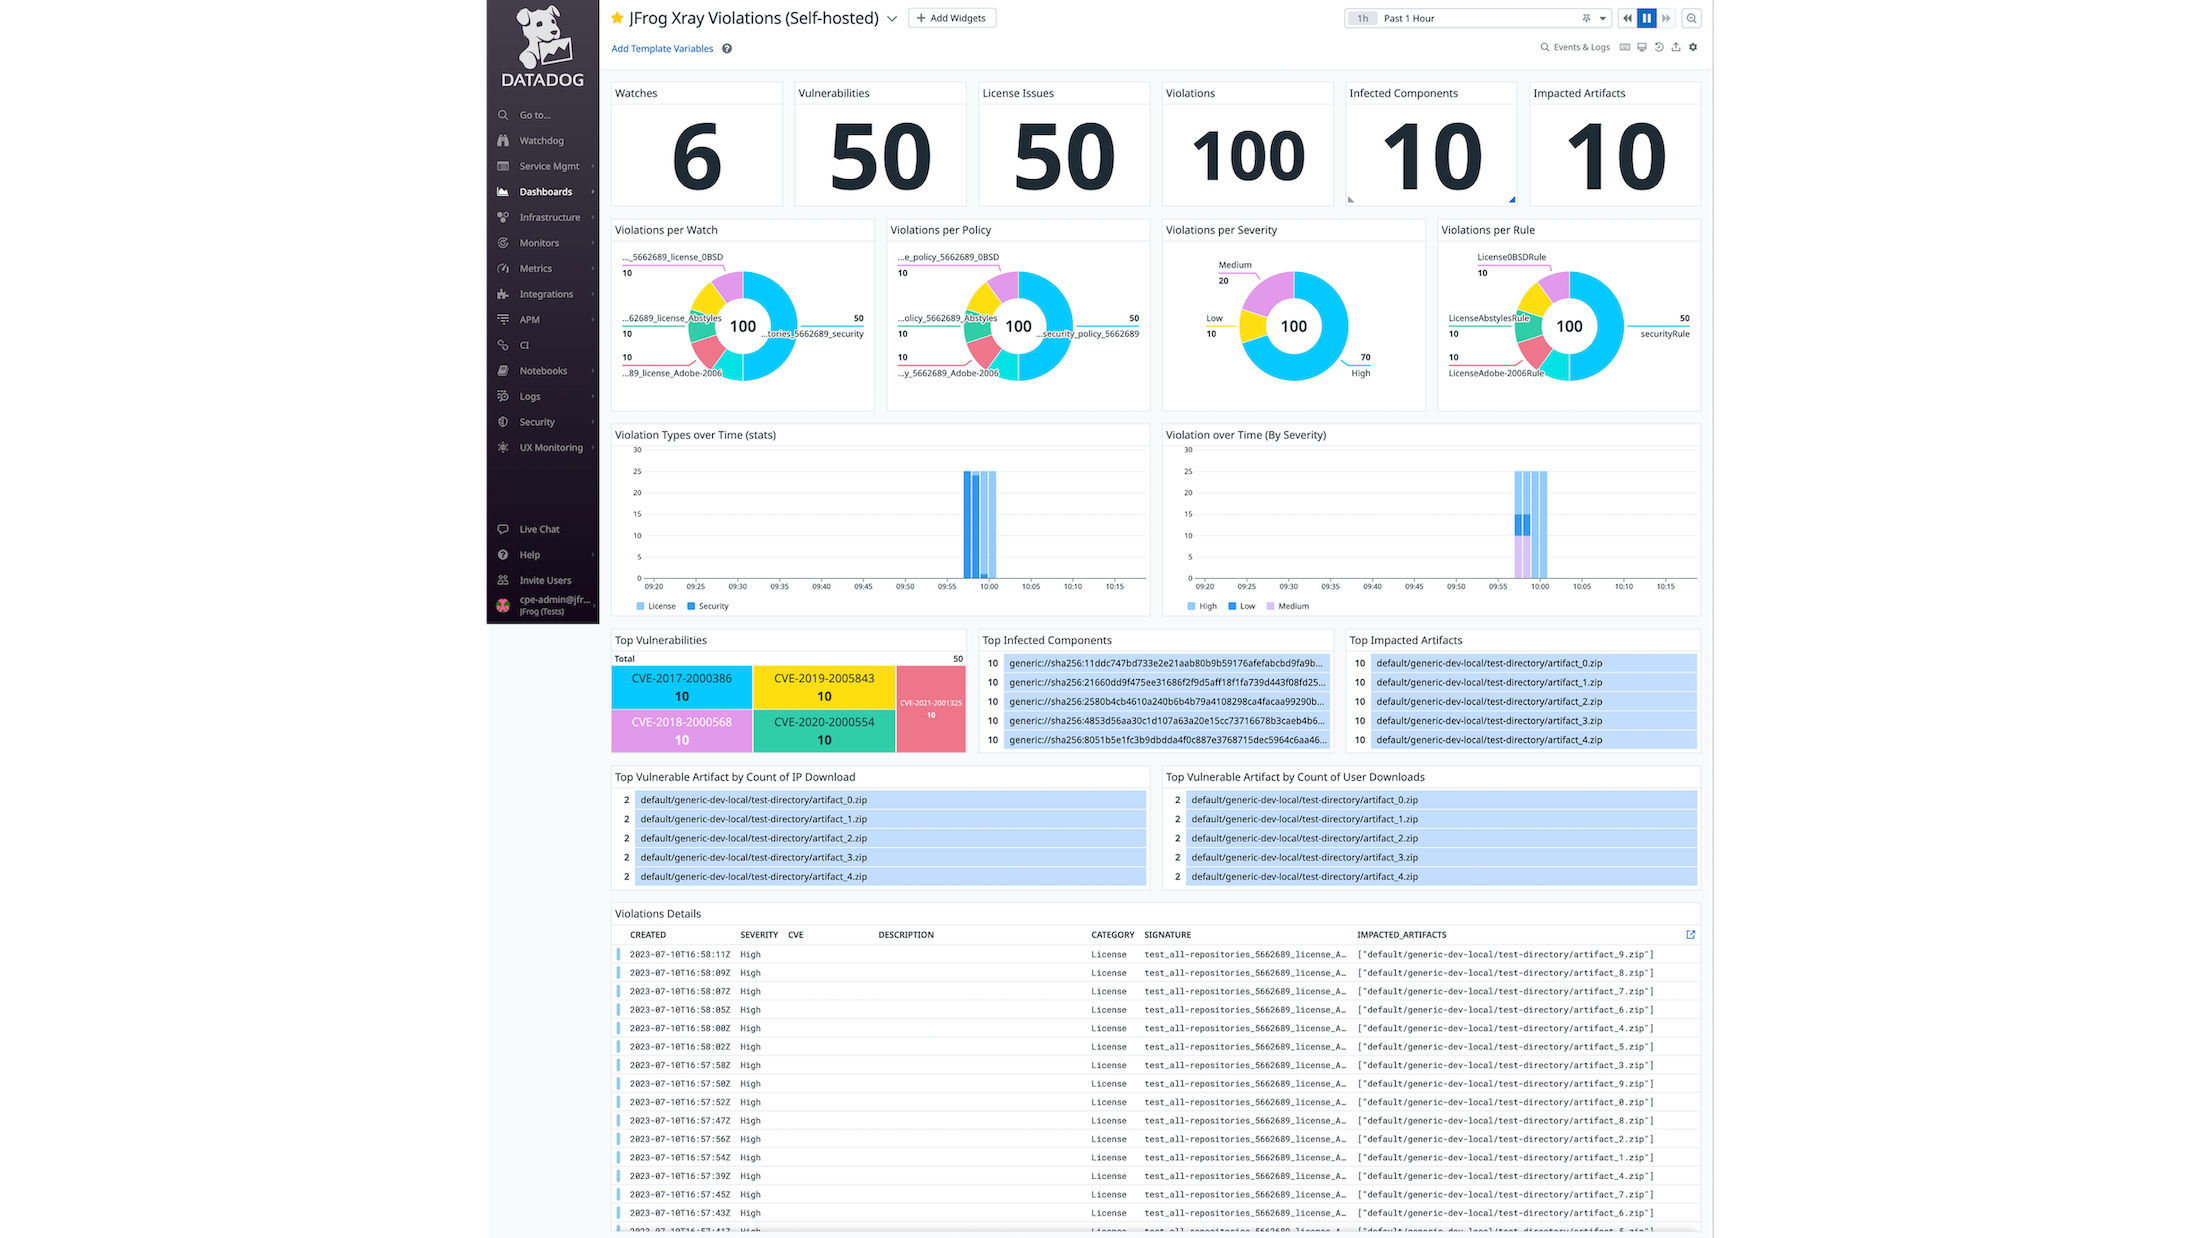
JFrog Xray Violations dashboard
This dashboard provides an aggregated summary of all the license violations and security vulnerabilities found by Xray. Information is segmented by watch policies and rules. Trending information is provided on the type and severity of violations over time, as well as insights on most frequently occurring CVEs, top impacted artifacts and components.
JFrog Xray Metrics dashboard
This dashboard tracks System Metrics and data metrics about Scanned Artifacts and Scanned Components.
Setup
Requirements
Fluentd Installation
We recommend following the installation guide that matches your environment:
Data Collected
Metrics
jfrog.artifactory.app_disk_free_bytes
(gauge) | Free bytes for app home directory disk device |
jfrog.artifactory.app_disk_total_bytes
(gauge) | Used bytes for app home directory disk device |
jfrog.artifactory.sys_memory_free_bytes
(gauge) | Sys Memory Free Size |
jfrog.artifactory.sys_memory_used_bytes
(gauge) | Sys Memory Used Size |
jfrog.artifactory.sys_cpu_ratio
(gauge) | Sys CPU Ratio |
jfrog.artifactory.jfrt_db_connections_idle_total
(gauge) | Total Idle Connections |
jfrog.artifactory.jfrt_db_connections_active_total
(gauge) | Total Active Connections |
jfrog.artifactory.jfrt_db_connections_max_active_total
(gauge) | Total Max Active Connections |
jfrog.artifactory.jfrt_db_connections_min_idle_total
(gauge) | Total Min Idle Connections |
jfrog.artifactory.jfrt_runtime_heap_maxmemory_bytes
(gauge) | Max Memory |
jfrog.artifactory.jfrt_runtime_heap_freememory_bytes
(gauge) | Free Memory |
jfrog.artifactory.jfrt_runtime_heap_processors_total
(gauge) | Available Processors |
jfrog.artifactory.jfrt_runtime_heap_totalmemory_bytes
(gauge) | Total Memory |
jfrog.artifactory.jfrt_artifacts_gc_size_cleaned_bytes
(gauge) | Total Bytes recovered by Garbage Collection |
jfrog.artifactory.jfrt_artifacts_gc_binaries_total
(gauge) | Total number of binaries removed by Garbage Collection |
jfrog.artifactory.jfrt_artifacts_gc_duration_seconds
(gauge) | Time taken for garbage collection
Shown as second |
jfrog.artifactory.jfrt_http_connections_max_total
(gauge) | Max HTTP Connections |
jfrog.artifactory.jfrt_http_connections_leased_total
(gauge) | Leased HTTP Connections |
jfrog.artifactory.jfrt_http_connections_pending_total
(gauge) | Pending HTTP Connections |
jfrog.artifactory.jfrt_http_connections_available_total
(gauge) | Available HTTP Connections |
jfrog.xray.app_disk_free_bytes
(gauge) | Free bytes for app home directory disk device |
jfrog.xray.app_disk_used_bytes
(gauge) | Used bytes for app home directory disk device |
jfrog.xray.sys_memory_free_bytes
(gauge) | Host free virtual memory |
jfrog.xray.sys_memory_used_bytes
(gauge) | Host used virtual memory |
jfrog.xray.sys_cpu_ratio
(gauge) | Sys CPU Ratio |
jfrog.xray.jfxr_data_artifacts_total
(gauge) | Total Scanned Artifacts in Xray |
jfrog.xray.jfxr_data_components_total
(gauge) | Total Components Artifacts in Xray |
Events
The JFrog check does not include any events.
Service Checks
The JFrog check does not include any service checks.
Support
Need help? Contact support@jfrog.com or open a support ticket on JFrog Customer Support Portal
Troubleshooting
Q : I am about to upgrade from on-prem to JFrog Cloud. Can I expect all the same logs to stream into Datadog from my SaaS instance post-migration when I install the SaaS version of the integration?
A: At launch, the SaaS version of the integration will only stream the artifactory-request, access-audit and access-security-audit logs from your SaaS JFrog instance to Datadog.