iboss.bandwidth.countries.total_bytes
(gauge) | Total number of bytes consumed by countries.
Shown as byte |
iboss.bandwidth.countries.total_connections
(gauge) | Total number of connections for countries.
Shown as connection |
iboss.bandwidth.countries.total_downstream_bytes
(gauge) | Total number of downstream bytes to countries.
Shown as byte |
iboss.bandwidth.countries.total_packets
(gauge) | Total number of packets transmitted for countries.
Shown as packet |
iboss.bandwidth.countries.total_upstream_bytes
(gauge) | Total number of upstream bytes from countries.
Shown as byte |
iboss.bandwidth.domains.total_bytes
(gauge) | Total number of bytes consumed by domains.
Shown as byte |
iboss.bandwidth.domains.total_connections
(gauge) | Total number of connections for domains.
Shown as connection |
iboss.bandwidth.domains.total_downstream_bytes
(gauge) | Total number of downstream bytes to domains.
Shown as byte |
iboss.bandwidth.domains.total_packets
(gauge) | Total number of packets transmitted for domains.
Shown as packet |
iboss.bandwidth.domains.total_upstream_bytes
(gauge) | Total number of upstream bytes from domains.
Shown as byte |
iboss.bandwidth.location.total_bytes
(gauge) | Total number of bytes consumed by locations.
Shown as byte |
iboss.bandwidth.location.total_connections
(gauge) | Total number of connections for locations.
Shown as connection |
iboss.bandwidth.location.total_downstream_bytes
(gauge) | Total number of downstream bytes to locations.
Shown as byte |
iboss.bandwidth.location.total_packets
(gauge) | Total number of packets transmitted for locations.
Shown as packet |
iboss.bandwidth.location.total_upstream_bytes
(gauge) | Total number of upstream bytes from locations.
Shown as byte |
iboss.bandwidth.protocol.total_bytes
(gauge) | Total number of bytes consumed by protocols.
Shown as byte |
iboss.bandwidth.protocol.total_connections
(gauge) | Total number of connections for protocols.
Shown as connection |
iboss.bandwidth.protocol.total_downstream_bytes
(gauge) | Total number of downstream bytes to protocols.
Shown as byte |
iboss.bandwidth.protocol.total_packets
(gauge) | Total number of packets transmitted for protocols.
Shown as packet |
iboss.bandwidth.protocol.total_upstream_bytes
(gauge) | Total number of upstream bytes from protocols.
Shown as byte |
iboss.bandwidth.users.total_bytes
(gauge) | Total number of bytes consumed by users.
Shown as byte |
iboss.bandwidth.users.total_connections
(gauge) | Total number of connections for users.
Shown as connection |
iboss.bandwidth.users.total_downstream_bytes
(gauge) | Total number of downstream bytes to users.
Shown as byte |
iboss.bandwidth.users.total_packets
(gauge) | Total number of packets transmitted for users.
Shown as packet |
iboss.bandwidth.users.total_upstream_bytes
(gauge) | Total number of upstream bytes from users.
Shown as byte |
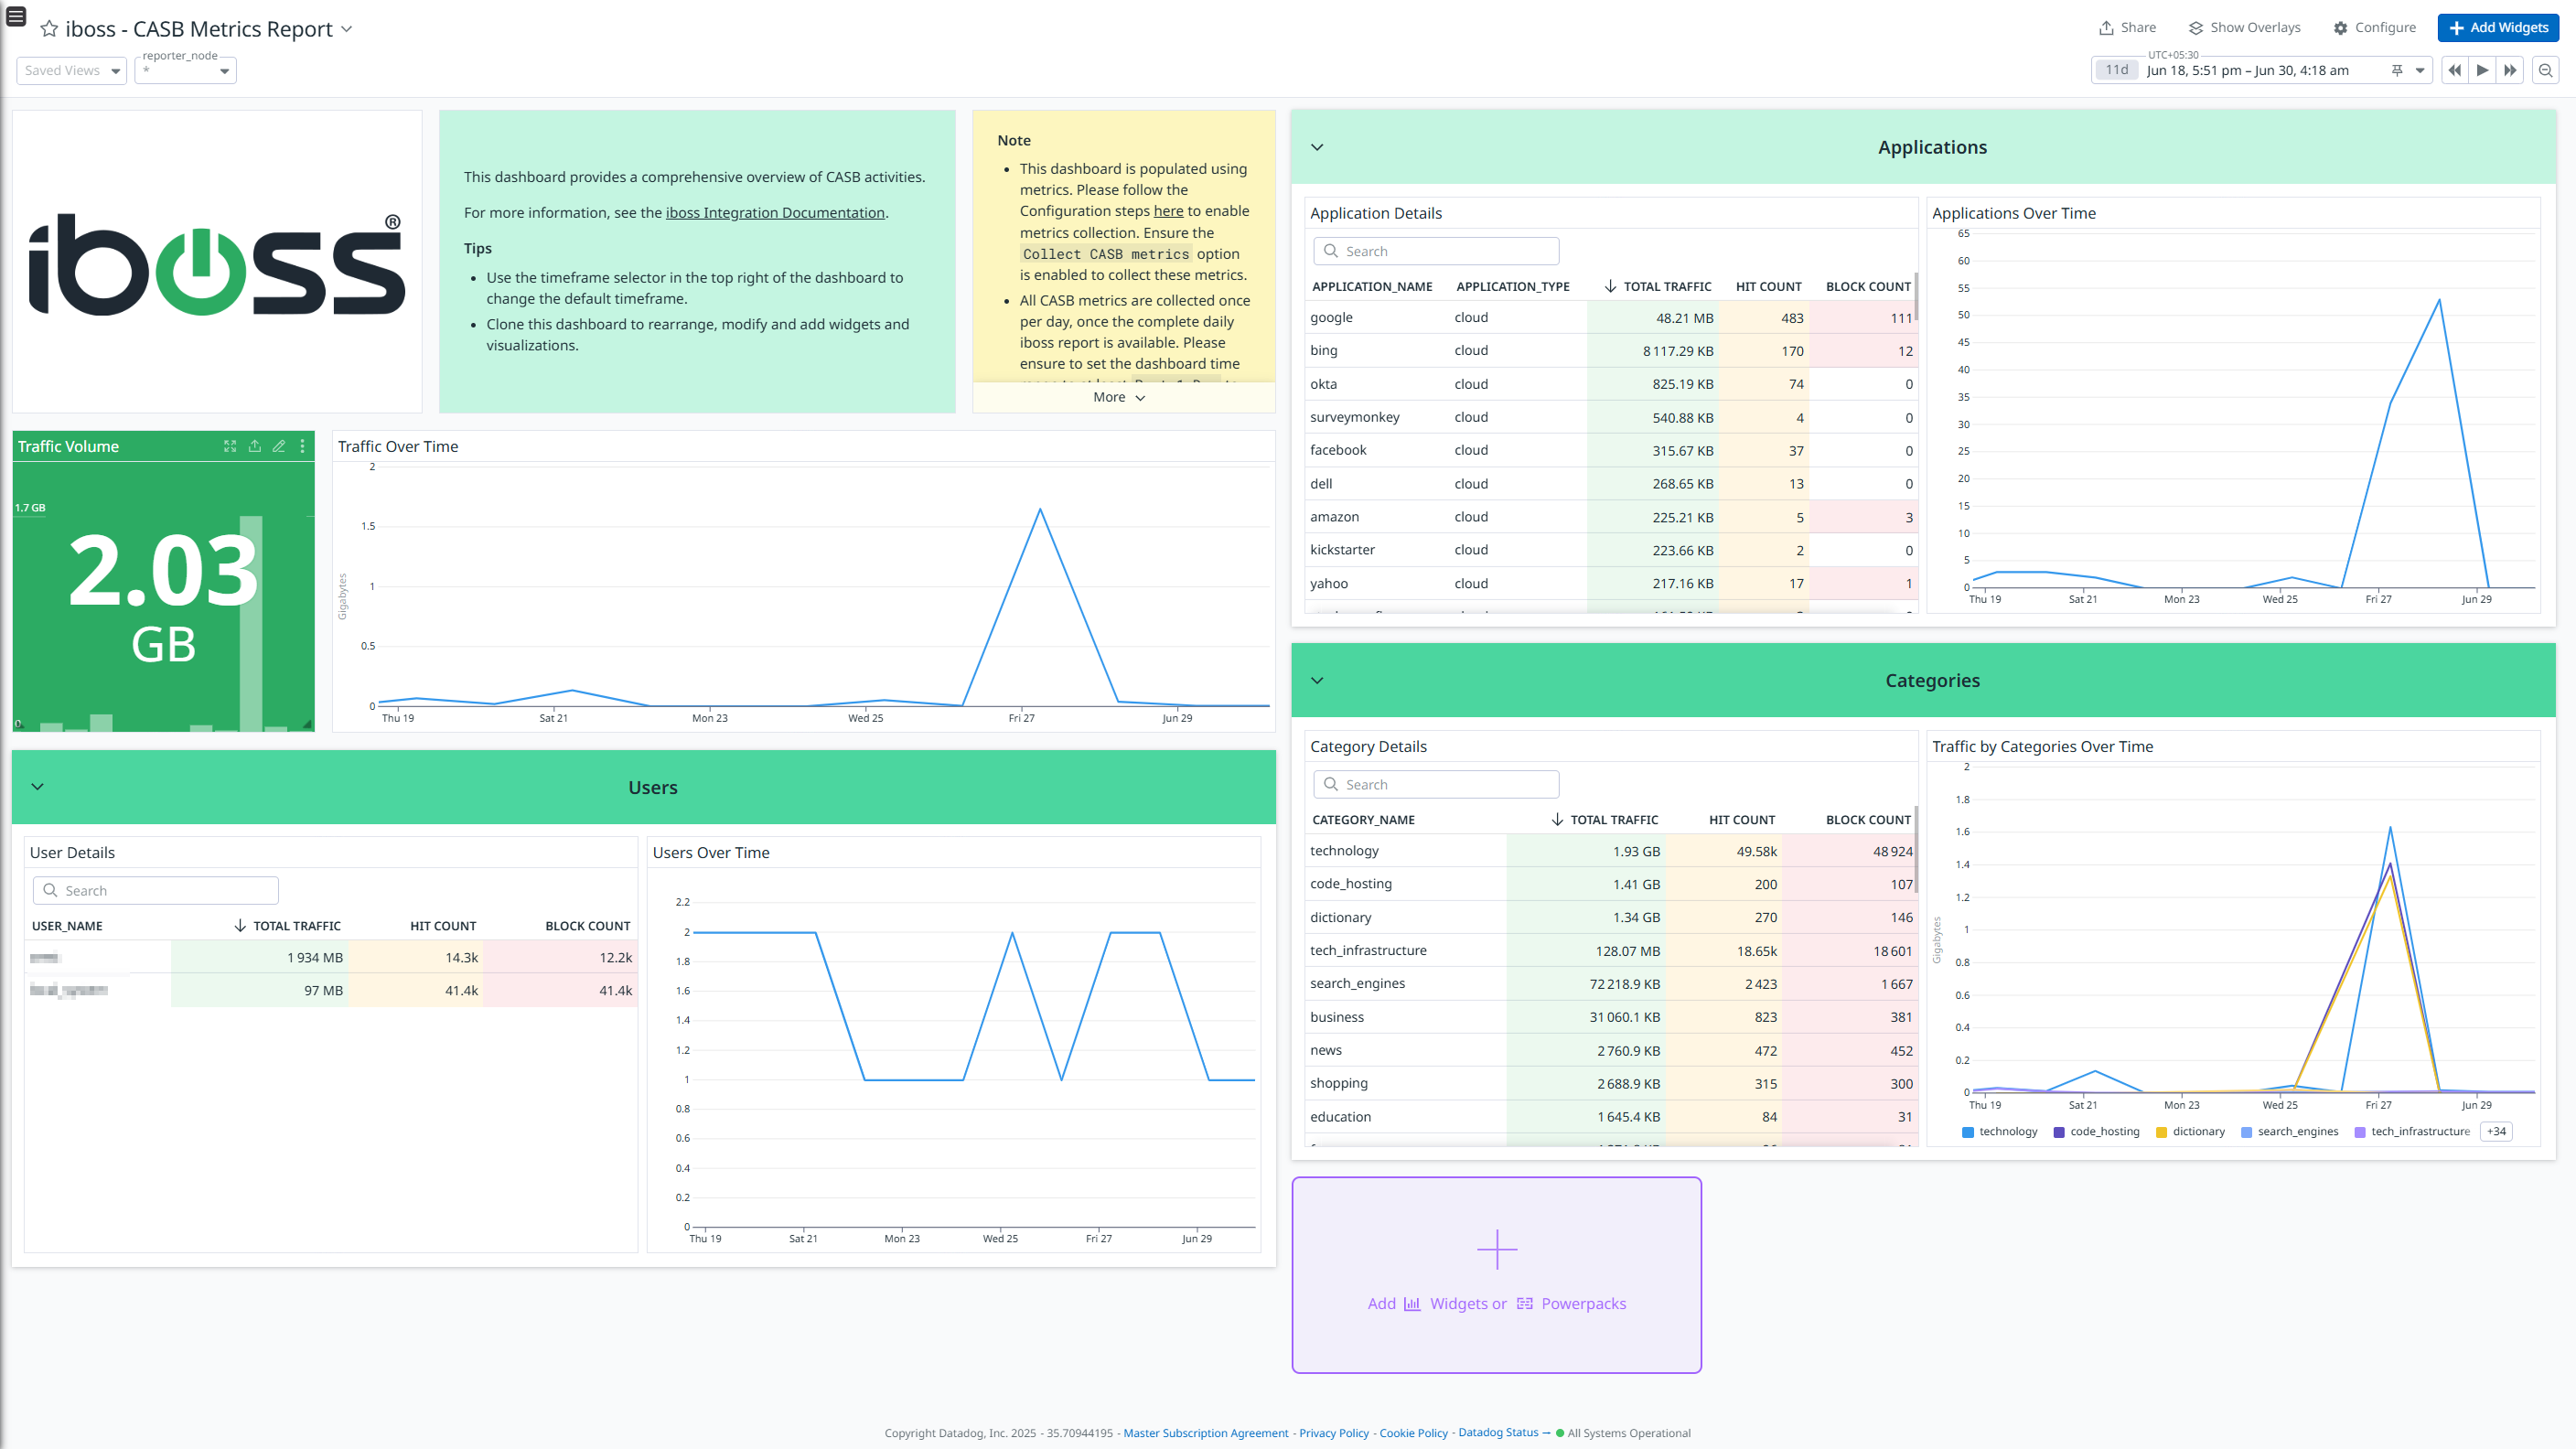
iboss.casb.app_count
(gauge) | Total number of applications monitored. |
iboss.casb.application.block_count
(gauge) | Total number of blocks per application. |
iboss.casb.application.hit_count
(gauge) | Total number of hits per application. |
iboss.casb.application.traffic
(gauge) | Traffic volume per application.
Shown as byte |
iboss.casb.category.block_count
(gauge) | Total number of blocks by category. |
iboss.casb.category.hit_count
(gauge) | Total number of hits by category. |
iboss.casb.category.traffic
(gauge) | Traffic volume by category.
Shown as byte |
iboss.casb.traffic
(gauge) | Traffic volume analyzed.
Shown as byte |
iboss.casb.users
(gauge) | Total number of users monitored. |
iboss.casb.users.block_count
(gauge) | Total number of blocks per user. |
iboss.casb.users.hit_count
(gauge) | Total number of hits per user. |
iboss.casb.users.traffic
(gauge) | Traffic volume per user.
Shown as byte |
iboss.digital_experience.assets.client_peer_time_avg
(gauge) | Average client response time per asset.
Shown as millisecond |
iboss.digital_experience.assets.proxy_dns_time_avg
(gauge) | Average DNS resolution time per asset.
Shown as millisecond |
iboss.digital_experience.assets.server_peer_time_avg
(gauge) | Average server response time per asset.
Shown as millisecond |
iboss.digital_experience.client_peer_time_avg
(gauge) | Average client response time.
Shown as millisecond |
iboss.digital_experience.countries.client_peer_time_avg
(gauge) | Average client response time per country.
Shown as millisecond |
iboss.digital_experience.countries.proxy_dns_time_avg
(gauge) | Average DNS resolution time per country.
Shown as millisecond |
iboss.digital_experience.countries.server_peer_time_avg
(gauge) | Average server response time per country.
Shown as millisecond |
iboss.digital_experience.proxy_dns_time_avg
(gauge) | Average DNS resolution time.
Shown as millisecond |
iboss.digital_experience.resources.client_peer_time_avg
(gauge) | Average client response time per resource.
Shown as millisecond |
iboss.digital_experience.resources.proxy_dns_time_avg
(gauge) | Average DNS resolution time per resource.
Shown as millisecond |
iboss.digital_experience.resources.server_peer_time_avg
(gauge) | Average server response time per resource.
Shown as millisecond |
iboss.digital_experience.server_peer_time_avg
(gauge) | Average server response time.
Shown as millisecond |
iboss.digital_experience.users.client_peer_time_avg
(gauge) | Average client response time per user.
Shown as millisecond |
iboss.digital_experience.users.proxy_dns_time_avg
(gauge) | Average DNS resolution time per user.
Shown as millisecond |
iboss.digital_experience.users.server_peer_time_avg
(gauge) | Average server response time per user.
Shown as millisecond |
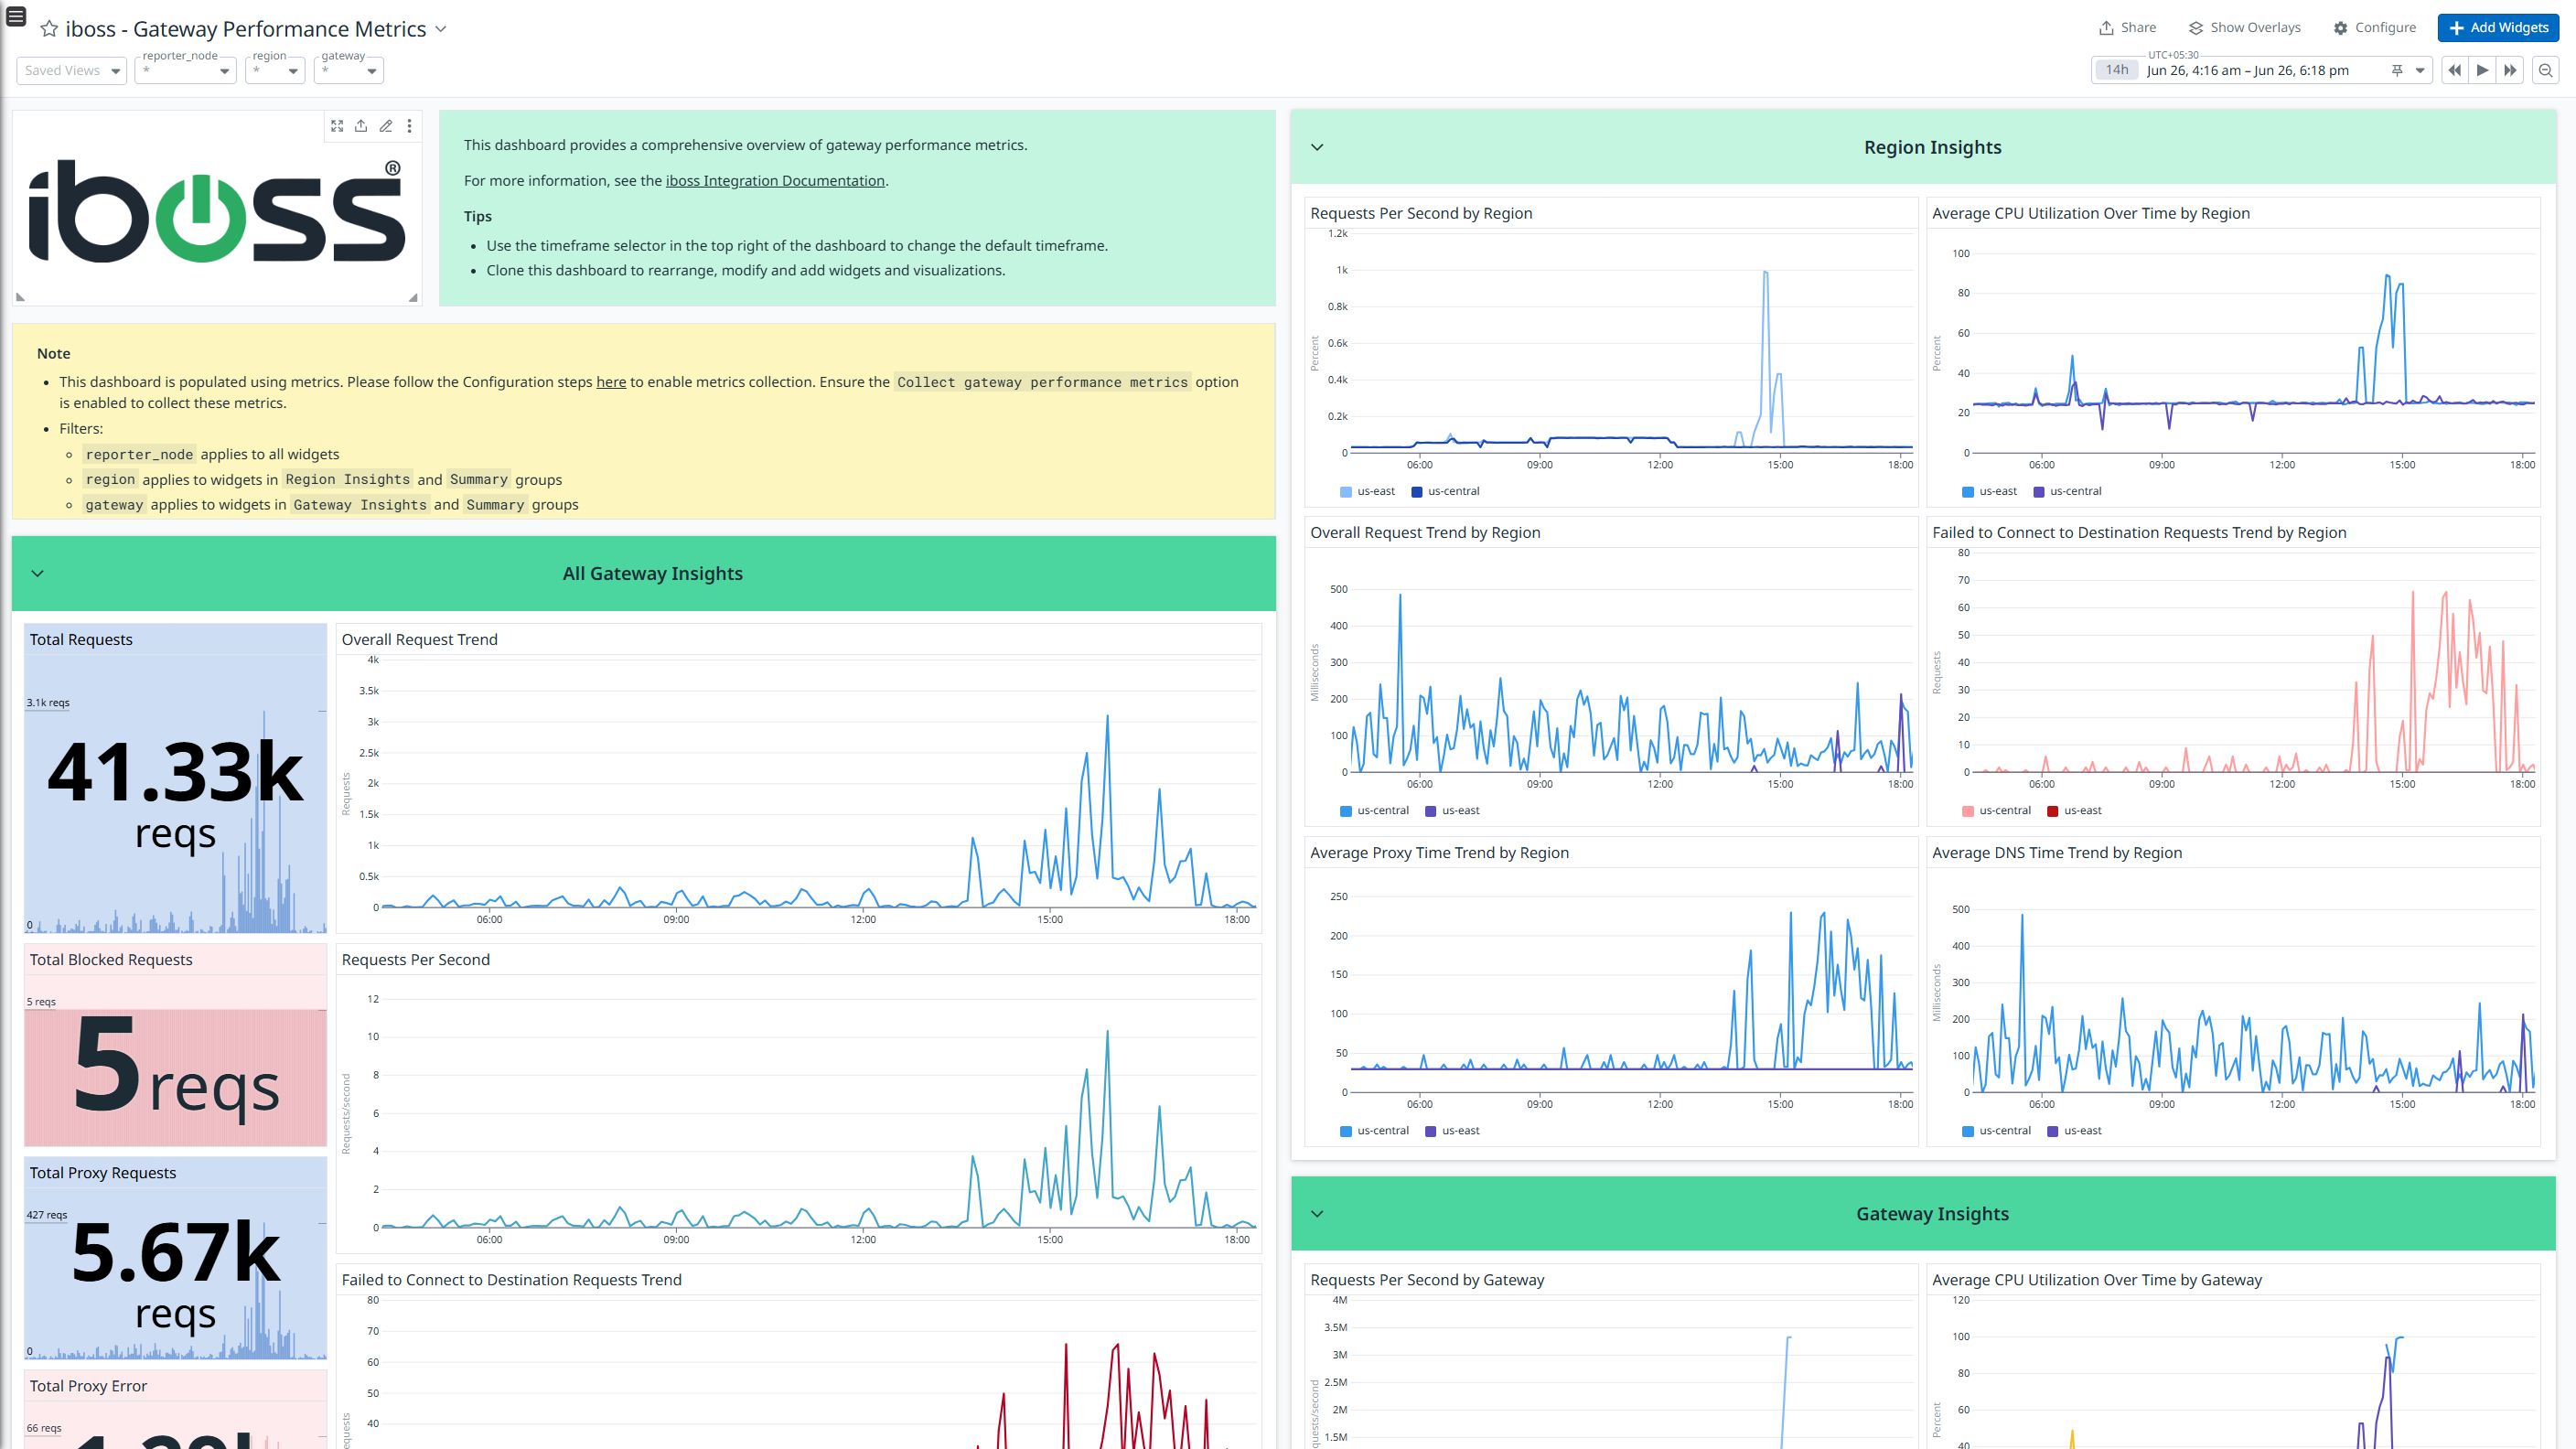
iboss.gateway_performance.cpu_utilization
(gauge) | CPU utilization percentage.
Shown as percent |
iboss.gateway_performance.dns_time_average
(gauge) | Average time for DNS resolution.
Shown as second |
iboss.gateway_performance.proxy_error_count
(gauge) | Total number of proxy errors.
Shown as request |
iboss.gateway_performance.proxy_time_average
(gauge) | Average time for proxy request processing.
Shown as second |
iboss.gateway_performance.total_block_count
(gauge) | Total number of requests blocked by the gateway.
Shown as request |
iboss.gateway_performance.total_proxy_request_count
(gauge) | Total number of proxy requests.
Shown as request |
iboss.gateway_performance.total_request_count
(gauge) | Total number of requests processed by the gateway.
Shown as request |
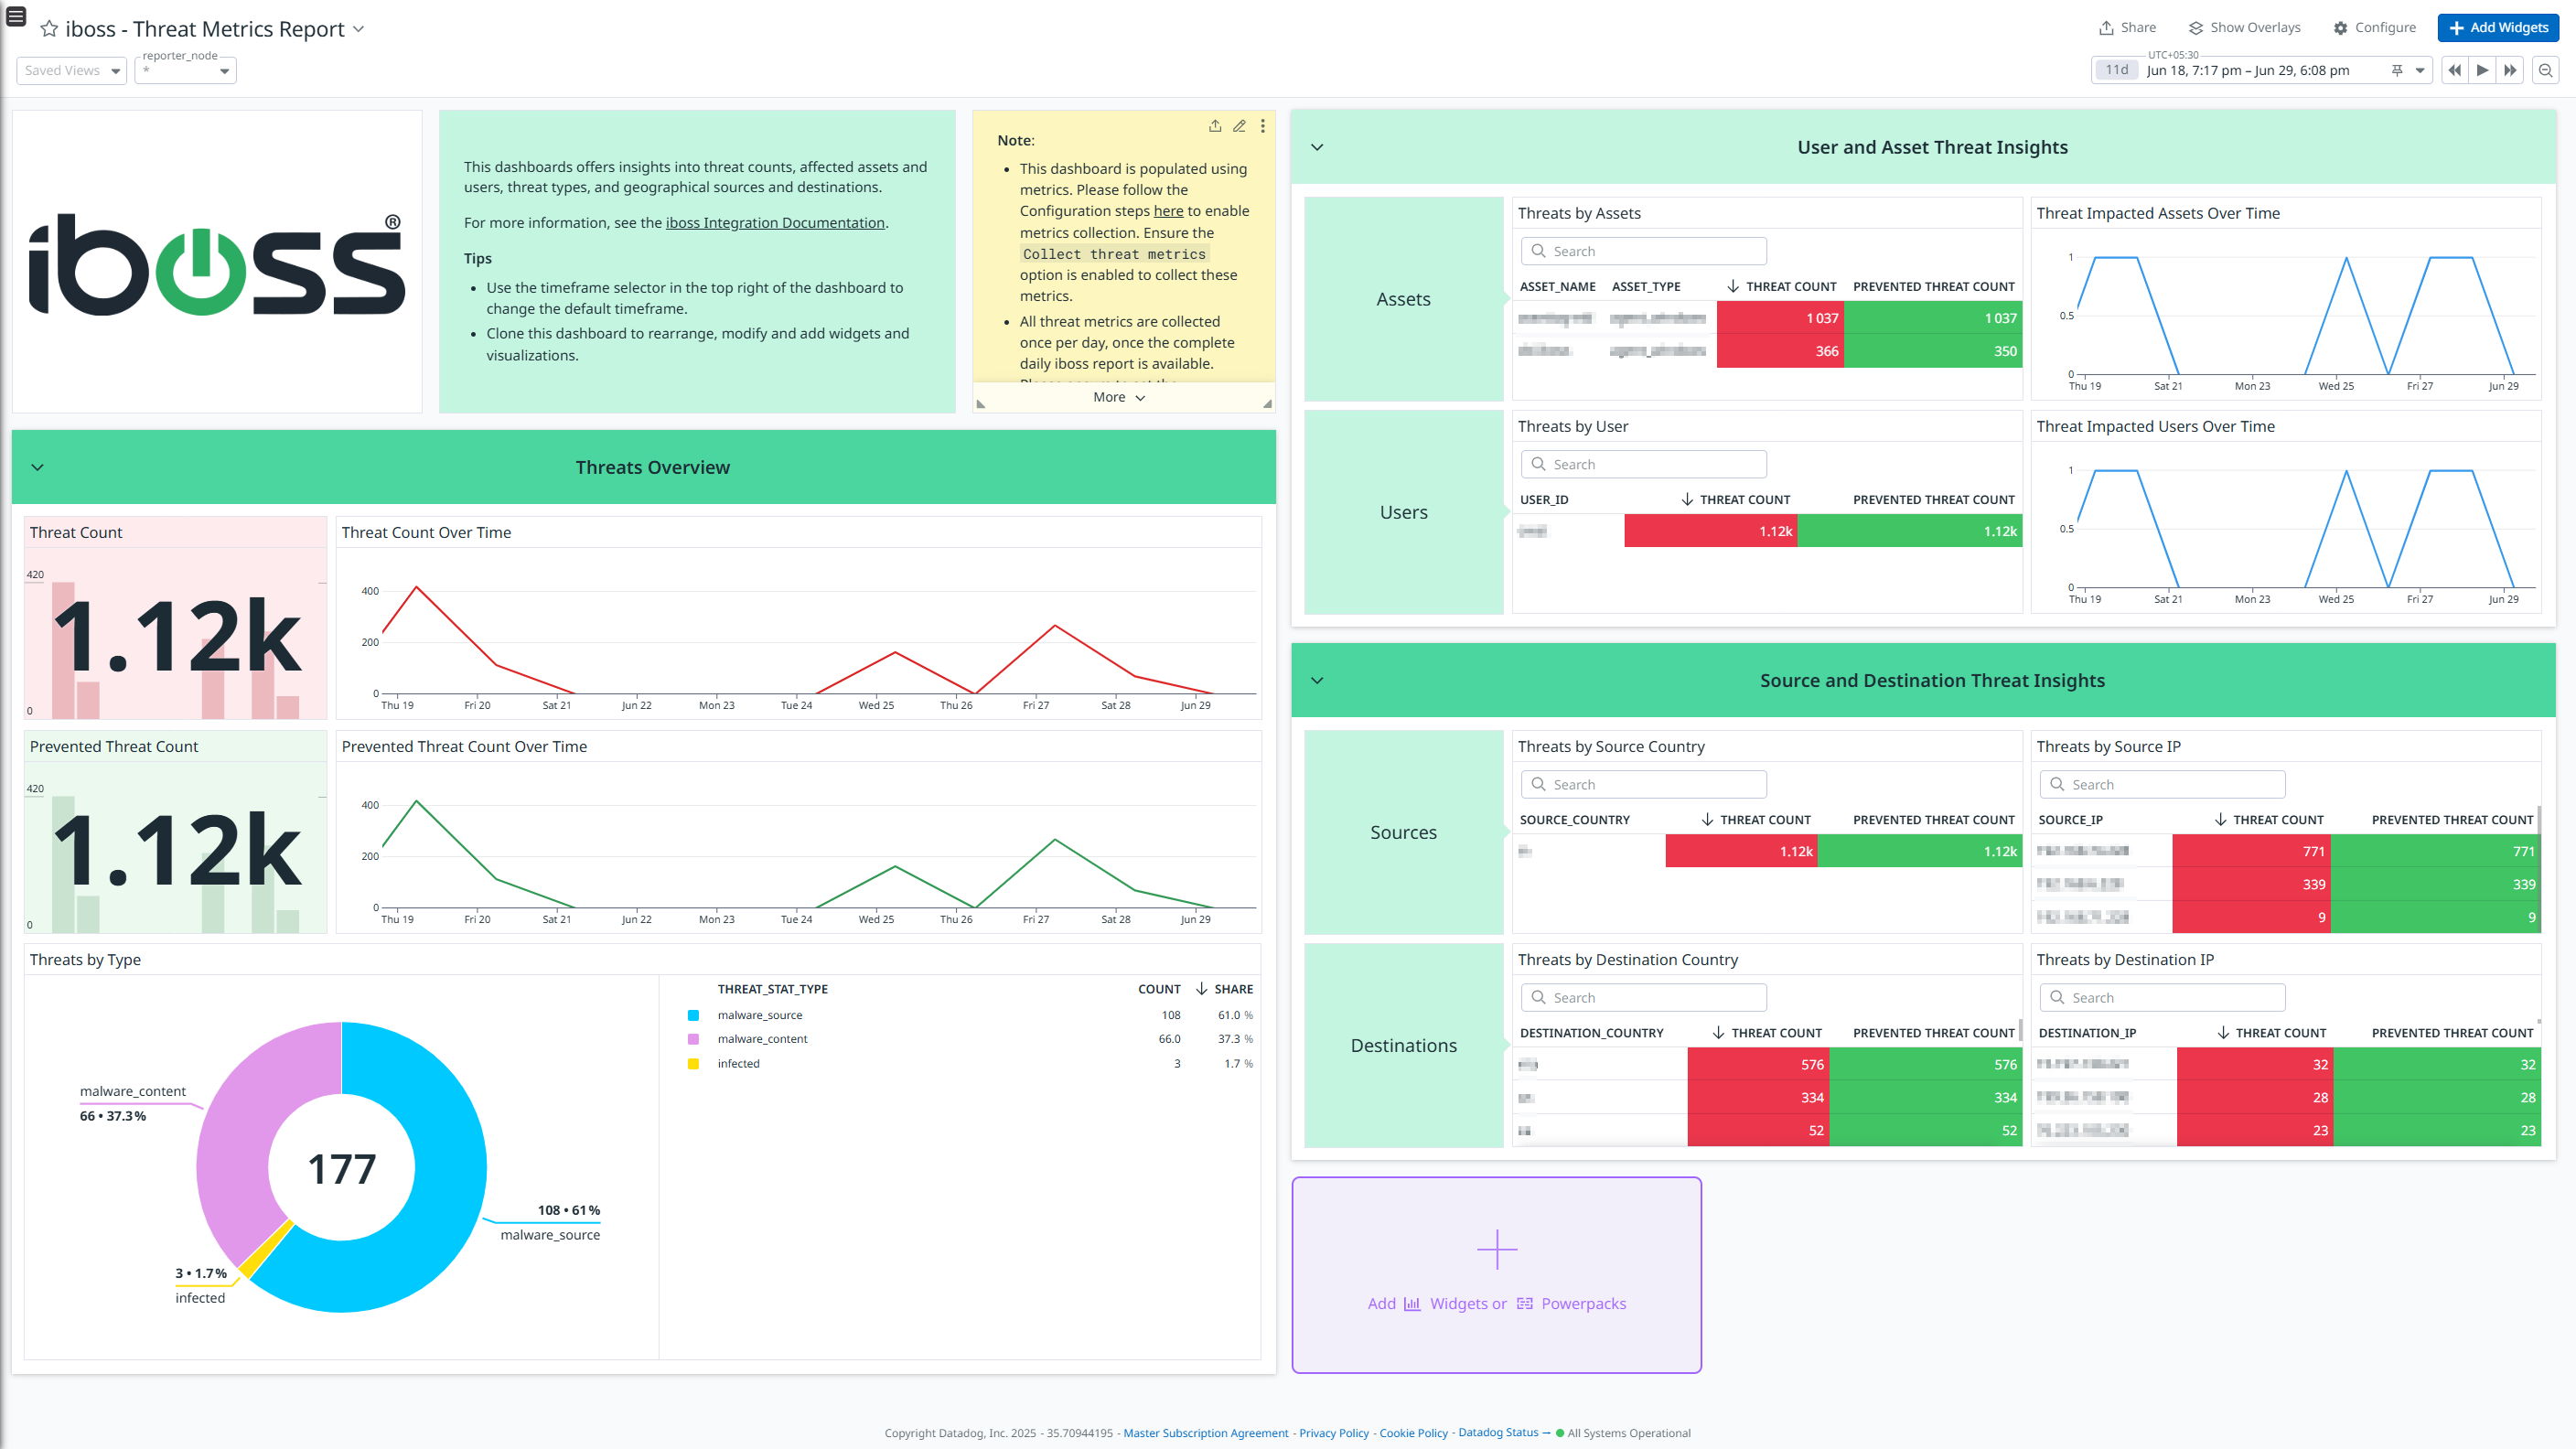
iboss.threat.asset.prevented_threat_count
(gauge) | Total number of prevented threats per asset. |
iboss.threat.asset.threat_count
(gauge) | Total number of threats per asset. |
iboss.threat.destination_country.prevented_threat_count
(gauge) | Total number of prevented threats by destination country. |
iboss.threat.destination_country.threat_count
(gauge) | Total number of threats by destination country. |
iboss.threat.destination_ip.prevented_threat_count
(gauge) | Total number of prevented threats by destination IP. |
iboss.threat.destination_ip.threat_count
(gauge) | Total number of threats by destination IP. |
iboss.threat.source_country.prevented_threat_count
(gauge) | Total number of prevented threats by source country. |
iboss.threat.source_country.threat_count
(gauge) | Total number of threats by source country. |
iboss.threat.source_ip.prevented_threat_count
(gauge) | Total number of prevented threats by source IP. |
iboss.threat.source_ip.threat_count
(gauge) | Total number of threats by source IP. |
iboss.threat.total_assets_with_threats
(gauge) | Total number of assets affected by threats. |
iboss.threat.total_prevented_threat_count
(gauge) | Total number of prevented threats. |
iboss.threat.total_threat_count
(gauge) | Total number of detected threats. |
iboss.threat.total_users_with_threats
(gauge) | Total number of users impacted by threats. |
iboss.threat.types.prevented_threat_count
(gauge) | Total number of prevented threats. |
iboss.threat.types.threat_count
(gauge) | Total number of threats. |
iboss.threat.user.prevented_threat_count
(gauge) | Total number of prevented threats per user. |
iboss.threat.user.threat_count
(gauge) | Total number of threats per user. |
iboss.web.categories.blocks
(gauge) | Total number of blocks on categorized content. |
iboss.web.categories.hits
(gauge) | Total number of hits on categorized content. |
iboss.web.domain.total_block_count
(gauge) | Total number of domains blocked. |
iboss.web.domain.total_hit_count
(gauge) | Total number of hits to domains. |
iboss.web.domain.total_malware_count
(gauge) | Total number of malware incidents on domains. |
iboss.web.domain.total_sandbox_count
(gauge) | Total number of domains sandboxed. |
iboss.web.search_trends.filter_avoidance.hits
(gauge) | Total number of hits on filter-avoidance terms. |
iboss.web.search_trends.liability.hits
(gauge) | Total number of hits on liability-risk terms. |
iboss.web.search_trends.suspicious.hits
(gauge) | Total number of hits on suspicious search terms. |
iboss.web.search_trends.trending_search_terms.hits
(gauge) | Total number of hits on trending search terms. |
iboss.web.user.total_block_count
(gauge) | Total number of blocks per user. |
iboss.web.user.total_hit_count
(gauge) | Total number of hits per user. |
iboss.web.user.total_malware_count
(gauge) | Total number of malware incidents per user. |
iboss.web.user.usetime
(gauge) | User activity time.
Shown as millisecond |
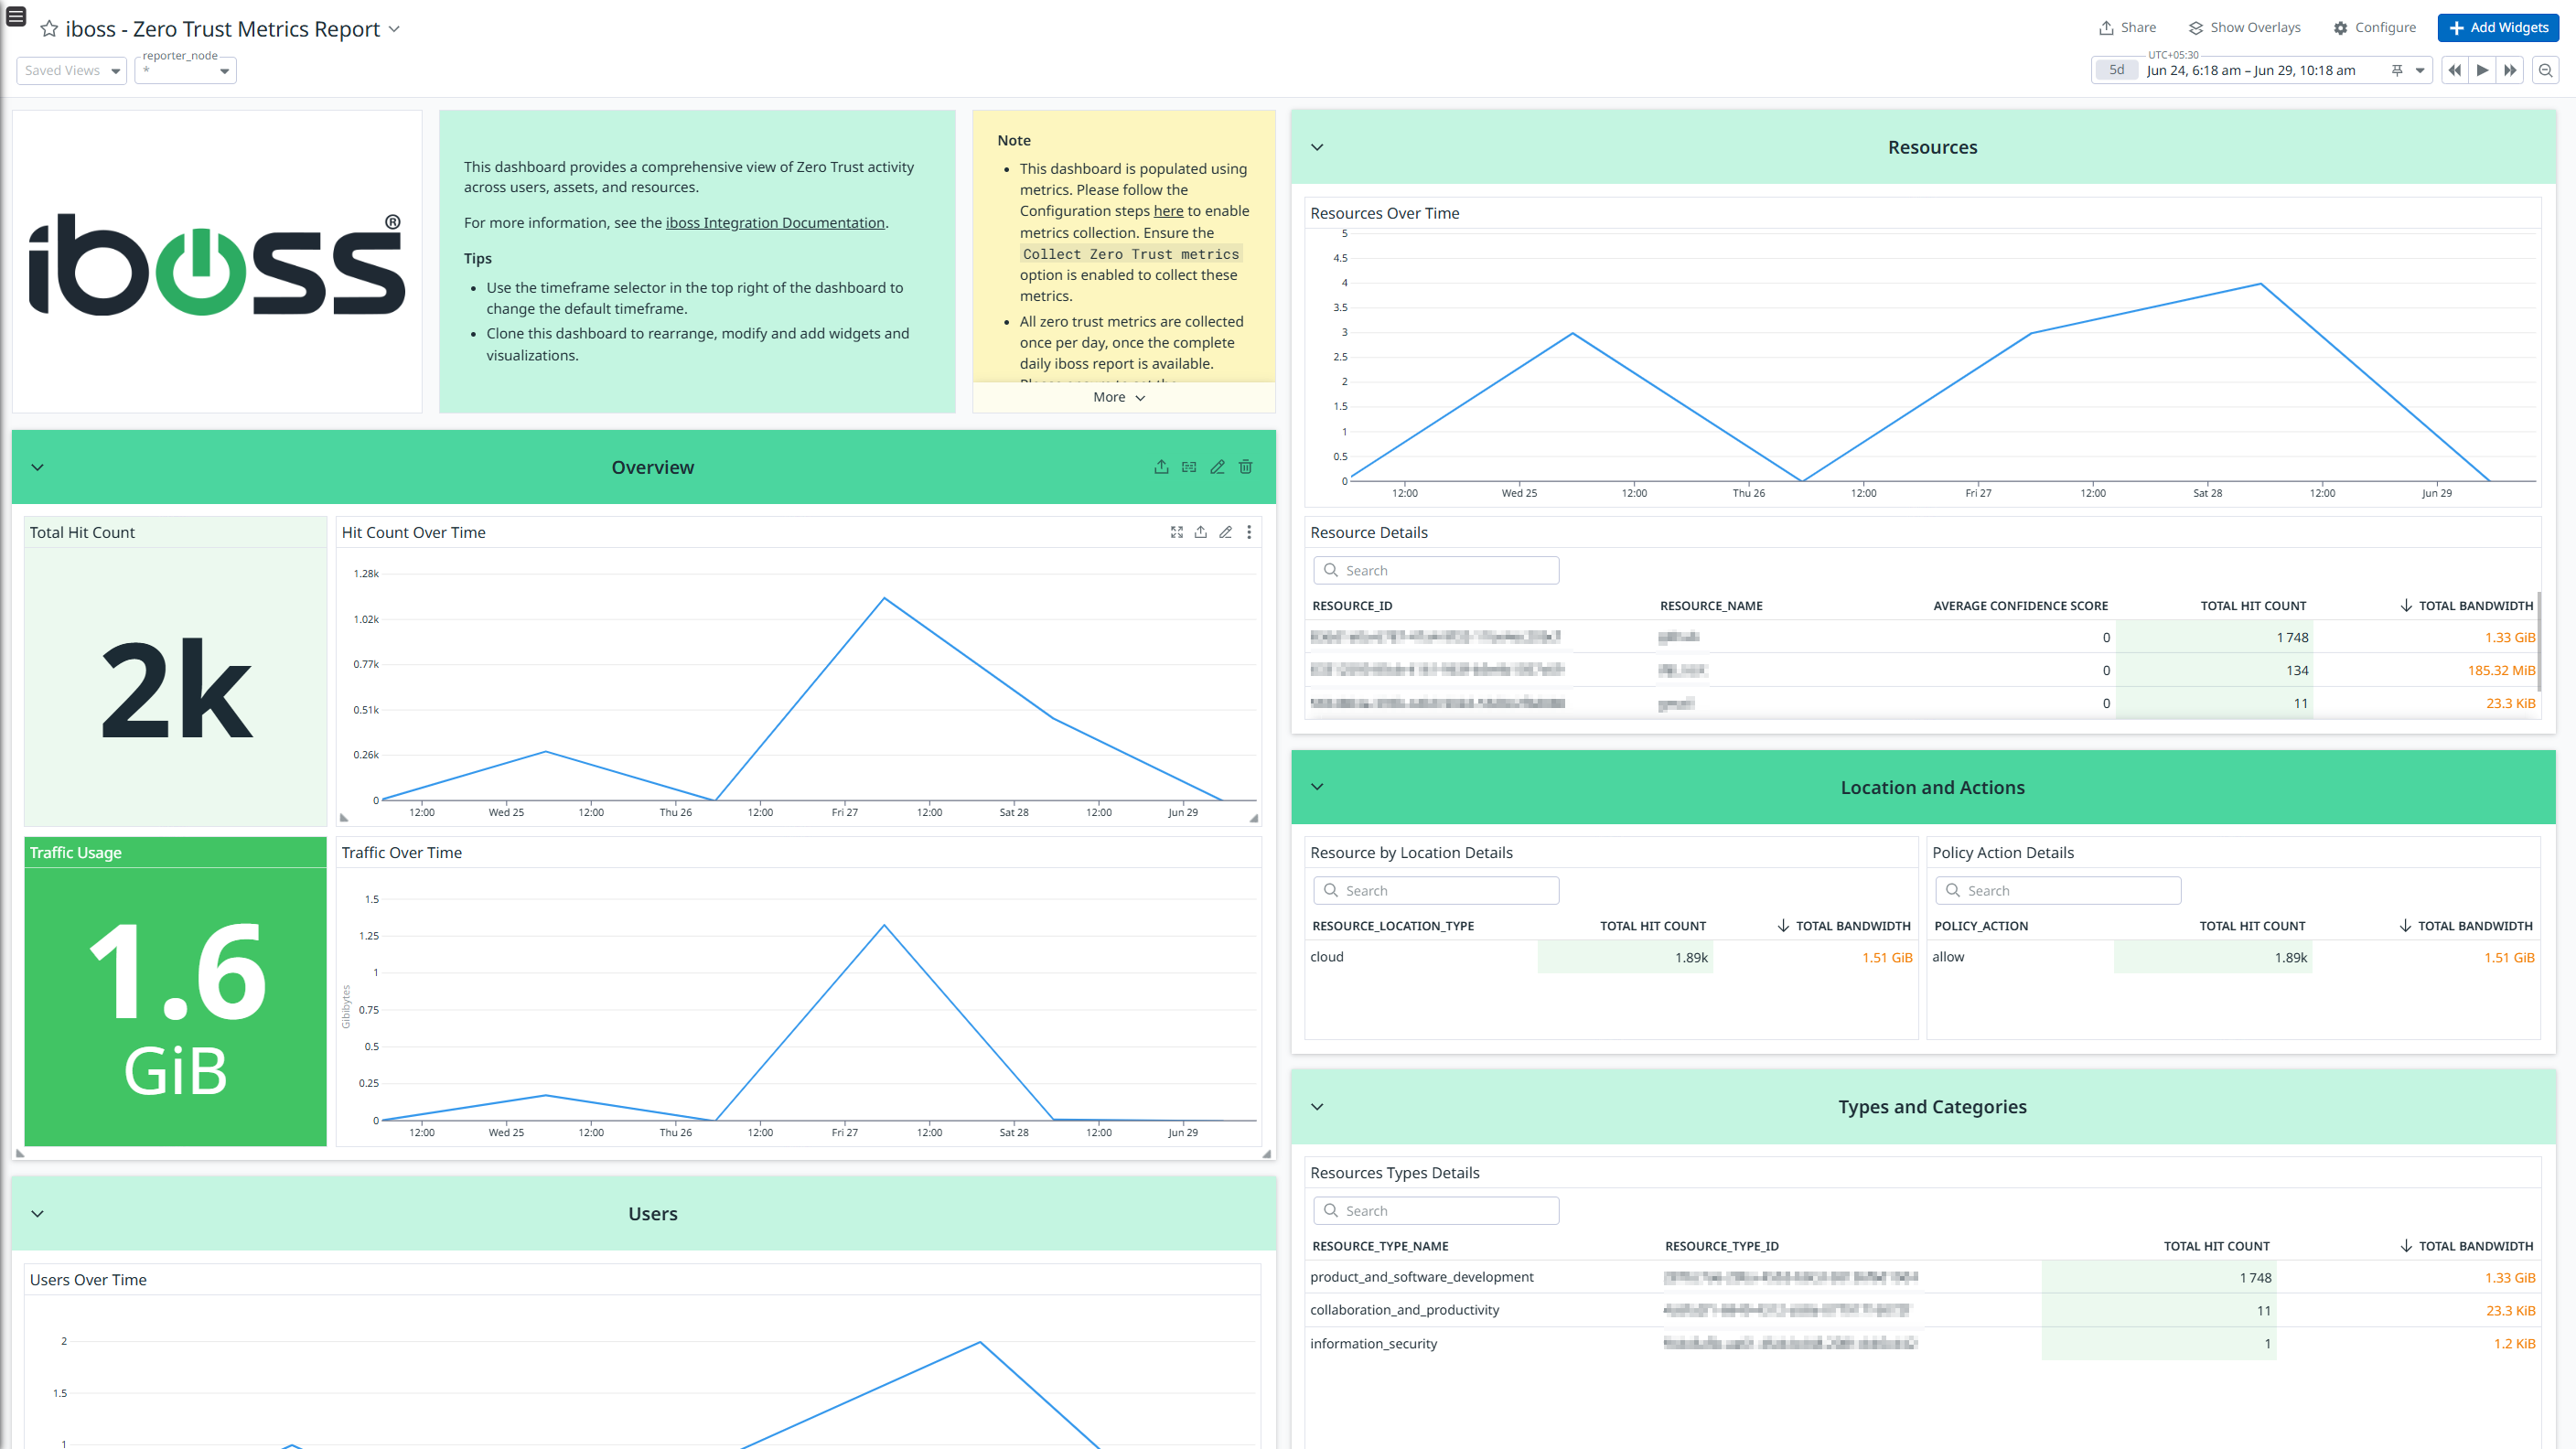
iboss.zero_trust.asset.average_confidence_score
(gauge) | Average confidence score for assets. |
iboss.zero_trust.asset.traffic
(gauge) | Traffic volume per asset.
Shown as byte |
iboss.zero_trust.asset.transactions
(gauge) | Total number of transactions per asset. |
iboss.zero_trust.policy_action.traffic
(gauge) | Traffic volume per policy action.
Shown as byte |
iboss.zero_trust.policy_action.transactions
(gauge) | Total number of transactions per policy action. |
iboss.zero_trust.resource.average_confidence_score
(gauge) | Average confidence score for resources. |
iboss.zero_trust.resource.traffic
(gauge) | Traffic volume per resource.
Shown as byte |
iboss.zero_trust.resource.transactions
(gauge) | Total number of transactions per resource. |
iboss.zero_trust.resource_category.traffic
(gauge) | Traffic volume per resource category.
Shown as byte |
iboss.zero_trust.resource_category.transactions
(gauge) | Total number of transactions per resource category. |
iboss.zero_trust.resource_location.traffic
(gauge) | Traffic volume per resource location.
Shown as byte |
iboss.zero_trust.resource_location.transactions
(gauge) | Total number of transactions per resource location. |
iboss.zero_trust.resource_type.traffic
(gauge) | Traffic volume per resource type.
Shown as byte |
iboss.zero_trust.resource_type.transactions
(gauge) | Total number of transactions per resource type. |
iboss.zero_trust.total_asset_count
(gauge) | Total number of assets monitored. |
iboss.zero_trust.total_resource_count
(gauge) | Total number of resources monitored. |
iboss.zero_trust.total_user_count
(gauge) | Total number of users monitored. |
iboss.zero_trust.traffic
(gauge) | Traffic volume analyzed.
Shown as byte |
iboss.zero_trust.transactions
(gauge) | Total number of transactions processed. |
iboss.zero_trust.user.average_confidence_score
(gauge) | Average confidence score for users. |
iboss.zero_trust.user.traffic
(gauge) | Traffic volume per user.
Shown as byte |
iboss.zero_trust.user.transactions
(gauge) | Total number of transactions per user. |