Amazon RDS

RDS Dashboard

Présentation

Amazon Relational Database Service (RDS) est un service Web qui facilite la configuration, l’exploitation et la mise à l’échelle d’une base de données relationnelle dans le cloud. Activez cette intégration pour visualiser toutes vos métriques RDS dans Datadog.

Remarque : vérifiez que la variable d’environnement DD_SITE est définie sur votre région en dehors du code, , ou définissez la variable dans le code comme suit :

DD_SITE = os.getenv("DD_SITE", default="")

Vous pouvez surveiller les instances RDS avec les intégrations standard, améliorée et native. Consultez la liste complète des métriques avant de choisir une configuration. En effet, chaque métrique correspond à une configuration précise. Passez également en revue les informations ci-dessous pour en savoir plus sur les exigences de chaque configuration ainsi que sur le dashboard par défaut :

Pour installer l’intégration standard, vous devez activer RDS dans l’onglet Metric Collection de la page de l’intégration AWS. Vous pourrez ainsi recevoir des métriques relatives à votre instance aussi souvent que votre intégration CloudWatch le permet. Tous les types de moteurs RDS sont pris en charge.

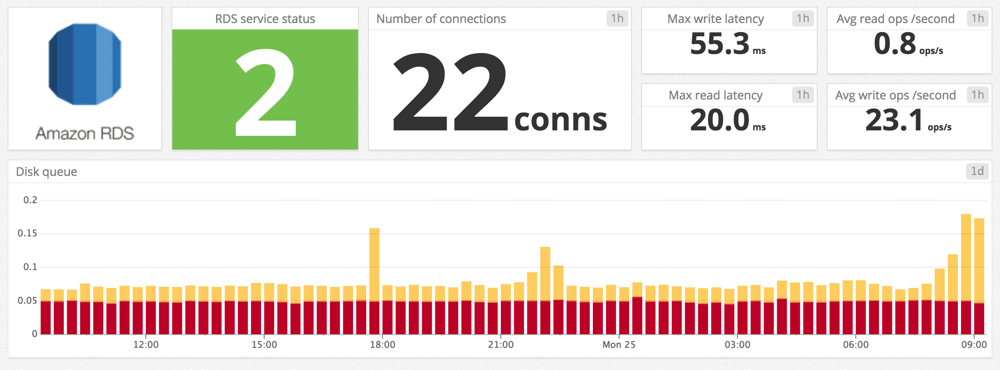
Le dashboard par défaut pour cette intégration rassemble des informations sur les connexions, le décalage de réplication, la latence et les opérations de lecture, l’ordinateur, la RAM, la latence et les opérations d’écriture ainsi que le disque.

L’intégration améliorée nécessite une configuration supplémentaire et est seulement disponible pour les moteurs MySQL, Aurora, MariaDB, SQL Server, Oracle et PostgreSQL. Des métriques supplémentaires sont disponibles, mais vous devez disposer d’un AWS Lambda pour envoyer les métriques à Datadog. Une granularité plus élevée et des services requis complémentaires peuvent engendrer une hausse des frais AWS.

Le dashboard par défaut pour cette intégration rassemble des informations sur les chargements, la disponibilité, l’utilisation du CPU, les tâches, la mémoire, le swap, les réceptions réseau, les transmissions réseau, le CPU utilisé par processus, la mémoire utilisée par processus, les opérations de disque, le système de fichiers utilisé (pourcentage), les tâches en cours d’exécution et l’utilisation du CPU système.

L’intégration native des bases de données est facultative et disponible pour les moteurs MySQL, Aurora, MariaDB, SQL Server et PostgreSQL. Pour faire correspondre les métriques de RDS et celles de l’intégration native, utilisez le tag dbinstanceidentifier de l’intégration native basé sur l’identificateur que vous attribuez à l’instance RDS. Le tag est automatiquement attribué aux instances RDS.

Il existe trois dashboards par défaut pour cette configuration : MySQL, Aurora et PostgreSql. Chacun d’entre eux inclut des informations sur le volume de requête, l’E/S du disque, les connexions, la réplication et les ressources AWS.

Remarque : ces dashboards affichent des métriques provenant à la fois d’AWS CloudWatch et du moteur de la base de données. Activez l’une des intégrations MySQL, Aurora ou PostgreSQL pour obtenir toutes les métriques des intégrations.

Implémentation

Installation

Pour l’intégration RDS standard, commencez par configurer l’intégration Amazon Web Services.

Activez la surveillance améliorée de votre instance RDS. Vous pouvez activer cette fonctionnalité lors de la création de l’instance ou ultérieurement, en sélectionnant Modify dans Instance Actions. Il est conseillé de choisir une granularité de surveillance de 15 secondes.

Les instructions suivantes reposent sur l’utilisation de KMS et de la console de gestion Lambda pour créer une version chiffrée de votre clé d’API Datadog. Cette dernière peut uniquement être utilisée avec la fonction Lambda de surveillance améliorée de RDS. Si vous disposez déjà d’une clé d’API chiffrée provenant d’un autre Lambda, tel que le Forwarder de logs, consultez le fichier README de la fonction Lambda pour obtenir des options supplémentaires.

Créer votre clé KMS

  1. Ouvrez la page d’accueil de KMS à l’adresse https://console.aws.amazon.com/kms/home.
  2. Accédez à Customer managed keys.
  3. Sélectionnez Create Key.
  4. Saisissez un alias pour la clé, par exemple lambda-datadog-key. Remarque : un alias ne peut pas commencer par « aws ». Les alias commençant par « aws » sont réservés par Amazon Web Services et représentent les clés CMK gérées par AWS dans votre compte.
  5. Ajoutez les administrateurs appropriés afin de déterminer les personnes pouvant gérer cette clé.
  6. Vous n’avez pas besoin d’ajouter le moindre rôle.
  7. Enregistrez votre clé KMS.

Créer votre fonction Lambda

  1. Depuis la console de gestion Lambda, créez une fonction Lambda. Votre fonction Lambda doit se trouver dans la même région que celle de la clé KMS que vous avez créée.
  2. Choisissez Serverless Application Repository, recherchez Datadog-RDS-Enhanced et sélectionnez cette option.
  3. Saisissez un nom unique pour l’application.
  4. Collez l’identifiant de la clé créée dans le paramètre KMSKeyId de la section précédente et effectuez le déploiement.
  5. Une fois l’application déployée, ouvrez la fonction Lambda créée (cliquez sur la fonction dans « Resource »).
  6. Cliquez sur l’onglet Configuration et accédez à la section Environment variables. Pour la variable d’environnement kmsEncryptedKeys, ajoutez votre clé d’API Datadog au format JSON complet dans le champ value comme suit : {"api_key":"<VOTRE_CLÉ_API>"}.
  7. Ouvrez la section Encryption configuration et sélectionnez Enable helpers for encryption in transit.
  8. Dans la section KMS key to encrypt at rest, sélectionnez Use a customer master key et saisissez la clé KMS que vous avez précédemment créée.
  9. Appuyez sur le bouton Encrypt à côté de l’objet blob JSON que vous venez de saisir, puis, dans la fenêtre qui s’affiche, choisissez également le nom de la clé KMS que vous avez précédemment créée.
  10. Cliquez sur Save.
  11. Créez un nouveau déclencheur en définissant le groupe de logs CloudWatch RDSOSMetrics en tant que source.
  12. Nommez le filtre, indiquez un pattern de filtre facultatif, puis cliquez sur Save.

Lorsque vous cliquez sur le bouton de test de votre fonction Lambda, il se peut que cette erreur s’affiche :

{
    "stackTrace": [
        [
            "/var/task/lambda_function.py",
            109,
            "lambda_handler",
            "event = json.loads(gzip.GzipFile(fileobj=StringIO(event['awslogs']['data'].decode('base64'))).read())"
        ]
    ],
    "errorType": "KeyError",
    "errorMessage": "'awslogs'"
}

Vous pouvez l’ignorer. Le bouton de test ne fonctionne pas avec cette configuration.

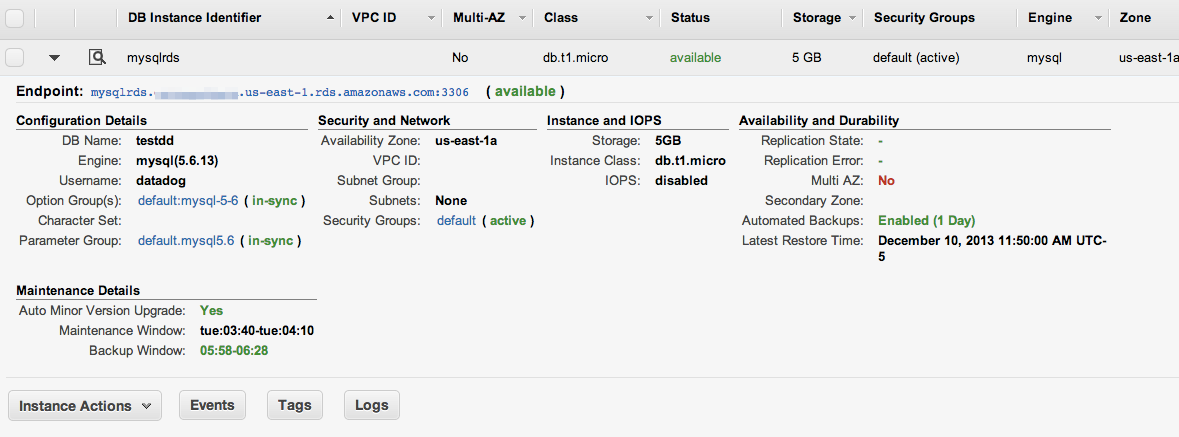
  1. Accédez à la console AWS et ouvrez la section RDS pour trouver l’instance que vous souhaitez surveiller.
Console RDS
  1. Relevez l’URL de l’endpoint, par exemple mysqlrds.blah.us-east1.rds.amazonaws.com:3306, qui est utilisée pour configurer l’Agent. Notez également le paramètre DB Instance identifier, par exemple mysqlrds, qui est utilisé pour créer des graphiques et des dashboards.

Configuration

  1. Sur la page de l’intégration AWS, vérifiez que RDS est activé dans l’onglet Metric Collection.

  2. Ajoutez les autorisations suivantes à votre stratégie IAM Datadog afin de recueillir des métriques Amazon RDS. Pour en savoir plus, consultez la section relative aux stratégies RDS (en anglais) de la documentation AWS.

    Autorisation AWSDescription
    rds:DescribeDBInstancesDécrit les instances RDS auxquelles ajouter des tags.
    rds:ListTagsForResourceAjoute des tags personnalisés aux instances RDS.
    rds:DescribeEventsAjoute des événements associés aux bases de données RDS.
  3. Installez l’intégration Datadog/Amazon RDS.

Configurez un Agent et connectez-vous à votre instance RDS en modifiant le fichier YAML approprié dans votre répertoire conf.d, puis redémarrez votre Agent :

Pour RDS Aurora, modifiez le fichier YAML de la base de données que vous utilisez.

Si vous utilisez MySQL ou MariaDB, modifiez mysql.yaml :

init_config:

instances:
    # L'URL d'endpoint de la console AWS
    - server: 'mysqlrds.blah.us-east-1.rds.amazonaws.com'
      user: '<NOM_UTILISATEUR>'
      pass: '<MOT_DE_PASSE>'
      port: 3306
      tags:
          - 'dbinstanceidentifier:<NOM_INSTANCE>'

Si vous utilisez PostgreSQL, modifiez postgres.yaml :

init_config:

instances:
    - host: 'postgresqlrds.blah.us-east-1.rds.amazonaws.com'
      port: 5432
      username: '<NOM_UTILISATEUR>'
      password: '<MOT_DE_PASSE>'
      dbname: '<NOM_BASE_DE_DONNÉES>'
      tags:
          - 'dbinstanceidentifier:<NOM_INSTANCE_BASE_DE_DONNÉES>'

Si vous utilisez Microsoft SQL Server, modifiez sqlserver.yaml :

init_config:

instances:
    - host: 'sqlserverrds.blah.us-east-1.rds.amazonaws.com,1433'
      username: '<NOM_UTILISATEUR>'
      password: '<MOT_DE_PASSE>'
      tags:
          - 'dbinstanceidentifier:<NOM_INSTANCE_BASE_DE_DONNÉES>'

Validation

Lancez la sous-commande status de l’Agent et cherchez quelque chose qui ressemble à ceci dans la section Checks :

Checks
======

[...]

  mysql
  -----
      - instance #0 [OK]
      - Collected 8 metrics & 0 events

Utilisation

Après quelques minutes, les métriques RDS et les métriques de MySQL, Aurora, MariaDB, SQL Server, Oracle ou PostgreSQL peuvent être consultées dans Datadog depuis le Metrics Explorer, les dashboards et les alertes. Voici un exemple de dashboard Aurora affichant un certain nombre de métriques issues des intégrations MySQL et RDS. Les métriques des deux intégrations sur l’instance quicktestrds sont unifiées à l’aide du tag dbinstanceidentifier.

dashboard rds aurora

Collecte de logs

Activer le logging

Vous pouvez transmettre des logs MySQL, MariaDB et Postgres à Amazon CloudWatch. Suivez les instructions figurant dans l’article sur la surveillance des logs Amazon Aurora MySQL, Amazon RDS pour MySQL et MariaDB avec Amazon CloudWatch (en anglais) pour commencer à envoyer vos logs RDS à CloudWatch.

Envoyer des logs à Datadog

  1. Si vous ne l’avez pas déjà fait, configurez la fonction AWS Lambda de collecte de logs avec Datadog.
  2. Une fois la fonction Lambda installée, ajoutez manuellement un déclencheur sur le groupe de logs CloudWatch contenant vos logs RDS. Sélectionnez le groupe de logs CloudWatch correspondant, ajoutez un nom de filtre (facultatif) et ajoutez le déclencheur.

Accédez ensuite à la section Log de Datadog pour explorer vos logs.

Données collectées

Outre les métriques recueillies depuis les moteurs de base de données, vous recevez également les métriques RDS suivantes :

Métriques

aws.rds.active_transactions
(gauge)
The average rate of current transactions executing on a DB instance. Only available for Aurora MySQL DBs.
Shown as transaction
aws.rds.aurora_binlog_replica_lag
(gauge)
The amount of time a replica DB cluster running on Aurora with MySQL compatibility lags behind the source DB cluster. Only available for Aurora MySQL DBs.
Shown as second
aws.rds.aurora_replica_lag
(gauge)
The average lag when replicating updates from the primary instance. Only available for Aurora DBs.
Shown as millisecond
aws.rds.aurora_replica_lag_maximum
(gauge)
The maximum amount of lag between the primary instance and each Aurora instance in the DB cluster. Only available for Aurora DBs.
Shown as millisecond
aws.rds.aurora_replica_lag_minimum
(gauge)
The minimum amount of lag between the primary instance and each Aurora instance in the DB cluster. Only available for Aurora DBs.
Shown as millisecond
aws.rds.backup_retention_period_storage_used
(gauge)
The amount of backup storage used for storing continuous backups at the current time. Only available for Aurora DBs.
Shown as byte
aws.rds.bin_log_disk_usage
(gauge)
Amount of disk space occupied by binary logs on the master. Only available for non-Aurora DBs.
Shown as byte
aws.rds.blocked_transactions
(count)
The average rate of transactions in the database that are blocked. Only available for Aurora MySQL DBs.
Shown as transaction
aws.rds.buffer_cache_hit_ratio
(gauge)
The percentage of requests that are served by the Buffer cache. Only available for Aurora DBs.
Shown as percent
aws.rds.burst_balance
(gauge)
The percent of General Purpose SSD (gp2) burst-bucket I/O credits available. Only available for non-Aurora DBs.
Shown as percent
aws.rds.commit_latency
(gauge)
The amount of latency for committed transactions. Only available for Aurora DBs.
Shown as millisecond
aws.rds.commit_throughput
(rate)
The average rate of committed transactions. Only available for Aurora DBs.
Shown as transaction
aws.rds.cpucredit_balance
(gauge)
[T2 instances] Number of CPU credits that an instance has accumulated. Available for Aurora DBs.
aws.rds.cpucredit_usage
(gauge)
[T2 instances] Number of CPU credits consumed. Available for Aurora DBs.
aws.rds.cpusurplus_credit_balance
(gauge)
The number of surplus credits that have been spent by an unlimited instance when its CPUCreditBalance value is zero.
aws.rds.cpusurplus_credits_charged
(gauge)
The number of spent surplus credits that are not paid down by earned CPU credits, and which thus incur an additional charge.
aws.rds.cpuutilization
(gauge)
Percentage of CPU utilization. Recommended metric for standard monitoring. Available for Aurora DBs.
Shown as percent
aws.rds.cpuutilization.guest
(gauge)
The percentage of CPU in use by guest programs. (Enhanced)
Shown as percent
aws.rds.cpuutilization.idle
(gauge)
The percentage of CPU that is idle. (Enhanced)
Shown as percent
aws.rds.cpuutilization.irq
(gauge)
The percentage of CPU in use by software interrupts. (Enhanced)
Shown as percent
aws.rds.cpuutilization.kern
(gauge)
The percentage of CPU in use by the kernel. (Enhanced, SQL Server Only)
Shown as percent
aws.rds.cpuutilization.nice
(gauge)
The percentage of CPU in use by programs running at lowest priority. (Enhanced)
Shown as percent
aws.rds.cpuutilization.steal
(gauge)
The percentage of CPU in use by other virtual machines. (Enhanced)
Shown as percent
aws.rds.cpuutilization.system
(gauge)
The percentage of CPU in use by the kernel. (Enhanced)
Shown as percent
aws.rds.cpuutilization.total
(gauge)
The total percentage of the CPU in use. This value excludes the nice value. Recommended metric for enhanced monitoring. (Enhanced)
Shown as percent
aws.rds.cpuutilization.user
(gauge)
The percentage of CPU in use by user programs. (Enhanced)
Shown as percent
aws.rds.cpuutilization.wait
(gauge)
The percentage of CPU unused while waiting for I/O access. (Enhanced)
Shown as percent
aws.rds.database_connections
(gauge)
Number of database connections in use. Available for Aurora DBs.
Shown as connection
aws.rds.dbload
(gauge)
The number of active sessions for the DB engine (Performance Insights must be enabled).
Shown as session
aws.rds.dbload_cpu
(gauge)
The number of active sessions where the wait event type is CPU (Performance Insights must be enabled).
Shown as session
aws.rds.dbload_non_cpu
(gauge)
The number of active sessions where the wait event type is not CPU (Performance Insights must be enabled).
Shown as session
aws.rds.dbload_relative_to_num_vcpus
(gauge)
The ratio of the DB load to the number of virtual CPUs for the database.
Shown as percent
aws.rds.ddllatency
(gauge)
The amount of latency for DDL requests (create/alter/drop). Only available for Aurora MySQL DBs.
Shown as millisecond
aws.rds.ddlthroughput
(rate)
The average rate of DDL requests per second. Only available for Aurora MySQL DBs.
Shown as request
aws.rds.deadlocks
(count)
The average number of deadlocks in the database per second. Only available for Aurora DBs.
Shown as lock
aws.rds.delete_latency
(gauge)
The average latency for delete queries. Only available for Aurora MySQL DBs.
Shown as millisecond
aws.rds.delete_throughput
(rate)
The average rate of delete queries. Only available for Aurora MySQL DBs.
Shown as query
aws.rds.disk_queue_depth
(gauge)
Number of outstanding IOs (read/write requests) waiting to access the disk. Available for Aurora DBs.
Shown as request
aws.rds.diskio.avgQueueLen
(gauge)
The number of requests waiting in the I/O device's queue. This metric is not available for Amazon Aurora. (Enhanced)
Shown as request
aws.rds.diskio.avgReqSz
(gauge)
The average request size. This metric is not available for Amazon Aurora. (Enhanced)
Shown as kibibyte
aws.rds.diskio.await
(gauge)
The number of milliseconds required to respond to requests including queue time and service time. This metric is not available for Amazon Aurora. (Enhanced)
Shown as millisecond
aws.rds.diskio.readIOsPS
(rate)
The rate of read operations. (Enhanced)
Shown as operation
aws.rds.diskio.readKb
(gauge)
The total amount of data read. This metric is not available for Amazon Aurora. (Enhanced)
Shown as kibibyte
aws.rds.diskio.readKbPS
(rate)
The rate that data is read. This metric is not available for Amazon Aurora. (Enhanced)
Shown as kibibyte
aws.rds.diskio.rrqmPS
(rate)
The rate of merged read requests queue. This metric is not available for Amazon Aurora. (Enhanced)
Shown as request
aws.rds.diskio.tps
(rate)
The rate of I/O transactions. This metric is not available for Amazon Aurora. (Enhanced)
Shown as transaction
aws.rds.diskio.util
(gauge)
The percentage of CPU time during which requests were issued. The percentage of CPU time during which requests were issued. (Enhanced)
Shown as percent
aws.rds.diskio.writeIOsPS
(rate)
The rate of write operations. (Enhanced)
Shown as operation
aws.rds.diskio.writeKb
(gauge)
The total amount of data written. This metric is not available for Amazon Aurora. (Enhanced)
Shown as kibibyte
aws.rds.diskio.writeKbPS
(rate)
The rate that data is written. This metric is not available for Amazon Aurora. (Enhanced)
Shown as kibibyte
aws.rds.diskio.wrqmPS
(rate)
The rate of merged write requests queue. This metric is not available for Amazon Aurora. (Enhanced)
Shown as request
aws.rds.dmllatency
(gauge)
The average latency for inserts and updates and deletes. Only available for Aurora MySQL DBs.
Shown as millisecond
aws.rds.dmlthroughput
(rate)
The average rate of inserts and updates and deletes. Only available for Aurora MySQL DBs.
Shown as operation
aws.rds.engine_uptime
(gauge)
The amount of time that the DB instance has been active. Only available for Aurora DBs.
Shown as second
aws.rds.failed_sqlserver_agent_jobs_count
(count)
The number of failed SQL Server Agent jobs during the last minute.
Shown as minute
aws.rds.filesystem.maxFiles
(gauge)
The maximum number of files that can be created for the file system. (Enhanced)
Shown as file
aws.rds.filesystem.total
(gauge)
The total amount of disk space available for the file system. (Enhanced)
Shown as kibibyte
aws.rds.filesystem.used
(gauge)
The amount of disk space used by files in the file system. (Enhanced)
Shown as kibibyte
aws.rds.filesystem.usedFilePercent
(gauge)
The percentage of available files in use. (Enhanced)
Shown as percent
aws.rds.filesystem.usedFiles
(gauge)
The number of files in the file system. (Enhanced)
Shown as file
aws.rds.filesystem.usedPercent
(gauge)
The percentage of the file-system disk space in use. (Enhanced)
Shown as percent
aws.rds.free_local_storage
(gauge)
The amount of local storage that is free on an instance. Only available for Aurora DBs.
Shown as byte
aws.rds.free_storage_space
(gauge)
Amount of available storage space.
Shown as byte
aws.rds.freeable_memory
(gauge)
Amount of available random access memory. Available for Aurora DBs.
Shown as byte
aws.rds.insert_latency
(gauge)
The amount of latency for insert queries. Only available for Aurora MySQL DBs.
Shown as millisecond
aws.rds.insert_throughput
(rate)
The average rate of insert queries. Only available for Aurora MySQL DBs.
Shown as query
aws.rds.load.1
(gauge)
The number of processes requesting CPU time over the last minute. (Enhanced)
Shown as process
aws.rds.load.15
(gauge)
The number of processes requesting CPU time over the last 15 minutes. (Enhanced)
Shown as process
aws.rds.load.5
(gauge)
The number of processes requesting CPU time over the last 5 minutes. (Enhanced)
Shown as process
aws.rds.login_failures
(count)
The average number of failed login attempts per second. Only available for Aurora MySQL DBs.
Shown as operation
aws.rds.maximum_used_transaction_ids
(count)
The maximum transaction ID that has been used. Only available for Aurora PostgreSQL DBs.
aws.rds.memory.active
(gauge)
The amount of assigned memory. (Enhanced)
Shown as kibibyte
aws.rds.memory.buffers
(gauge)
The amount of memory used for buffering I/O requests prior to writing to the storage device. (Enhanced)
Shown as kibibyte
aws.rds.memory.cached
(gauge)
The amount of memory used for caching file system-based I/O. (Enhanced)
Shown as kibibyte
aws.rds.memory.commitLimitKb
(gauge)
The maximum possible value for the commitTotKb metric. This value is the sum of the current pagefile size plus the physical memory available for pageable contents–excluding RAM that is assigned to non-pageable areas. (Enhanced, SQL Server Only)
Shown as kibibyte
aws.rds.memory.commitPeakKb
(gauge)
The largest value of the commitTotKb metric since the operating system was last started. (Enhanced, SQL Server Only)
Shown as kibibyte
aws.rds.memory.commitTotKb
(gauge)
The amount of pagefile-backed virtual address space in use, that is, the current commit charge. This value is composed of main memory (RAM) and disk (pagefiles). (Enhanced, SQL Server Only)
Shown as kibibyte
aws.rds.memory.dirty
(gauge)
The amount of memory pages in RAM that have been modified but not written to their related data block in storage. (Enhanced)
Shown as kibibyte
aws.rds.memory.free
(gauge)
The amount of unassigned memory. (Enhanced)
Shown as kibibyte
aws.rds.memory.hugePagesFree
(gauge)
The number of free huge pages. (Enhanced)
Shown as page
aws.rds.memory.hugePagesRsvd
(gauge)
The number of committed huge pages. (Enhanced)
Shown as page
aws.rds.memory.hugePagesSize
(gauge)
The size for each huge pages unit. (Enhanced)
Shown as kibibyte
aws.rds.memory.hugePagesSurp
(gauge)
The number of available surplus huge pages over the total. (Enhanced)
Shown as page
aws.rds.memory.hugePagesTotal
(gauge)
The total number of huge pages for the system. (Enhanced)
Shown as page
aws.rds.memory.inactive
(gauge)
The amount of inactive memory (Enhanced)
Shown as kibibyte
aws.rds.memory.kernNonpagedKb
(gauge)
The amount of memory in the non-paged kernel pool. (Enhanced, SQL Server Only)
Shown as kibibyte
aws.rds.memory.kernPagedKb
(gauge)
The amount of memory in the paged kernel pool. (Enhanced, SQL Server Only)
Shown as kibibyte
aws.rds.memory.kernTotKb
(gauge)
The sum of the memory in the paged and non-paged kernel pools. (Enhanced, SQL Server Only)
Shown as kibibyte
aws.rds.memory.mapped
(gauge)
The total amount of file-system contents that is memory mapped inside a process address space. (Enhanced)
Shown as kibibyte
aws.rds.memory.pageSize
(gauge)
The size of a page. (Enhanced, SQL Server Only)
Shown as byte
aws.rds.memory.pageTables
(gauge)
The amount of memory used by page tables. (Enhanced)
Shown as kibibyte
aws.rds.memory.physAvailKb
(gauge)
The amount of available physical memory. (Enhanced, SQL Server Only)
Shown as kibibyte
aws.rds.memory.physTotKb
(gauge)
The amount of physical memory. (Enhanced, SQL Server Only)
Shown as kibibyte
aws.rds.memory.slab
(gauge)
The amount of reusable kernel data structures. (Enhanced)
Shown as kibibyte
aws.rds.memory.sqlServerTotKb
(gauge)
The amount of memory committed to Microsoft SQL Server. (Enhanced, SQL Server Only)
Shown as kibibyte
aws.rds.memory.sysCacheKb
(gauge)
The amount of system cache memory. (Enhanced, SQL Server Only)
Shown as kibibyte
aws.rds.memory.total
(gauge)
The total amount of memory. (Enhanced)
Shown as kibibyte
aws.rds.memory.writeback
(gauge)
The amount of dirty pages in RAM that are still being written to the backing storage. (Enhanced)
Shown as kibibyte
aws.rds.network.rdBytesPS
(gauge)
The number of bytes received per second. (Enhanced, SQL Server Only)
Shown as byte
aws.rds.network.rx
(gauge)
The number of packets received. (Enhanced)
Shown as packet
aws.rds.network.tx
(gauge)
The number of packets uploaded. (Enhanced)
Shown as packet
aws.rds.network.wrBytesPS
(gauge)
The number of bytes sent per second. (Enhanced, SQL Server Only)
Shown as byte
aws.rds.network_receive_throughput
(rate)
Incoming (Receive) network traffic on the DB instance. Available for Aurora DBs.
Shown as byte
aws.rds.network_throughput
(rate)
The rate of network throughput sent and received from clients by each instance in the DB cluster. Only available for Aurora DBs.
Shown as byte
aws.rds.network_transmit_throughput
(rate)
Outgoing (Transmit) network traffic on the DB instance. Available for Aurora DBs.
Shown as byte
aws.rds.oldest_replication_slot_lag
(gauge)
The lagging size of the replica lagging the most in terms of WAL data received. Only available for Aurora PostgreSQL DBs.
Shown as byte
aws.rds.process.cpuUsedPc
(gauge)
The percentage of CPU used by the process. (Enhanced)
Shown as percent
aws.rds.process.memUsedPc
(gauge)
The percentage of total memory used by the process. (Enhanced, SQL Server Only)
Shown as percent
aws.rds.process.memoryUsedPc
(gauge)
The percentage of memory used by the process. (Enhanced)
Shown as percent
aws.rds.process.parentID
(gauge)
The process identifier for the parent proces of the process. (Enhanced)
aws.rds.process.pid
(gauge)
The identifier of the process. This value is not present for processes that are owned by Amazon RDS. (Enhanced, SQL Server Only)
aws.rds.process.ppid
(gauge)
The process identifier for the parent of this process. This value is only present for child processes. (Enhanced, SQL Server Only)
aws.rds.process.rss
(gauge)
The amount of RAM allocated to the process. (Enhanced)
Shown as kibibyte
aws.rds.process.tgid
(gauge)
The thread group identifier which is a number representing the process ID to which a thread belongs. This identifier is used to group threads from the same process. (Enhanced)
aws.rds.process.tid
(gauge)
The thread identifier. This value is only present for threads. The owning process can be identified by using the pid value. (Enhanced, SQL Server Only)
aws.rds.process.virtKb
(gauge)
The amount of virtual address space the process is using. Use of virtual address space does not necessarily imply corresponding use of either disk or main memory pages. (Enhanced, SQL Server Only)
Shown as kibibyte
aws.rds.process.vss
(gauge)
The amount of virtual memory allocated to the process. (Enhanced)
Shown as kibibyte
aws.rds.process.workingSetKb
(gauge)
The amount of memory in the private working set plus the amount of memory that is in use by the process and can be shared with other processes. (Enhanced, SQL Server Only)
Shown as kibibyte
aws.rds.process.workingSetPrivKb
(gauge)
The amount of memory that is in use by a process, but can't be shared with other processes. (Enhanced, SQL Server Only)
Shown as kibibyte
aws.rds.process.workingSetShareableKb
(gauge)
The amount of memory that is in use by a process and can be shared with other processes. (Enhanced, SQL Server Only)
Shown as kibibyte
aws.rds.queries
(rate)
The average rate of queries. Only available for Aurora MySQL DBs.
Shown as query
aws.rds.rdsto_aurora_postgre_sqlreplica_lag
(gauge)
The amount of lag in seconds when replicating updates from the primary RDS PostgreSQL instance to other nodes in the cluster. Only available for Aurora PostgreSQL DBs.
Shown as second
aws.rds.read_iops
(rate)
Average number of disk read I/O operations.
Shown as operation
aws.rds.read_latency
(gauge)
Average amount of time taken per disk read I/O operation.
Shown as second
aws.rds.read_throughput
(rate)
Average number of bytes read from disk.
Shown as byte
aws.rds.replica_lag
(gauge)
Amount of time a Read Replica DB Instance lags behind the source DB Instance.
Shown as second
aws.rds.replication_slot_disk_usage
(gauge)
The disk space used by replication slot files. Available for Aurora PostgreSQL DBs.
Shown as byte
aws.rds.result_set_cache_hit_ratio
(gauge)
The percentage of requests that are served by the Resultset cache. Only available for Aurora MySQL DBs.
Shown as percent
aws.rds.select_latency
(gauge)
The average latency for select queries. Only available for Aurora MySQL DBs.
Shown as millisecond
aws.rds.select_throughput
(rate)
The average rate of select queries. Only available for Aurora MySQL DBs.
Shown as query
aws.rds.snapshot_storage_used
(gauge)
The amount of backup storage used for storing manual snapshots beyond the backup retention period. Only available for Aurora DBs.
Shown as byte
aws.rds.swap.cached
(gauge)
The amount of swap memory used as cache memory. (Enhanced)
Shown as kibibyte
aws.rds.swap.free
(gauge)
The total amount of swap memory free. (Enhanced)
Shown as kibibyte
aws.rds.swap.in
(gauge)
The amount of memory swapped in from disk. (Enhanced)
Shown as kibibyte
aws.rds.swap.out
(gauge)
The amount of memory swapped out from disk. (Enhanced)
Shown as kibibyte
aws.rds.swap.total
(gauge)
The total amount of swap memory available. (Enhanced)
Shown as kibibyte
aws.rds.swap_usage
(gauge)
Amount of swap space used on the DB Instance. Available for Aurora DBs.
Shown as byte
aws.rds.tasks.blocked
(gauge)
The number of tasks that are blocked. (Enhanced)
Shown as task
aws.rds.tasks.running
(gauge)
The number of tasks that are running. (Enhanced)
Shown as task
aws.rds.tasks.sleeping
(gauge)
The number of tasks that are sleeping. (Enhanced)
Shown as task
aws.rds.tasks.stopped
(gauge)
The number of tasks that are stopped. (Enhanced)
Shown as task
aws.rds.tasks.total
(gauge)
The total number of tasks. (Enhanced)
Shown as task
aws.rds.tasks.zombie
(gauge)
The number of child tasks that are inactive with an active parent task. (Enhanced)
Shown as task
aws.rds.total_backup_storage_billed
(gauge)
The sum of BackupRetentionPeriodStorageUsed and SnapshotStorageUsed minus an amount of free backup storage which equals the size of the cluster volume for one day. Only available for Aurora DBs.
Shown as byte
aws.rds.total_storage_space
(gauge)
Total amount of storage available on an instance.
Shown as byte
aws.rds.transaction_logs_disk_usage
(gauge)
Amount of disk space occupied by transaction logs. Only available for Aurora PostgreSQL DBs.
Shown as byte
aws.rds.transaction_logs_generation
(gauge)
The size of transaction logs generated per second.
Shown as byte
aws.rds.update_latency
(gauge)
The average latency for update queries. Only available for Aurora MySQL DBs.
Shown as millisecond
aws.rds.update_throughput
(rate)
The average rate of update queries. Only available for Aurora MySQL DBs.
Shown as query
aws.rds.uptime
(gauge)
RDS instance uptime. (Enhanced)
Shown as second
aws.rds.virtual_cpus
(gauge)
The number of virtual CPUs for the DB instance. (Enhanced)
Shown as cpu
aws.rds.volume_bytes_used
(gauge)
The amount of storage in bytes used by your Aurora database. Only available for Aurora DBs.
Shown as byte
aws.rds.volume_read_iops
(count)
The number of billed read I/O operations from a cluster volume, reported at 5-minute intervals. Only available for Aurora DBs.
Shown as operation
aws.rds.volume_write_iops
(count)
The average number of write disk I/O operations to the cluster volume reported at 5-minute intervals. Only available for Aurora DBs.
Shown as operation
aws.rds.write_iops
(rate)
Average number of disk write I/O operations per second.
Shown as operation
aws.rds.write_latency
(gauge)
Average amount of time taken per disk write I/O operation.
Shown as second
aws.rds.write_throughput
(rate)
Average number of bytes written.
Shown as byte

Chacune des métriques récupérées à partir d’AWS se voit assigner les mêmes tags que ceux qui apparaissent dans la console AWS, y compris, mais sans s’y limiter, le hostname et les groupes de sécurité.

Événements

L’intégration Amazon RDS comprend des événements liés aux instances de base de données, aux groupes de sécurité, aux snapshots et aux groupes de paramètres. Vous trouverez ci-dessous des exemples d’événements :

Événements Amazon RDS

Checks de service

aws.rds.read_replica_status Surveille le statut du réplica en lecture. Ce check renvoie l’un des statuts suivants :

  • OK - En cours de réplication ou de connexion
  • CRITICAL - Erreur ou terminé
  • WARNING - Arrêté
  • UNKNOWN - Autre

Fonctionnalités de surveillance prêtes à l’emploi

L’intégration Amazon RDS propose des fonctionnalités de surveillance prêtes à l’emploi vous permettant de surveiller et d’optimiser vos performances.

Dépannage

Besoin d’aide ? Contactez l’assistance Datadog.

Pour aller plus loin