Python utilise l’instrumentation automatique pour injecter et extraire les métadonnées supplémentaires requises par Data Streams Monitoring afin de mesurer les latences de bout en bout et les relations entre les files d’attente et les services. Pour activer Data Streams Monitoring, définissez la variable d’environnement DD_DATA_STREAMS_ENABLED sur true sur les services qui envoient des messages à Kafka (ou qui en consomment).
Data Streams Monitoring uses message headers to propagate context through Kafka streams. If log.message.format.version is set in the Kafka broker configuration, it must be set to 0.11.0.0 or higher. Data Streams Monitoring is not supported for versions lower than this.
Monitoring SQS pipelines
Data Streams Monitoring uses one message attribute to track a message’s path through an SQS queue. As Amazon SQS has a maximum limit of 10 message attributes allowed per message, all messages streamed through the data pipelines must have 9 or fewer message attributes set, allowing the remaining attribute for Data Streams Monitoring.
Monitoring RabbitMQ pipelines
The RabbitMQ integration can provide detailed monitoring and metrics of your RabbitMQ deployments. For full compatibility with Data Streams Monitoring, Datadog recommends configuring the integration as follows:
This ensures that all RabbitMQ graphs populate, and that you see detailed metrics for individual exchanges as well as queues.
Monitoring Kinesis pipelines
There are no message attributes in Kinesis to propagate context and track a message’s full path through a Kinesis stream. As a result, Data Streams Monitoring’s end-to-end latency metrics are approximated based on summing latency on segments of a message’s path, from the producing service through a Kinesis Stream, to a consumer service. Throughput metrics are based on segments from the producing service through a Kinesis Stream, to the consumer service. The full topology of data streams can still be visualized through instrumenting services.
Data Streams Monitoring propage le contexte via les en-têtes de messages. Si vous utilisez une technologie de file d’attente de messages qui n’est pas prise en charge par DSM, ou une technologie sans en-têtes (comme Kinesis), utilisez l’instrumentation manuelle pour configurer DSM.
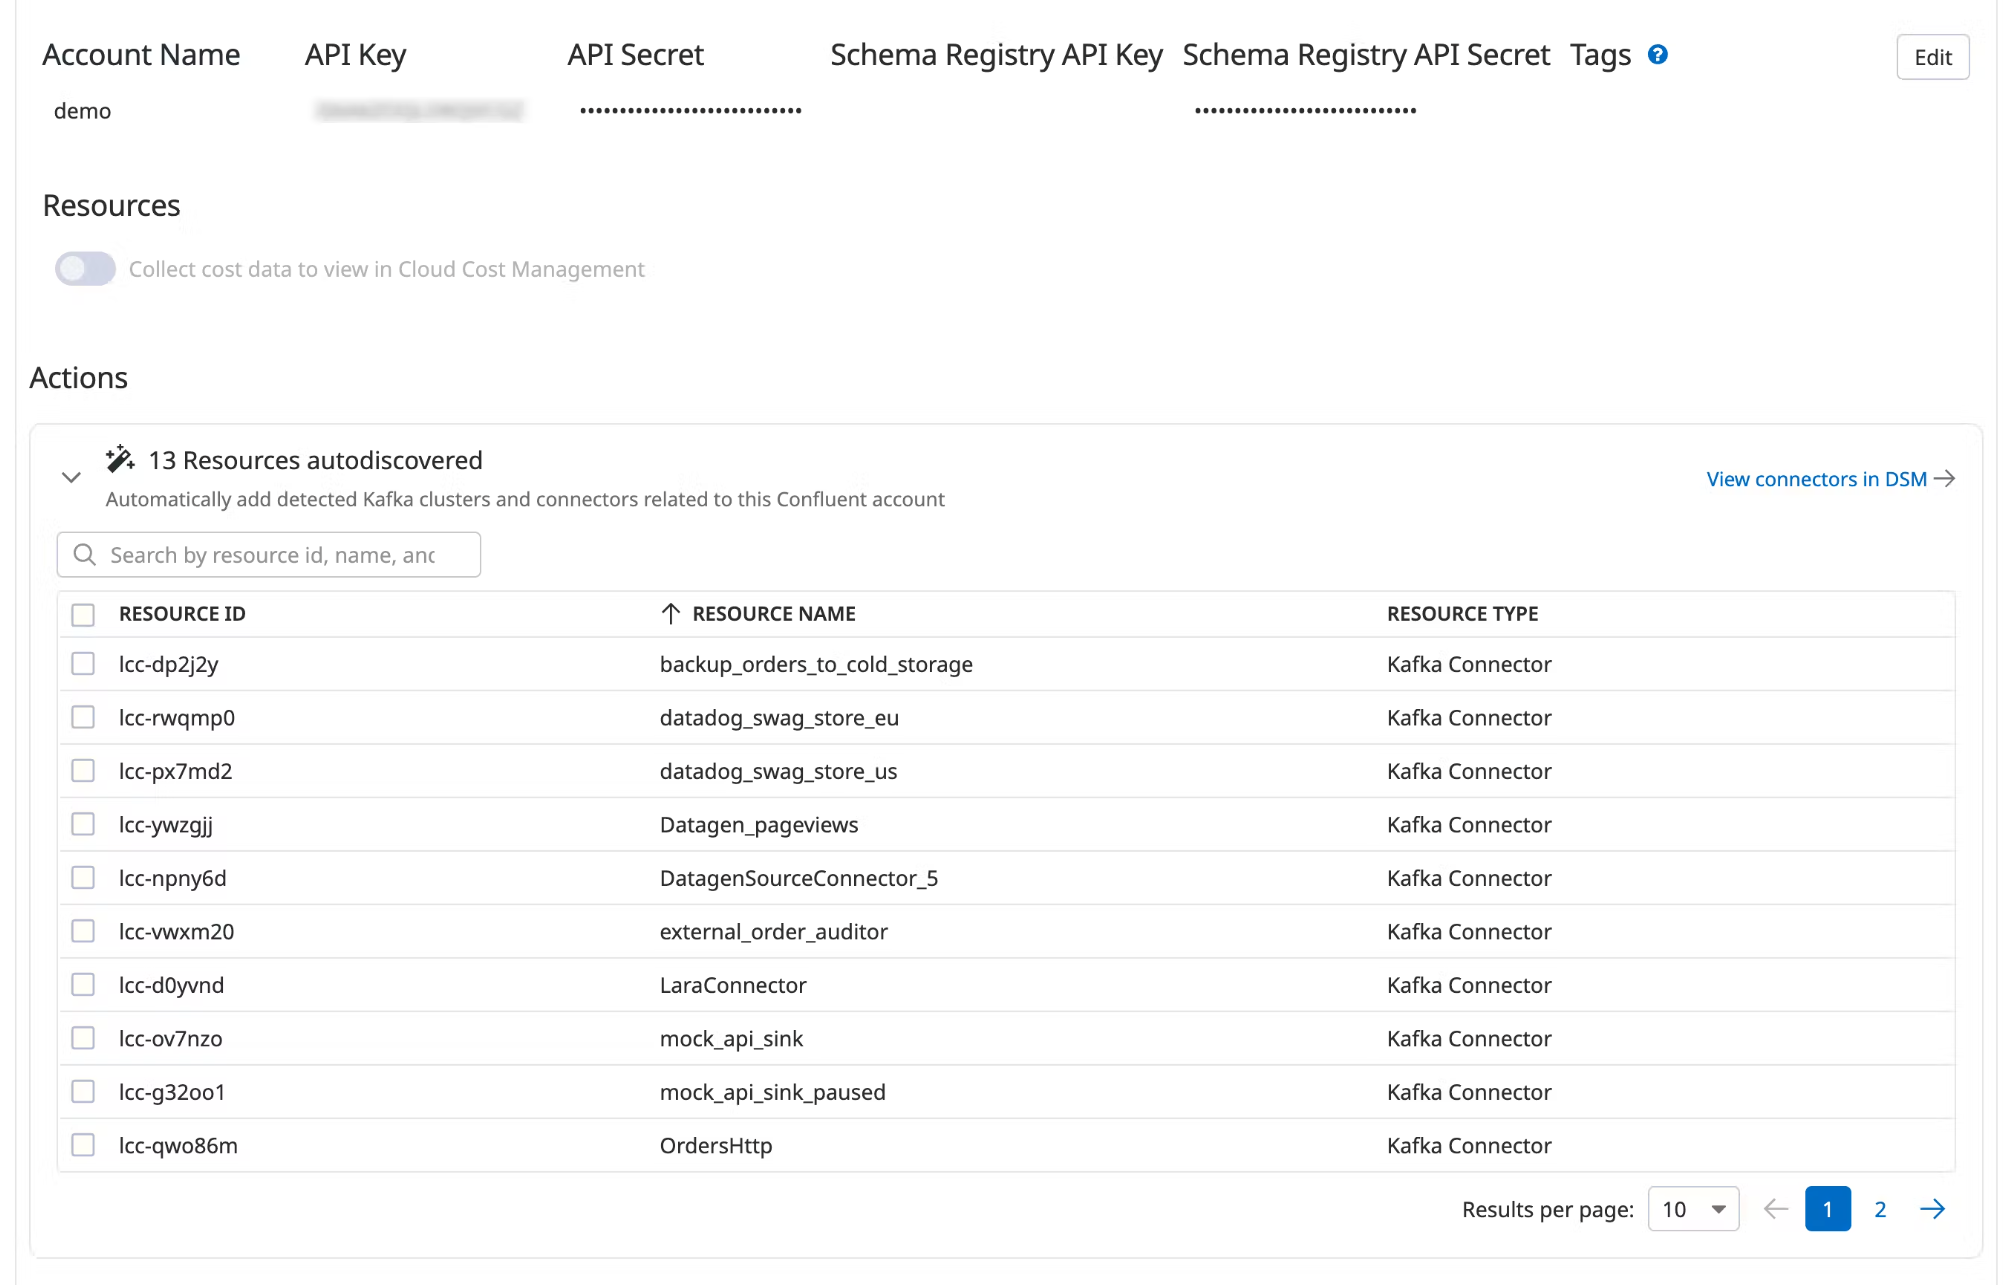
Surveillance des connecteurs
Connecteurs Confluent Cloud
Data Streams Monitoring can automatically discover your Confluent Cloud connectors and visualize them within the context of your end-to-end streaming data pipeline.
Under Actions, a list of resources populates with detected clusters and connectors. Datadog attempts to discover new connectors every time you view this integration tile.
Select the resources you want to add.
Click Add Resources.
Navigate to Data Streams Monitoring to visualize the connectors and track connector status and throughput.
Pour aller plus loin
Documentation, liens et articles supplémentaires utiles: