Pour implémenter la solution Data Streams Monitoring, vous devez avoir installé la dernière version de l’Agent Datadog et des bibliothèques Data Streams Monitoring.
Note: This documentation uses v2 of the Go tracer, which Datadog recommends for all users. If you are using v1, see the migration guide to upgrade to v2.
Data Streams Monitoring n’a pas été modifié entre les versions v1 et v2 du traceur.
Data Streams Monitoring uses message headers to propagate context through Kafka streams. If log.message.format.version is set in the Kafka broker configuration, it must be set to 0.11.0.0 or higher. Data Streams Monitoring is not supported for versions lower than this.
Monitoring RabbitMQ pipelines
The RabbitMQ integration can provide detailed monitoring and metrics of your RabbitMQ deployments. For full compatibility with Data Streams Monitoring, Datadog recommends configuring the integration as follows:
Définissez la variable d’environnement DD_DATA_STREAMS_ENABLED=true
Instrumentation manuelle
Client Sarama Kafka
Pour instrumenter manuellement le client Sarama Kafka avec Data Streams Monitoring :
Importez la bibliothèque go ddsarama
import(ddsarama"github.com/DataDog/dd-trace-go/contrib/IBM/sarama/v2")2.Wraptheproducerwith`ddsarama.WrapAsyncProducer`...config:=sarama.NewConfig()producer,err:=sarama.NewAsyncProducer([]string{bootStrapServers},config)// ADD THIS LINEproducer=ddsarama.WrapAsyncProducer(config,producer,ddsarama.WithDataStreams())
Client Confluent Kafka
Pour instrumenter manuellement Confluent Kafka avec Data Streams Monitoring :
Encapsulez la création du producteur avec ddkafka.NewProducer et utilisez la configuration ddkafka.WithDataStreams()
// CREATE PRODUCER WITH THIS WRAPPERproducer,err:=ddkafka.NewProducer(&kafka.ConfigMap{"bootstrap.servers":bootStrapServers,},ddkafka.WithDataStreams())
Si un service consomme des données en un point et en produit en un autre point, propagez le contexte entre ces deux points à l’aide de la structure du contexte Go :
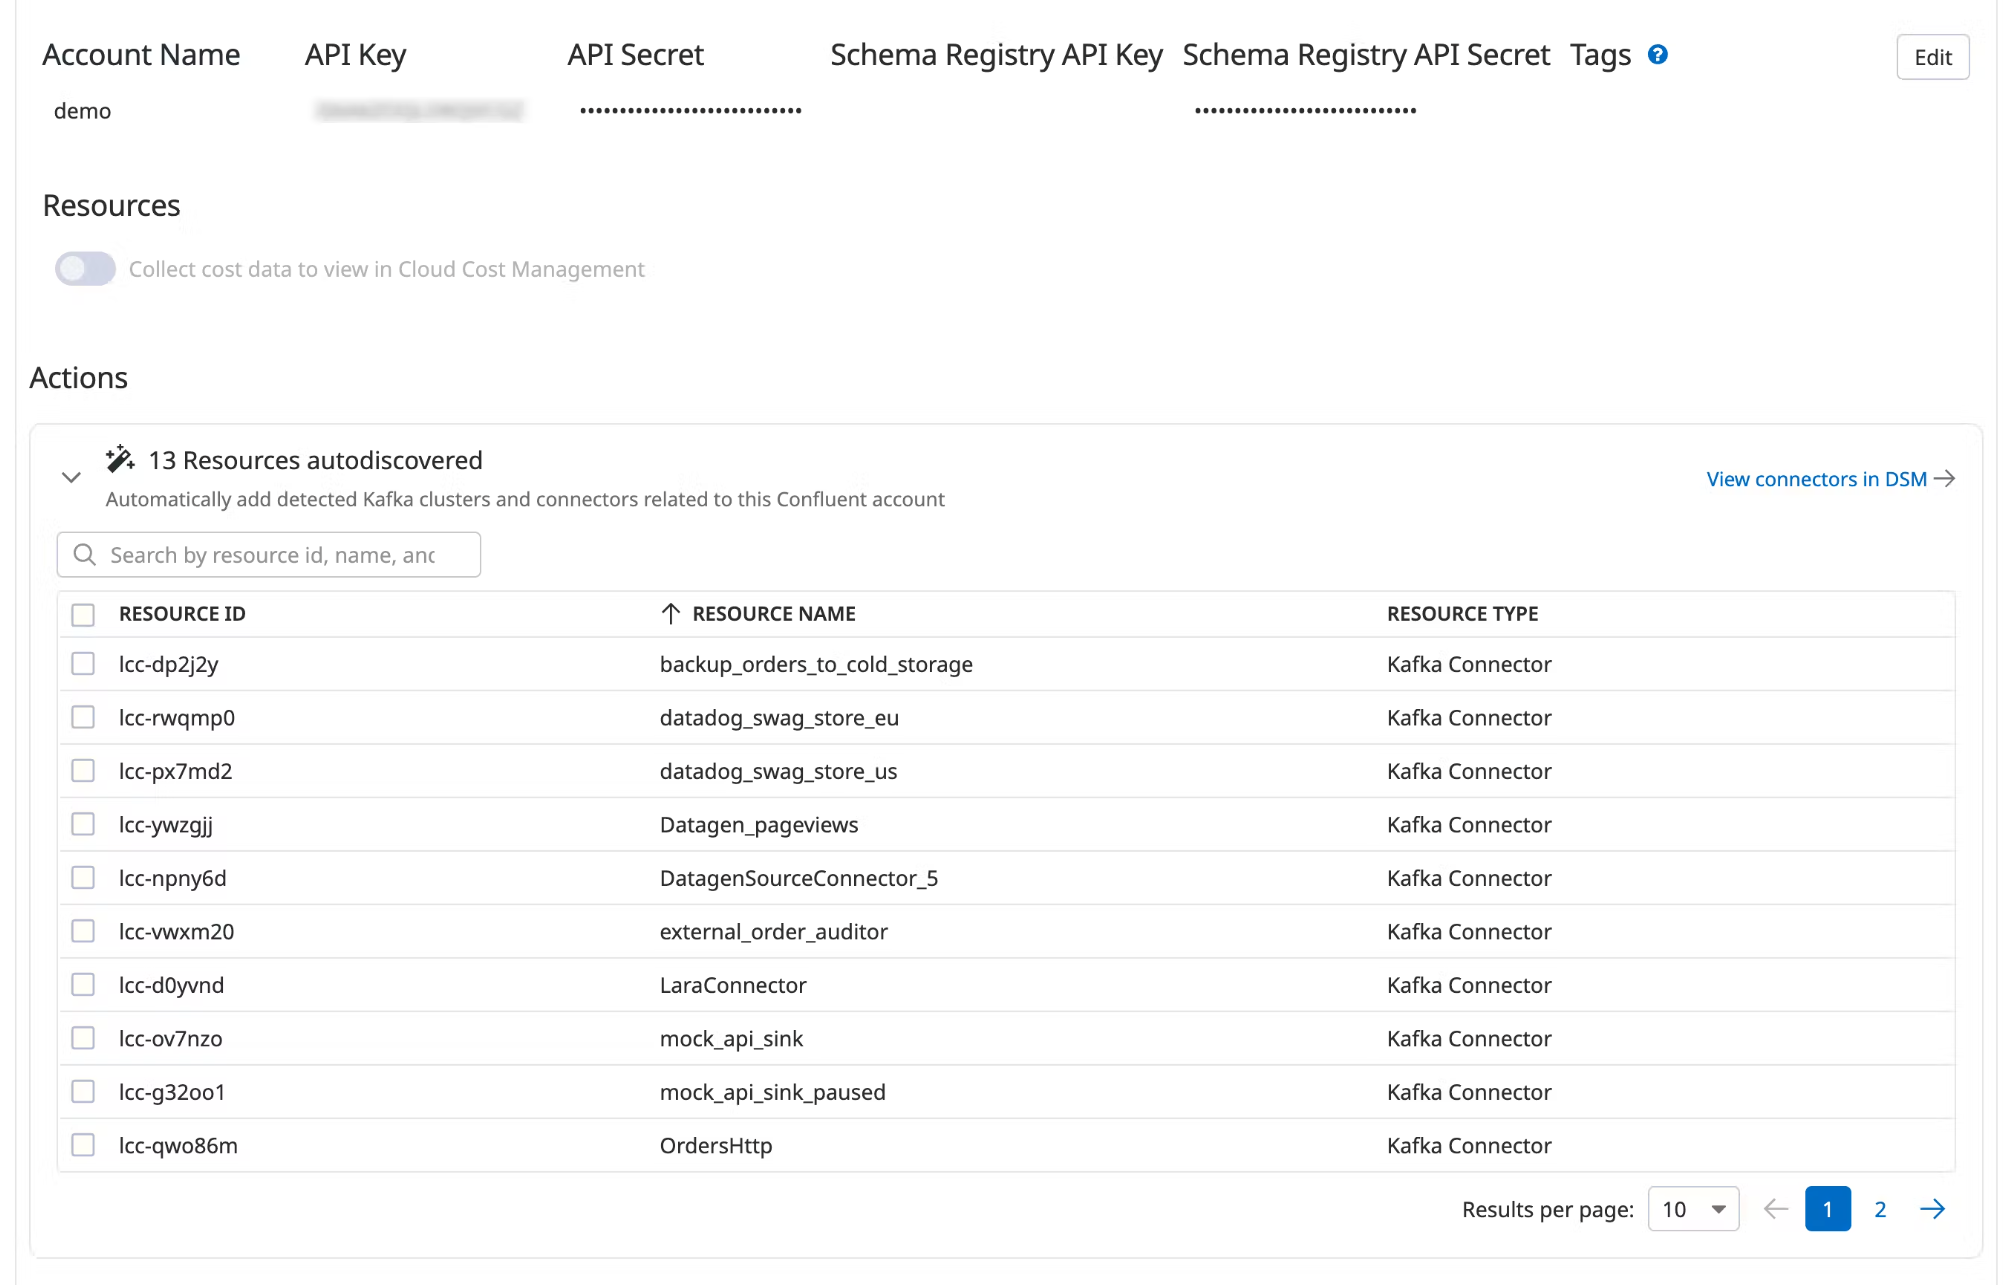
Data Streams Monitoring can automatically discover your Confluent Cloud connectors and visualize them within the context of your end-to-end streaming data pipeline.
Under Actions, a list of resources populates with detected clusters and connectors. Datadog attempts to discover new connectors every time you view this integration tile.
Select the resources you want to add.
Click Add Resources.
Navigate to Data Streams Monitoring to visualize the connectors and track connector status and throughput.
Pour aller plus loin
Documentation, liens et articles supplémentaires utiles: