- Esenciales
- Empezando
- Agent
- API
- Rastreo de APM
- Contenedores
- Dashboards
- Monitorización de bases de datos
- Datadog
- Sitio web de Datadog
- DevSecOps
- Gestión de incidencias
- Integraciones
- Internal Developer Portal
- Logs
- Monitores
- OpenTelemetry
- Generador de perfiles
- Session Replay
- Security
- Serverless para Lambda AWS
- Software Delivery
- Monitorización Synthetic
- Etiquetas (tags)
- Workflow Automation
- Centro de aprendizaje
- Compatibilidad
- Glosario
- Atributos estándar
- Guías
- Agent
- Arquitectura
- IoT
- Plataformas compatibles
- Recopilación de logs
- Configuración
- Automatización de flotas
- Solucionar problemas
- Detección de nombres de host en contenedores
- Modo de depuración
- Flare del Agent
- Estado del check del Agent
- Problemas de NTP
- Problemas de permisos
- Problemas de integraciones
- Problemas del sitio
- Problemas de Autodiscovery
- Problemas de contenedores de Windows
- Configuración del tiempo de ejecución del Agent
- Consumo elevado de memoria o CPU
- Guías
- Seguridad de datos
- Integraciones
- Desarrolladores
- Autorización
- DogStatsD
- Checks personalizados
- Integraciones
- Build an Integration with Datadog
- Crear una integración basada en el Agent
- Crear una integración API
- Crear un pipeline de logs
- Referencia de activos de integración
- Crear una oferta de mercado
- Crear un dashboard de integración
- Create a Monitor Template
- Crear una regla de detección Cloud SIEM
- Instalar la herramienta de desarrollo de integraciones del Agente
- Checks de servicio
- Complementos de IDE
- Comunidad
- Guías
- OpenTelemetry
- Administrator's Guide
- API
- Partners
- Aplicación móvil de Datadog
- DDSQL Reference
- CoScreen
- CoTerm
- Remote Configuration
- Cloudcraft
- En la aplicación
- Dashboards
- Notebooks
- Editor DDSQL
- Reference Tables
- Hojas
- Monitores y alertas
- Watchdog
- Métricas
- Bits AI
- Internal Developer Portal
- Error Tracking
- Explorador
- Estados de problemas
- Detección de regresión
- Suspected Causes
- Error Grouping
- Bits AI Dev Agent
- Monitores
- Issue Correlation
- Identificar confirmaciones sospechosas
- Auto Assign
- Issue Team Ownership
- Rastrear errores del navegador y móviles
- Rastrear errores de backend
- Manage Data Collection
- Solucionar problemas
- Guides
- Change Tracking
- Gestión de servicios
- Objetivos de nivel de servicio (SLOs)
- Gestión de incidentes
- De guardia
- Status Pages
- Gestión de eventos
- Gestión de casos
- Actions & Remediations
- Infraestructura
- Cloudcraft
- Catálogo de recursos
- Universal Service Monitoring
- Hosts
- Contenedores
- Processes
- Serverless
- Monitorización de red
- Cloud Cost
- Rendimiento de las aplicaciones
- APM
- Términos y conceptos de APM
- Instrumentación de aplicación
- Recopilación de métricas de APM
- Configuración de pipelines de trazas
- Correlacionar trazas (traces) y otros datos de telemetría
- Trace Explorer
- Recommendations
- Code Origin for Spans
- Observabilidad del servicio
- Endpoint Observability
- Instrumentación dinámica
- Live Debugger
- Error Tracking
- Seguridad de los datos
- Guías
- Solucionar problemas
- Límites de tasa del Agent
- Métricas de APM del Agent
- Uso de recursos del Agent
- Logs correlacionados
- Stacks tecnológicos de llamada en profundidad PHP 5
- Herramienta de diagnóstico de .NET
- Cuantificación de APM
- Go Compile-Time Instrumentation
- Logs de inicio del rastreador
- Logs de depuración del rastreador
- Errores de conexión
- Continuous Profiler
- Database Monitoring
- Gastos generales de integración del Agent
- Arquitecturas de configuración
- Configuración de Postgres
- Configuración de MySQL
- Configuración de SQL Server
- Configuración de Oracle
- Configuración de MongoDB
- Setting Up Amazon DocumentDB
- Conexión de DBM y trazas
- Datos recopilados
- Explorar hosts de bases de datos
- Explorar métricas de consultas
- Explorar ejemplos de consulta
- Exploring Database Schemas
- Exploring Recommendations
- Solucionar problemas
- Guías
- Data Streams Monitoring
- Data Jobs Monitoring
- Data Observability
- Experiencia digital
- Real User Monitoring
- Pruebas y monitorización de Synthetics
- Continuous Testing
- Análisis de productos
- Entrega de software
- CI Visibility
- CD Visibility
- Deployment Gates
- Test Visibility
- Configuración
- Network Settings
- Tests en contenedores
- Repositories
- Explorador
- Monitores
- Test Health
- Flaky Test Management
- Working with Flaky Tests
- Test Impact Analysis
- Flujos de trabajo de desarrolladores
- Cobertura de código
- Instrumentar tests de navegador con RUM
- Instrumentar tests de Swift con RUM
- Correlacionar logs y tests
- Guías
- Solucionar problemas
- Code Coverage
- Quality Gates
- Métricas de DORA
- Feature Flags
- Seguridad
- Información general de seguridad
- Cloud SIEM
- Code Security
- Cloud Security Management
- Application Security Management
- Workload Protection
- Sensitive Data Scanner
- Observabilidad de la IA
- Log Management
- Observability Pipelines
- Gestión de logs
- CloudPrem
- Administración
- Gestión de cuentas
- Seguridad de los datos
- Ayuda
Gráficos de estado
Los gráficos de estado forman parte de la página de estado provisoria del monitor . Si utilizas la página de estado legacy, consulta la documentación de la página Estado legacy.
Información general
Los gráficos de la página de estado del monitor ofrecen información sobre las evaluaciones individuales del monitor. Estos gráficos te permiten comprender por qué tu monitor podría encontrarse en un estado ALERT y dónde centrar tus esfuerzos para solucionar problemas.
Metadatos de monitor
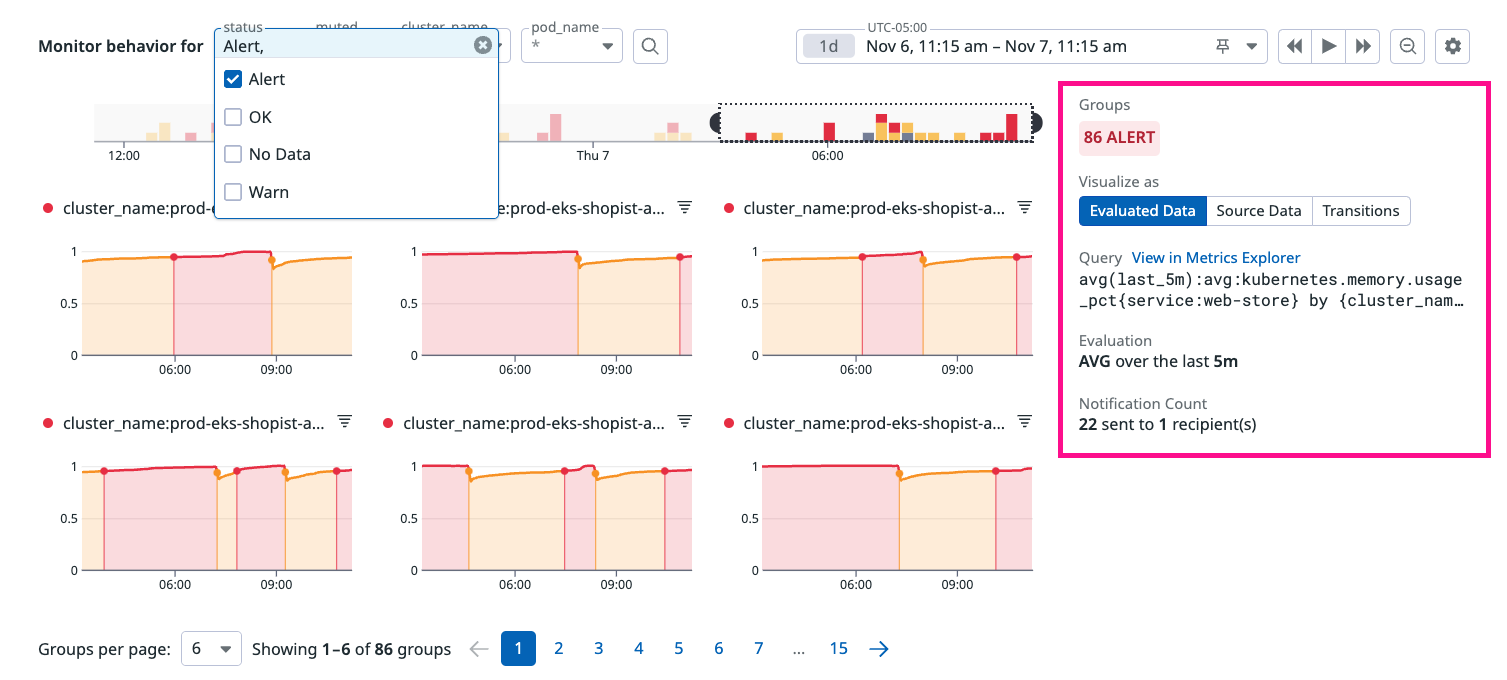
El panel derecho de la sección de gráficos de la página de estado del monitor proporciona información general clara de tu monitor, incluyendo
| Descripción | |
|---|---|
| Grupos | Recuento de grupos por estado (ALERT, WARN, NO DATA, OK) |
| Visualizar como | Selector de gráficos para alternar entre los gráficos: Datos evaluados, Datos de origen y Transiciones. |
| Consulta | Consulta de monitor sin procesar. Cada monitor incluye un enlace dinámico a un explorador o página específicos en función del tipo de datos, como explorador de eventos para los tipos de datos de eventos o un explorador general de métricas para otros tipos. |
| Evaluación | Método de agregación aplicado a la consulta con la ventana de evaluación. |
| Recuento de notificaciones | Recuento de notificaciones enviadas desde este monitor. |
Filtrar la página por grupos o estado
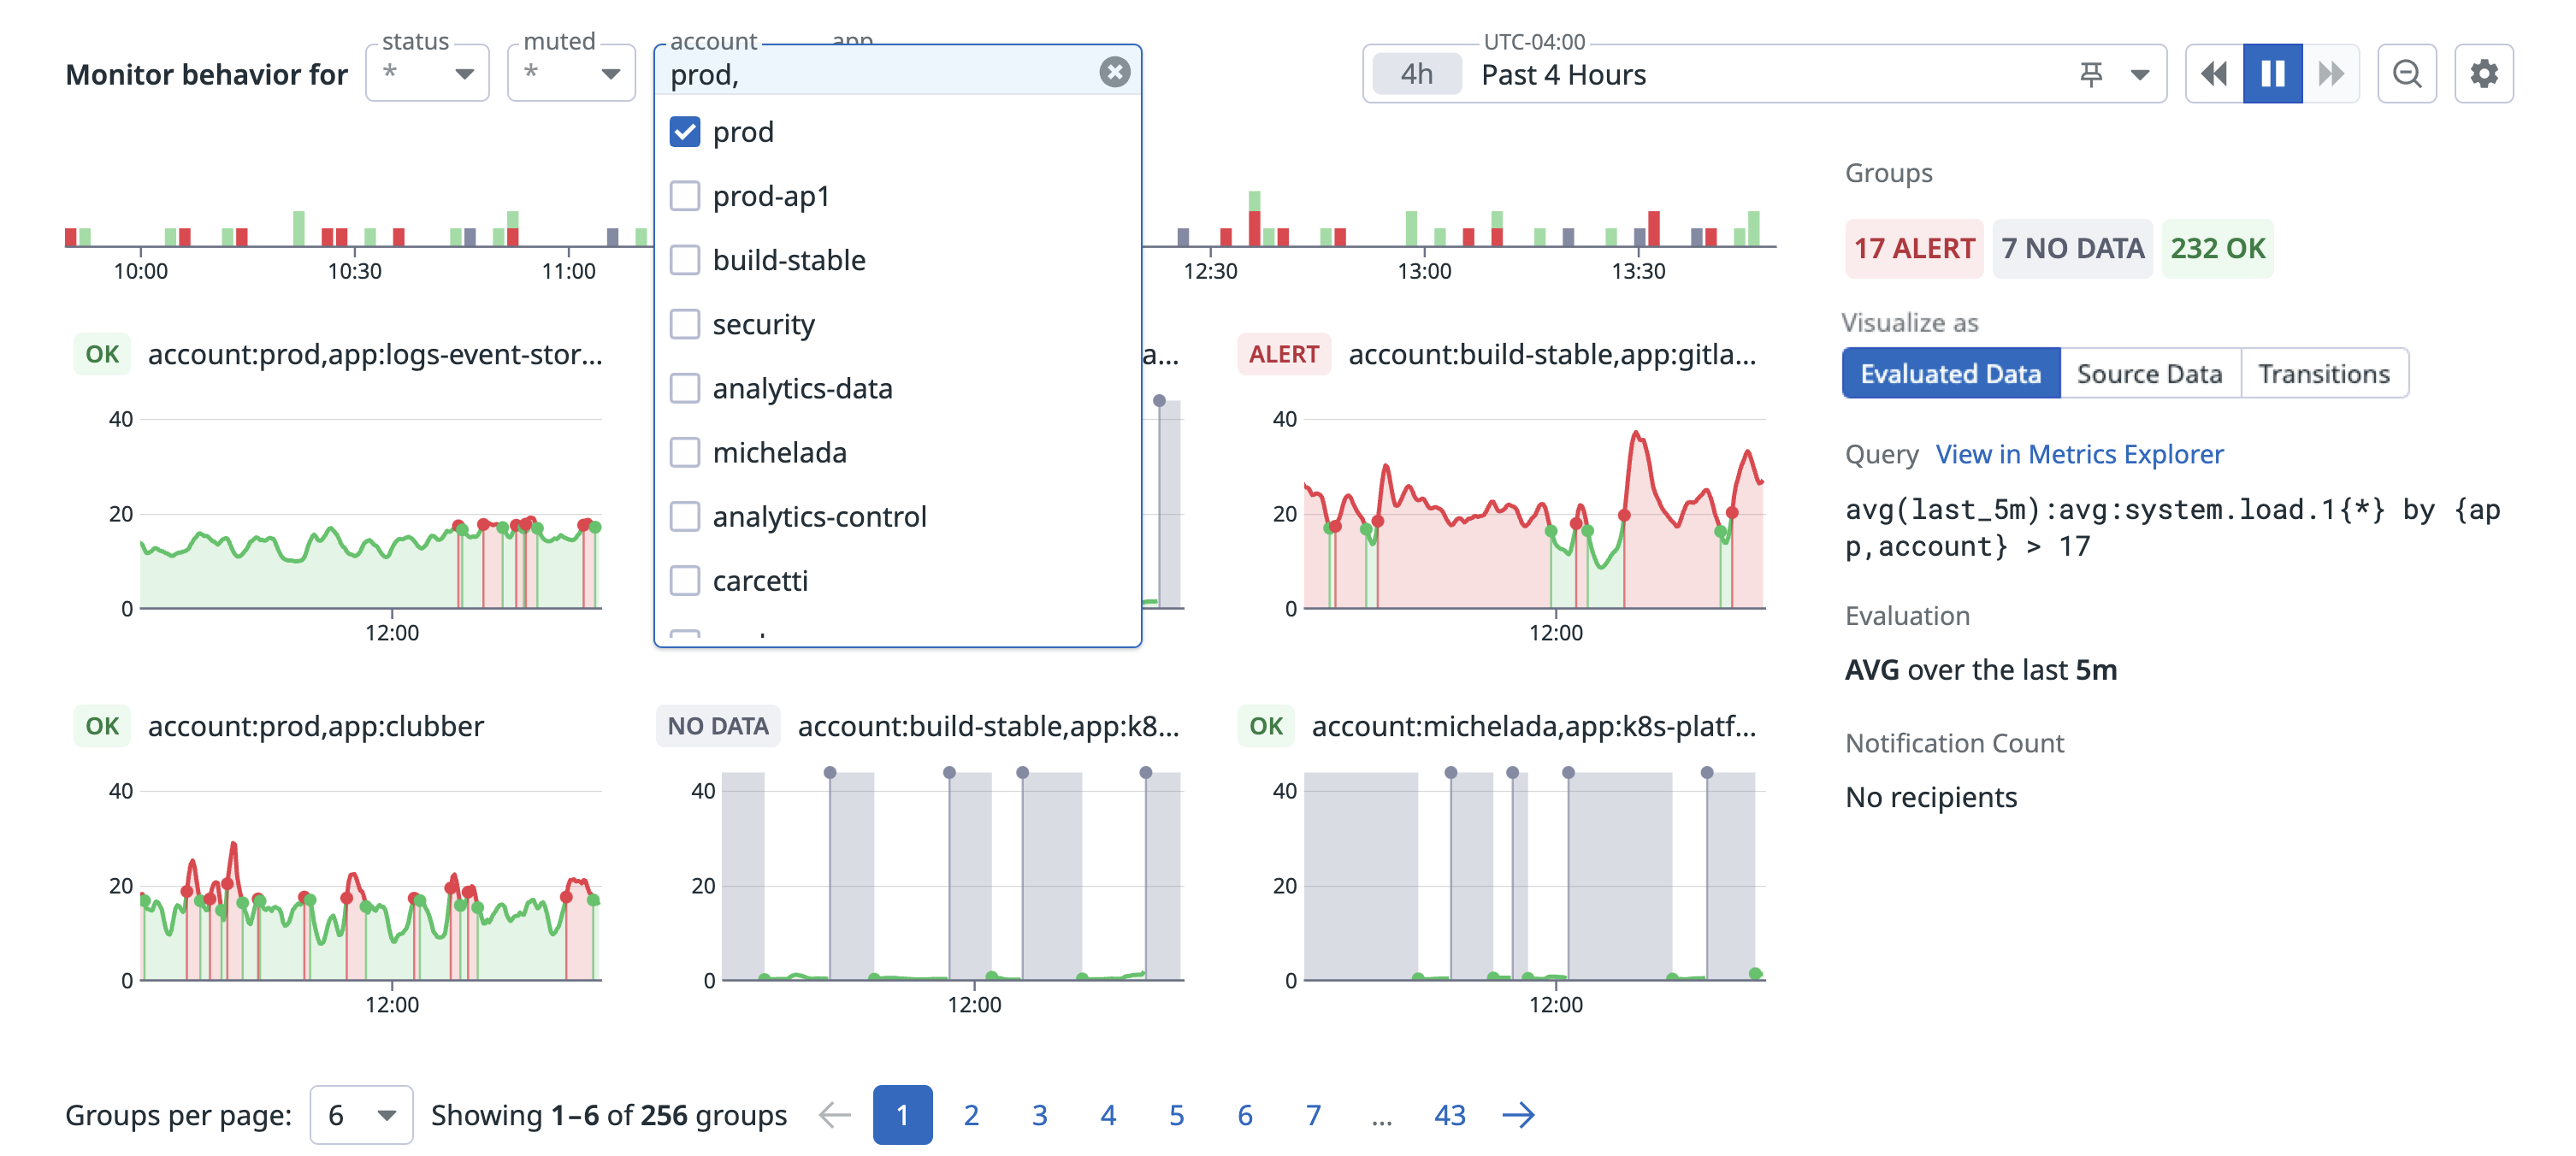
Dependiendo de la consulta, el monitor puede tener varios grupos. Para centrarte en un grupo específico, utiliza los filtros desplegables para seleccionar el grupo deseado.
Puedes elegir el contexto de la página según:
- Estado del grupo
- Sólo se mostrarán los grupos que se encuentran actualmente en el estado seleccionado.
- Estado silenciado
- Sólo se mostrarán los grupos silenciados o no.
- Nombres de grupos
- Sólo se mostrarán los grupos que tienen la etiqueta (tag) seleccionada.
Gráfico de datos evaluados
La visualización de los datos evaluados es específica del monitor y muestra los resultados de las evaluaciones individuales. Por ejemplo, si el monitor evalúa la media de los últimos 5 minutos, cada punto de datos representa la media agregada de 5 minutos en cada momento de la evaluación.
La visualización coincide con la configuración de tu monitor para mostrar el estado histórico y actual del monitor, utilizando los parámetros de las evaluaciones. Los gráficos muestran el estado por grupo.
Para ver los detalles de los cambios de estado (como un cambio de WARN a ALERT), haz clic en el evento de alerta del gráfico y consulta la sección Detalles de eventos para obtener más información.
Para filtrar la vista de un grupo individual, pasa el cursor del ratón sobre el título del grupo y haz clic en Filter to Group (Filtrar por grupo) en la información de herramientas.
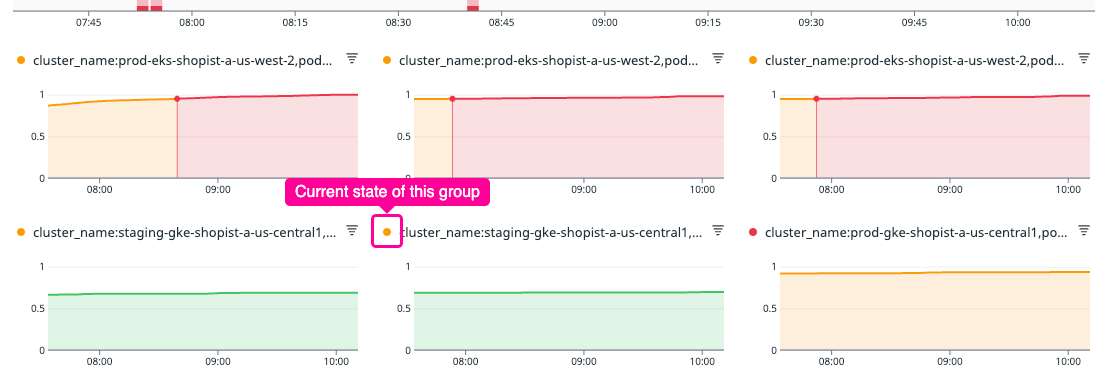
Al investigar los cambios de estado anteriores, el punto de color junto al título del grupo indica el estado actual del grupo.
Rastreo de cambios
El gráfico de seguimiento de cambios te permite ver y analizar los cambios relacionados con tu servicio y tus dependencias, que se produjeron más o menos al mismo tiempo que la alerta, ya que tales eventos son a menudo la causa de origen de los problemas.
El seguimiento de cambios admite varios cambios, como despliegues, marcas de características o modificaciones de bases de datos. Para ver la lista completa y los requisitos de configuración, consulta la documentación Change Tracking.
Gráfico de datos de origen
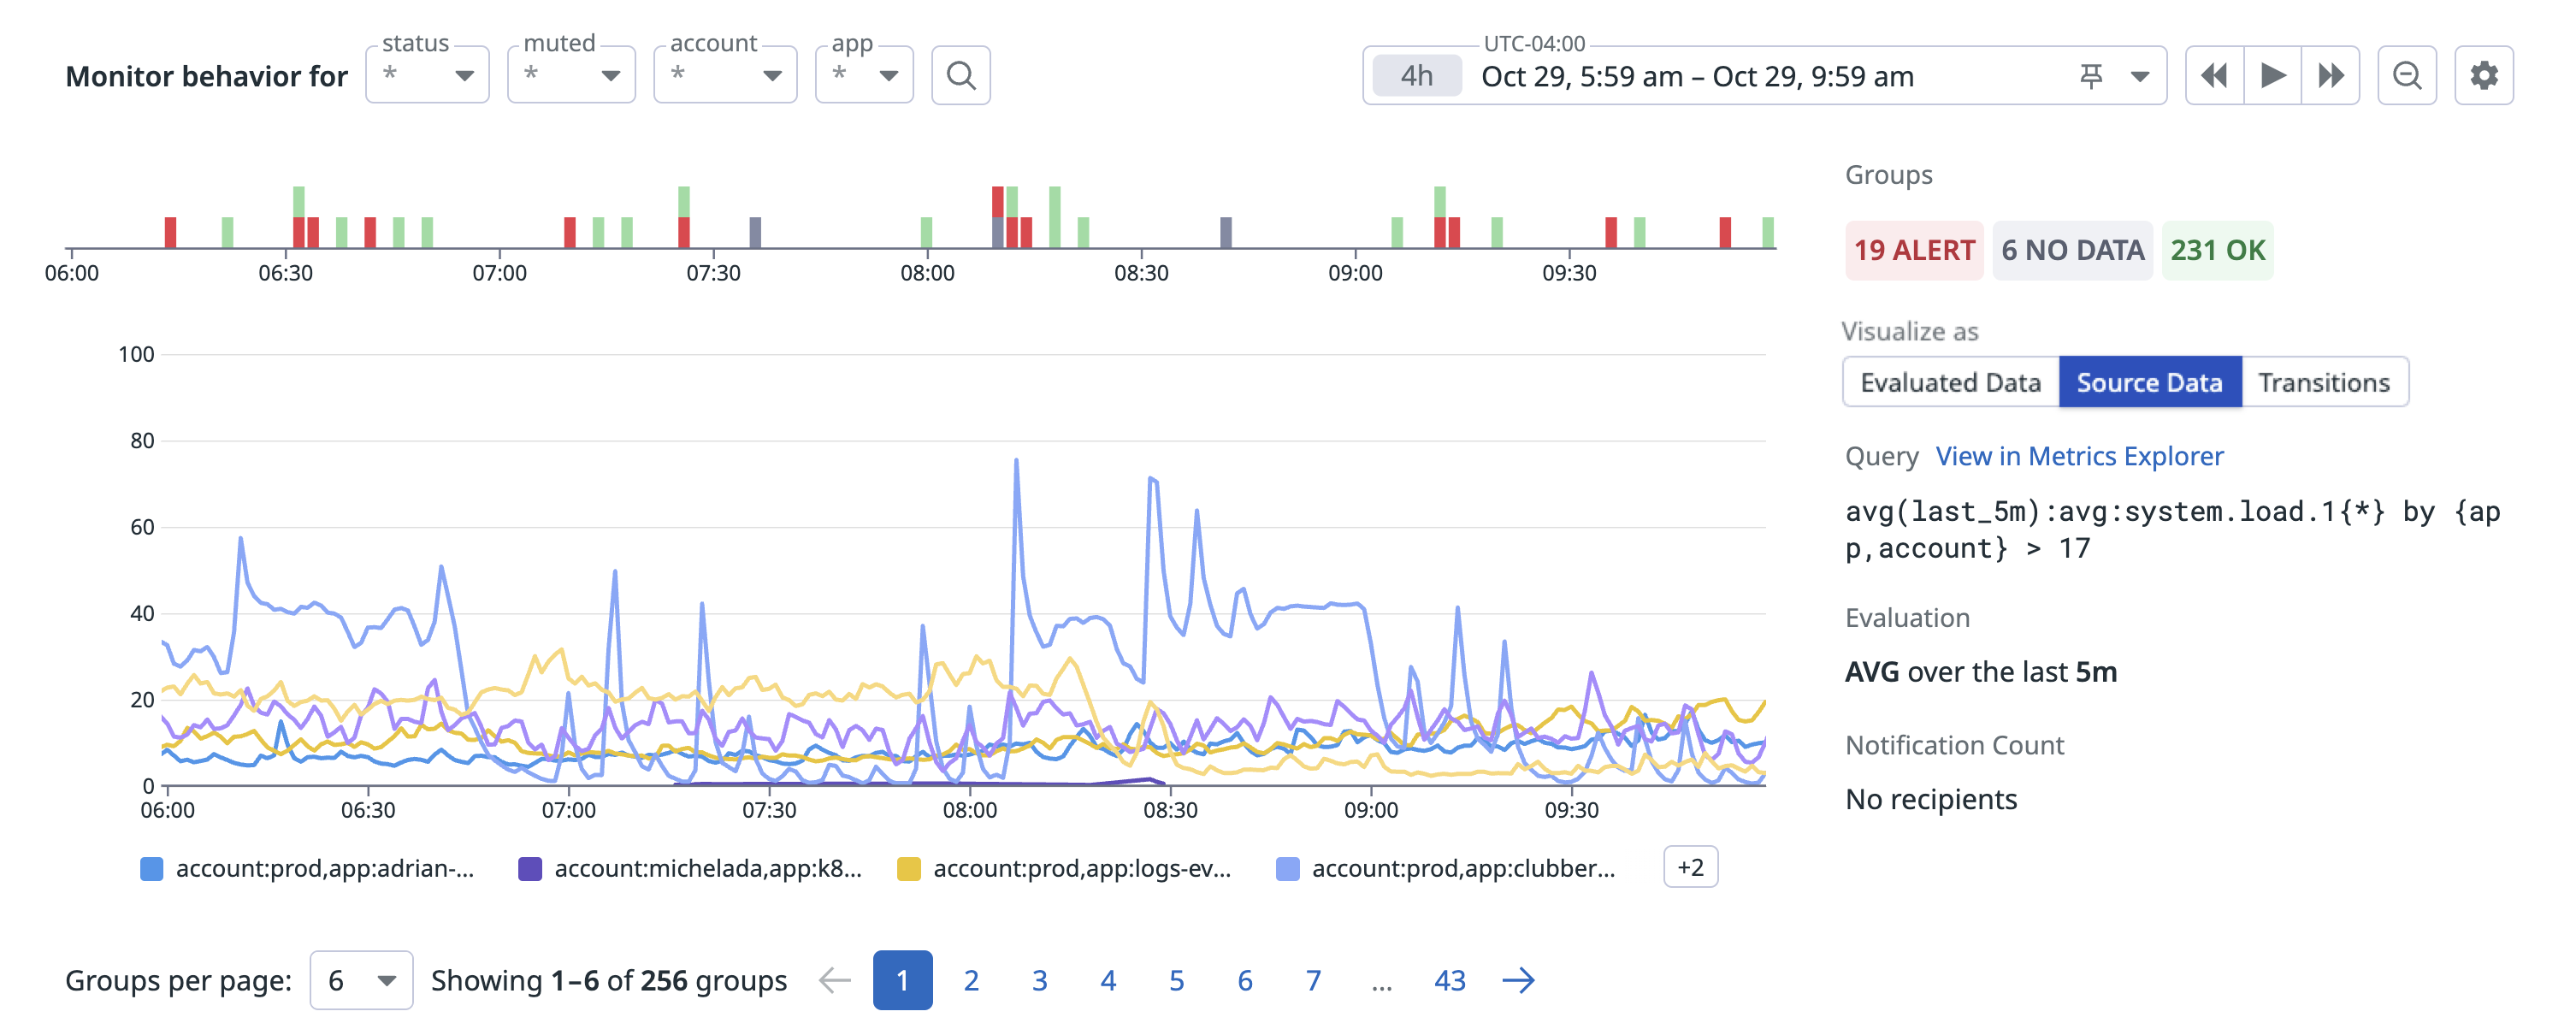
El gráfico de origen muestra una vista de la consulta de los datos subyacentes de un monitor, tal y como se vería en un dashboard o un notebook. Utiliza este gráfico para ver los datos inalterados a lo largo del tiempo y confirmar si las fluctuaciones de datos o las anomalías activan alertas.
Utiliza este gráfico para identificar cualquier discrepancia entre los datos sin procesar y las métricas esperadas, lo que puede indicar problemas de recopilación o presentación de datos que afectan al estado del monitor.
Restricciones del gráfico de datos de origen
Los siguientes tipos de monitores no son compatibles con la página de estado provisoria:
- Anomalía
- Coste de la nube
- Compuesto
- Database Monitoring
- Predicción
- Live Process
- Outlier
- Synthetics
- Alertas de SLOs
- Utilización
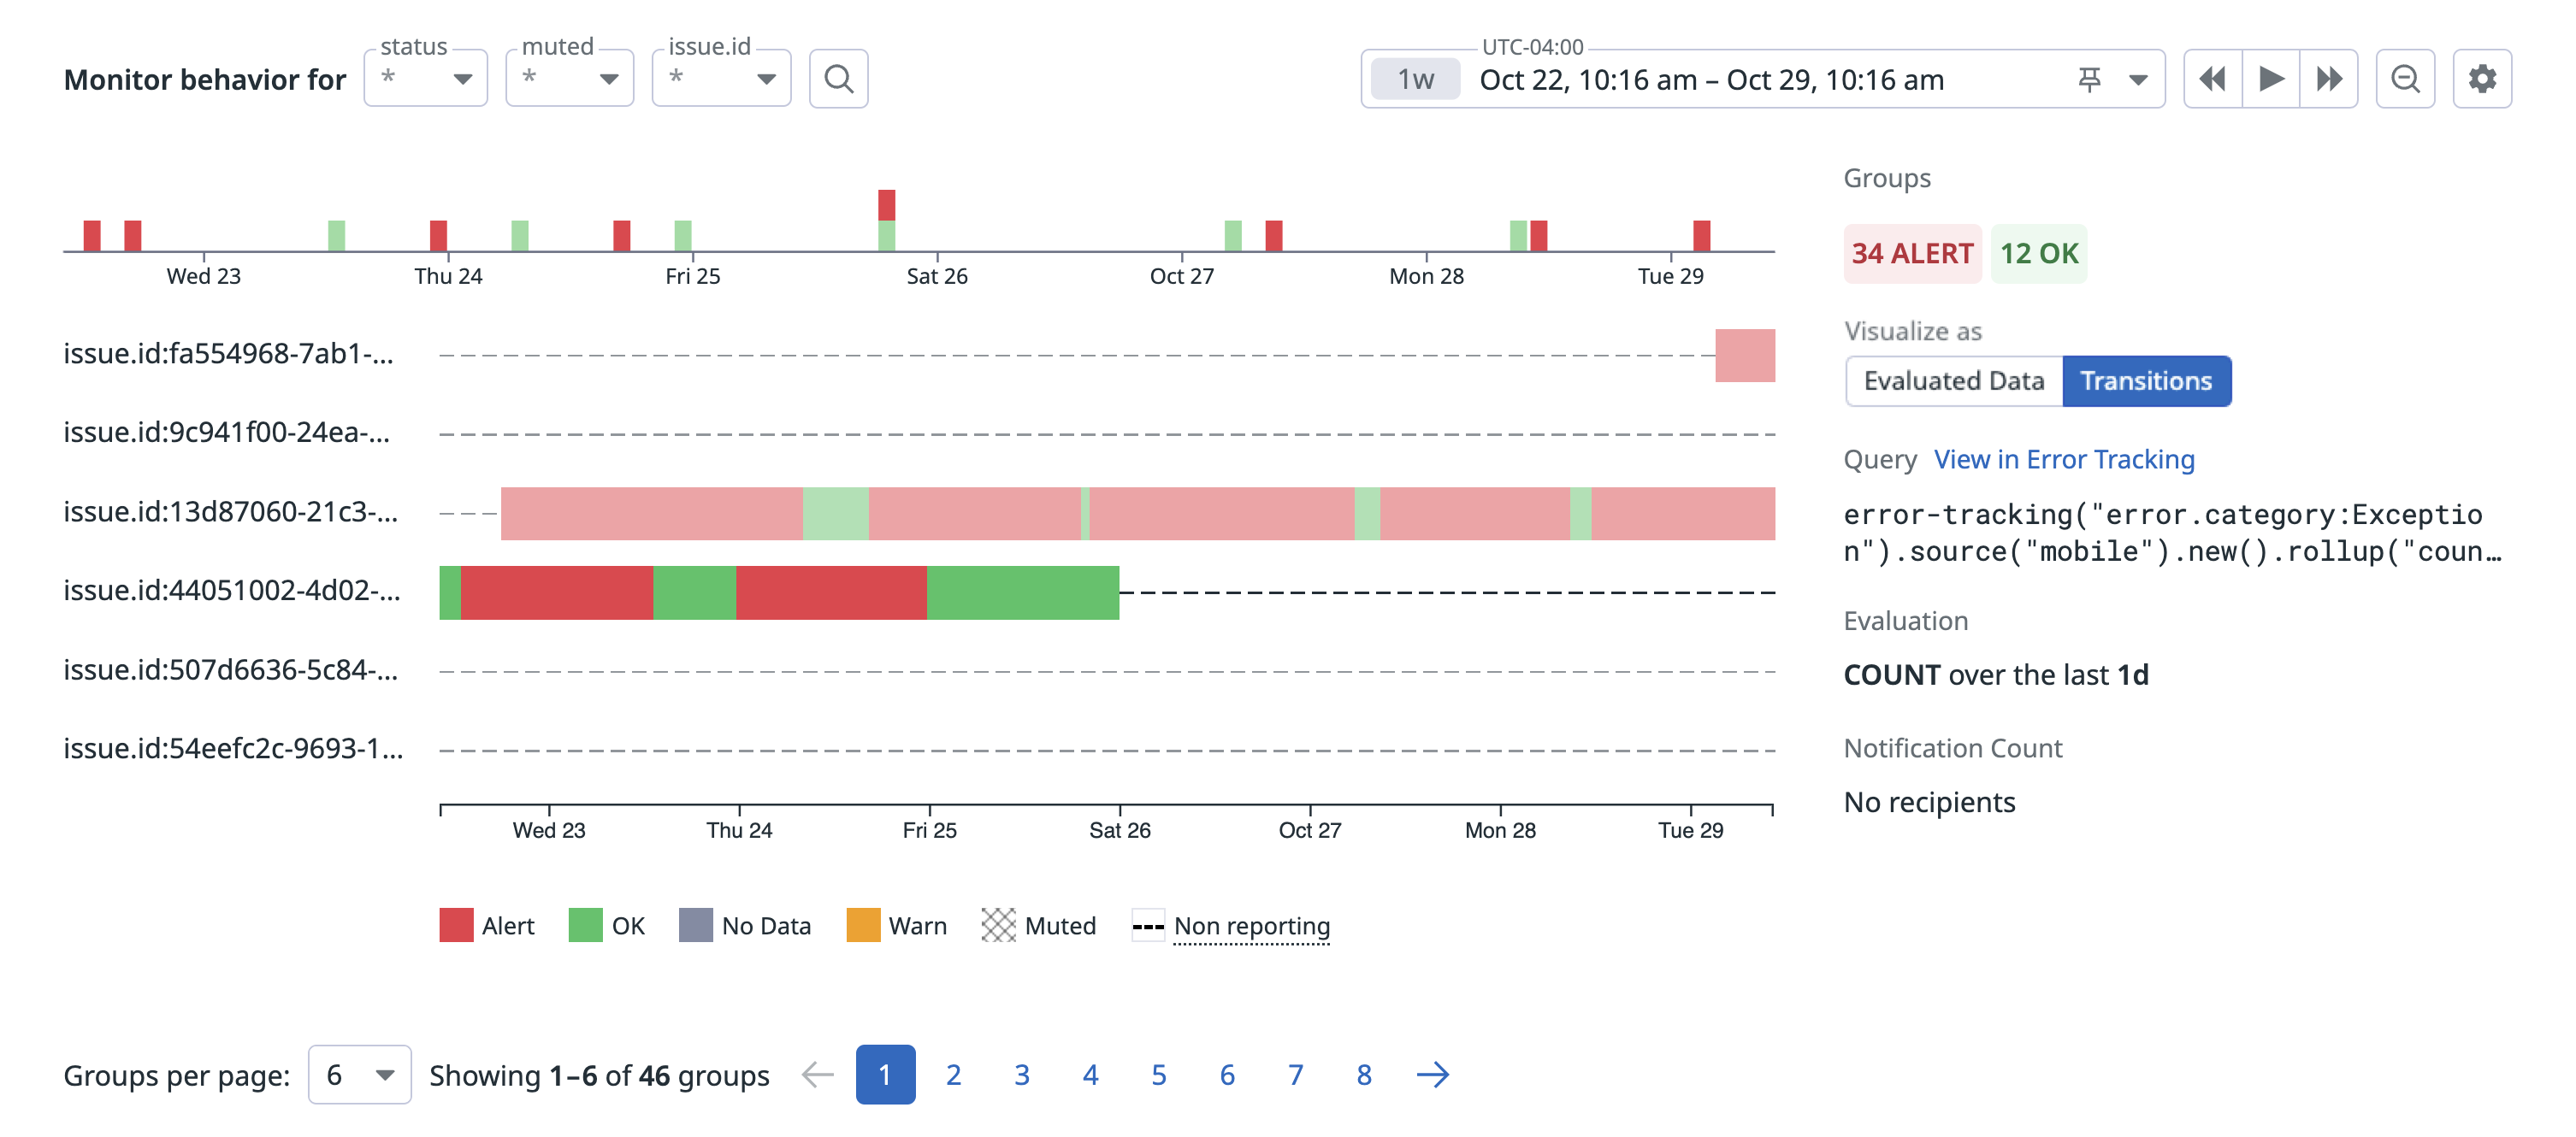
Transiciones
El gráfico de transiciones muestra las transiciones de estado de tu monitor a lo largo del tiempo, desglosadas por grupos, y muestra qué grupos están activando la alerta.
Sin notificación
Datadog conserva los grupos de monitores en la interfaz de usuario durante 24 horas, a menos que se configure de otro modo. Para obtener más información, consulta el tiempo de conservación de grupos. Una línea de puntos en el gráfico puede indicar:
- Un nuevo grupo evaluado tras la creación del monitor, representado como una línea de puntos desde el inicio del periodo de tiempo hasta su primera evaluación.
- Un grupo que dejó de notificar y luego volvió a hacerlo, con una línea de puntos que aparece desde que dejó de notificar hasta que volvió a hacerlo.
Nota: Un estado de no notificación es diferente de un estado “sin datos”. Los monitores de hosts y los checks de servicios configurados para notificar cuando faltan datos están disponibles durante 48 horas.
Referencias adicionales
Más enlaces, artículos y documentación útiles:
