Note: This documentation uses v2 of the Go tracer, which Datadog recommends for all users. If you are using v1, see the migration guide to upgrade to v2.
Data Streams Monitoring no se ha modificado entre la v1 y la v2 del rastreador.
Data Streams Monitoring uses message headers to propagate context through Kafka streams. If log.message.format.version is set in the Kafka broker configuration, it must be set to 0.11.0.0 or higher. Data Streams Monitoring is not supported for versions lower than this.
Monitoring RabbitMQ pipelines
The RabbitMQ integration can provide detailed monitoring and metrics of your RabbitMQ deployments. For full compatibility with Data Streams Monitoring, Datadog recommends configuring the integration as follows:
Configura la variable de entorno DD_DATA_STREAMS_ENABLED=true.
Instrumentación manual
Cliente de Sarama Kafka
Para instrumentar manualmente el cliente Sarama Kafka con la Monitorización de flujos de datos:
Importa la biblioteca go ddsarama
import(ddsarama"github.com/DataDog/dd-trace-go/contrib/IBM/sarama/v2")2.Wraptheproducerwith`ddsarama.WrapAsyncProducer`...config:=sarama.NewConfig()producer,err:=sarama.NewAsyncProducer([]string{bootStrapServers},config)// ADD THIS LINEproducer=ddsarama.WrapAsyncProducer(config,producer,ddsarama.WithDataStreams())
Cliente de Confluent Kafka
Para instrumentar manualmente Confluent Kafka con la Monitorización de flujos de datos:
Envuelve la creación del productor con ddkafka.NewProducer y utiliza la configuraciónddkafka.WithDataStreams()
// CREATE PRODUCER WITH THIS WRAPPERproducer,err:=ddkafka.NewProducer(&kafka.ConfigMap{"bootstrap.servers":bootStrapServers,},ddkafka.WithDataStreams())
Si un servicio consume datos de un punto y produce a otro punto, propaga el contexto entre los dos lugares utilizando la estructura de contexto de Go:
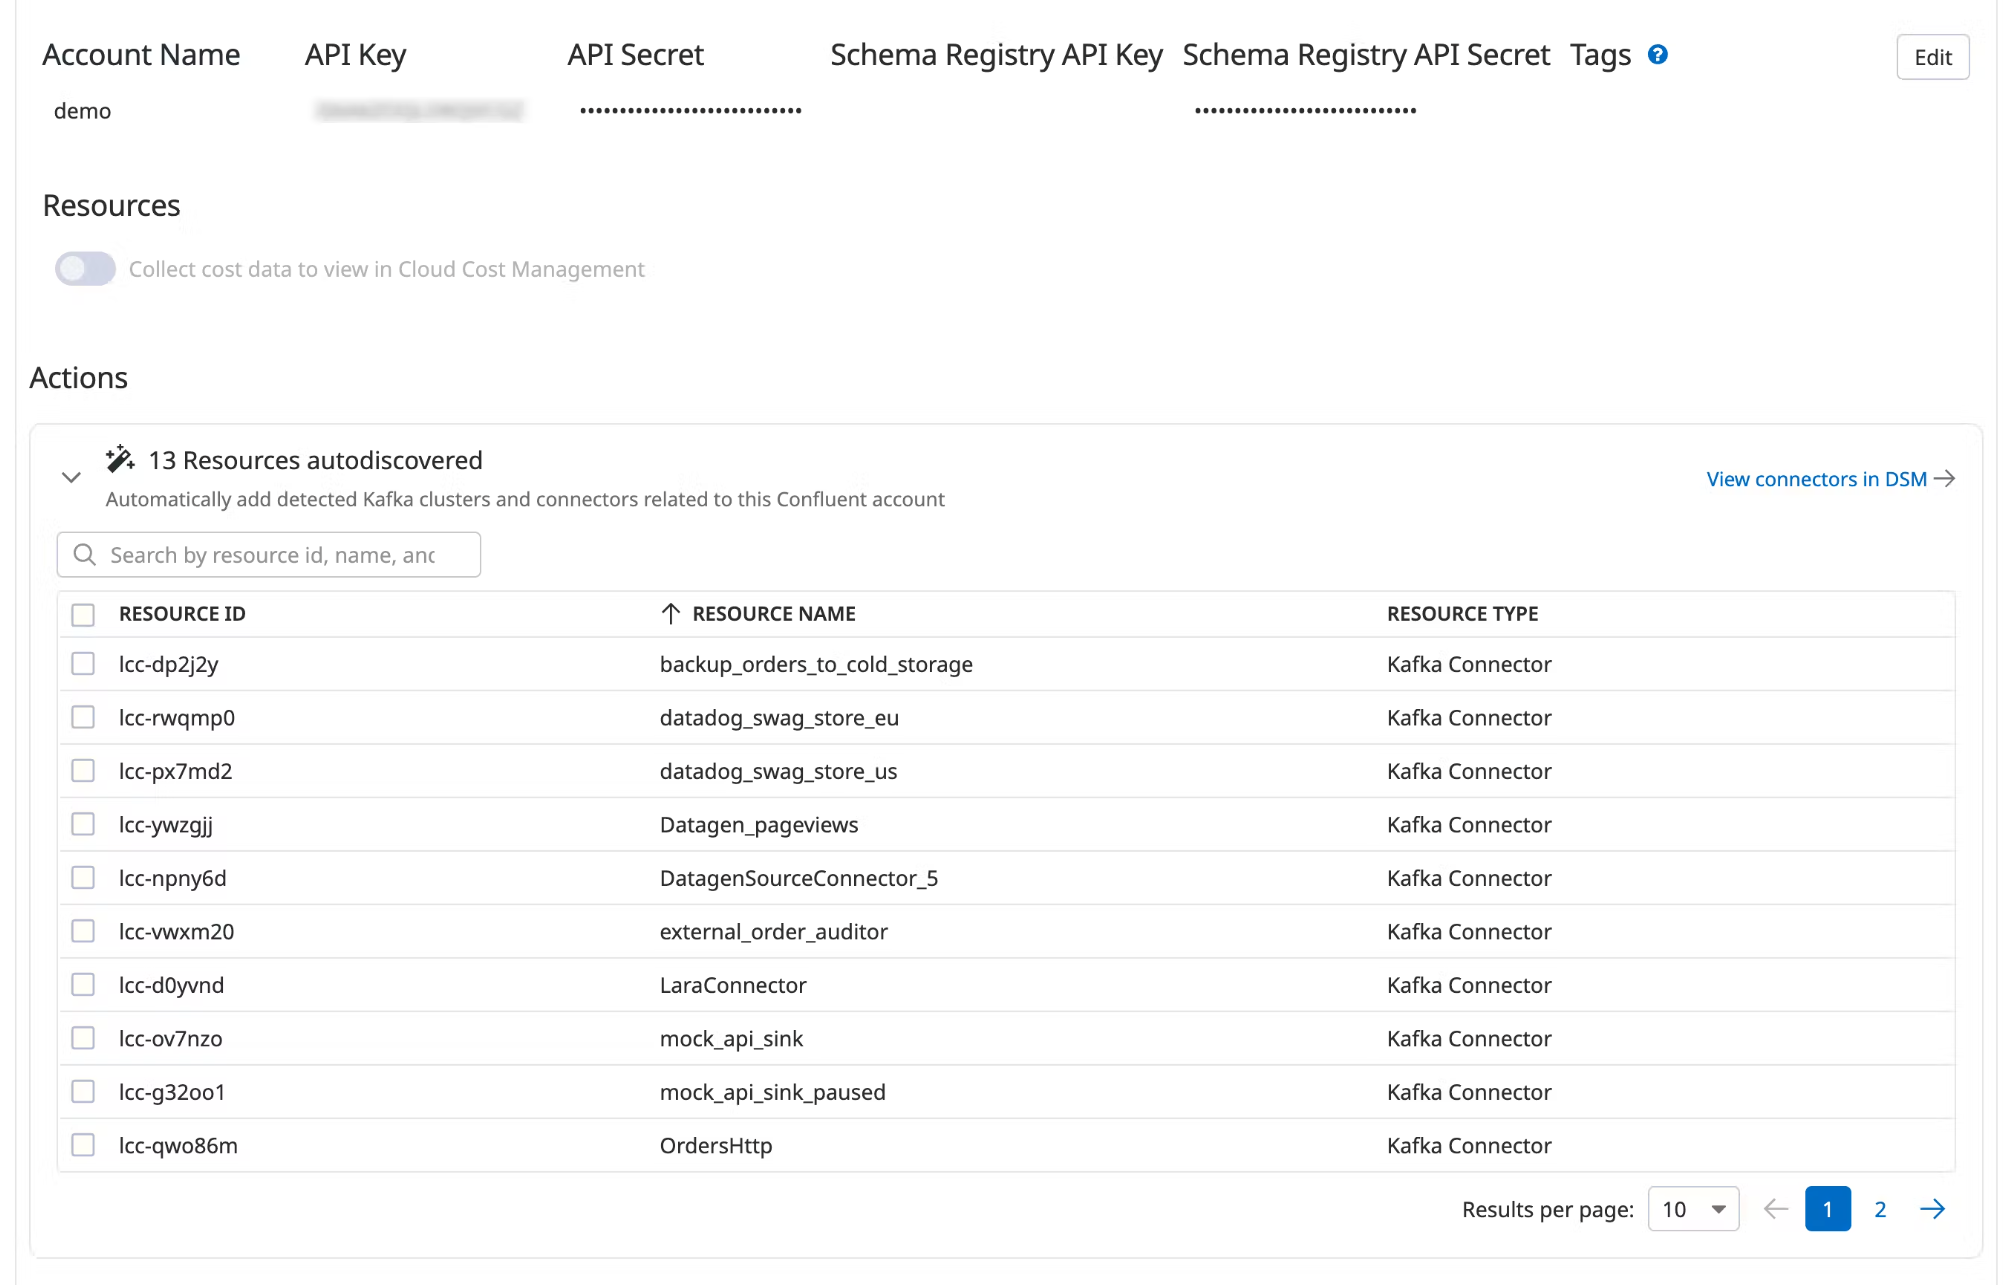
Data Streams Monitoring can automatically discover your Confluent Cloud connectors and visualize them within the context of your end-to-end streaming data pipeline.
Under Actions, a list of resources populates with detected clusters and connectors. Datadog attempts to discover new connectors every time you view this integration tile.
Select the resources you want to add.
Click Add Resources.
Navigate to Data Streams Monitoring to visualize the connectors and track connector status and throughput.