- Essentials
- Getting Started
- Agent
- API
- APM Tracing
- Containers
- Dashboards
- Database Monitoring
- Datadog
- Datadog Site
- DevSecOps
- Incident Management
- Integrations
- Internal Developer Portal
- Logs
- Monitors
- Notebooks
- OpenTelemetry
- Profiler
- Search
- Session Replay
- Security
- Serverless for AWS Lambda
- Software Delivery
- Synthetic Monitoring and Testing
- Tags
- Workflow Automation
- Learning Center
- Support
- Glossary
- Standard Attributes
- Guides
- Agent
- Integrations
- Developers
- Authorization
- DogStatsD
- Custom Checks
- Integrations
- Build an Integration with Datadog
- Create an Agent-based Integration
- Create an API-based Integration
- Create a Log Pipeline
- Integration Assets Reference
- Build a Marketplace Offering
- Create an Integration Dashboard
- Create a Monitor Template
- Create a Cloud SIEM Detection Rule
- Install Agent Integration Developer Tool
- Service Checks
- IDE Plugins
- Community
- Guides
- OpenTelemetry
- Administrator's Guide
- API
- Partners
- Datadog Mobile App
- DDSQL Reference
- CoScreen
- CoTerm
- Remote Configuration
- Cloudcraft (Standalone)
- In The App
- Dashboards
- Notebooks
- DDSQL Editor
- Reference Tables
- Sheets
- Monitors and Alerting
- Watchdog
- Metrics
- Bits AI
- Internal Developer Portal
- Error Tracking
- Change Tracking
- Service Management
- Service Level Objectives
- Incident Management
- On-Call
- Status Pages
- Event Management
- Case Management
- Actions & Remediations
- Infrastructure
- Cloudcraft
- Resource Catalog
- Universal Service Monitoring
- End User Device Monitoring
- Hosts
- Containers
- Processes
- Serverless
- Network Monitoring
- Storage Management
- Cloud Cost
- Application Performance
- APM
- APM Terms and Concepts
- Application Instrumentation
- APM Metrics Collection
- Trace Pipeline Configuration
- Correlate Traces with Other Telemetry
- Trace Explorer
- Recommendations
- Code Origin for Spans
- Service Observability
- Endpoint Observability
- Dynamic Instrumentation
- Live Debugger
- Error Tracking
- Data Security
- Guides
- Troubleshooting
- Continuous Profiler
- Database Monitoring
- Agent Integration Overhead
- Setup Architectures
- Setting Up Postgres
- Setting Up MySQL
- Setting Up SQL Server
- Setting Up Oracle
- Setting Up Amazon DocumentDB
- Setting Up MongoDB
- Connecting DBM and Traces
- Data Collected
- Exploring Database Hosts
- Exploring Query Metrics
- Exploring Query Samples
- Exploring Database Schemas
- Exploring Recommendations
- Troubleshooting
- Guides
- Data Streams Monitoring
- Data Jobs Monitoring
- Data Observability
- Digital Experience
- Real User Monitoring
- Synthetic Testing and Monitoring
- Continuous Testing
- Product Analytics
- Software Delivery
- CI Visibility
- CD Visibility
- Deployment Gates
- Test Optimization
- Code Coverage
- PR Gates
- DORA Metrics
- Feature Flags
- Security
- Security Overview
- Cloud SIEM
- Code Security
- Cloud Security
- App and API Protection
- Workload Protection
- Sensitive Data Scanner
- AI Observability
- Log Management
- Administration
Datadog Plugin for JetBrains IDEs
The Datadog extension for JetBrains IDEs is not supported for your selected Datadog site ().
Overview
The Datadog plugin for JetBrains IDEs helps improve software performance by providing code insights in the IDE based on real-time observability data. The plugin is for developers that use Datadog products including Error Tracking, Logs, Live Debugger and Code Security to monitor their services. It is available for IntelliJ IDEA, GoLand, PyCharm, WebStorm, and PhpStorm.
Requirements
- A Datadog account: The plugin requires a Datadog account. If you’re new to Datadog, go to the Datadog website to learn more about Datadog’s observability tools and sign up for a free trial.
Setup
Install the Datadog plugin
- In the IDE Settings select Plugins and search for
Datadogin the Marketplace tab. - Click Install to download and install the plugin in your IDE.
- Click Restart IDE.
Alternatively, you can install the plugin from the JetBrains Marketplace.
Log in to Datadog
After installing the Datadog plugin and restarting the IDE, log in to Datadog:
- With a file or project open in the IDE, click the Datadog tool window.
- Click Log in….
- In the browser window that opens, select your site and organization, then authorize access to the platform.
Note: For most users, one login is all that is required. If you’re using a multi-org setup, check to ensure that the correct account is active. To find out which login your IDE is using, click Settings -> Tools -> Datadog, and check which account is active.
Link a service
To provide relevant data from the Datadog platform, add related services to your project:
- With your project open in the IDE, open the Datadog tool window and select Manage Linked Services… from the Options menu.
- A settings dialog opens, click the plus icon (+).
- Search for and select the services that you want to add to the current project.
To remove a service, select it in the Services table and click the minus icon (-).
The names of linked services persist with the project when you close it.
Core features
Error Tracking
The Error Tracking integration helps you find and fix runtime errors from Error Tracking.
Click the inlay to open the Datadog tool-window and inspect details of the runtime error.
Logs
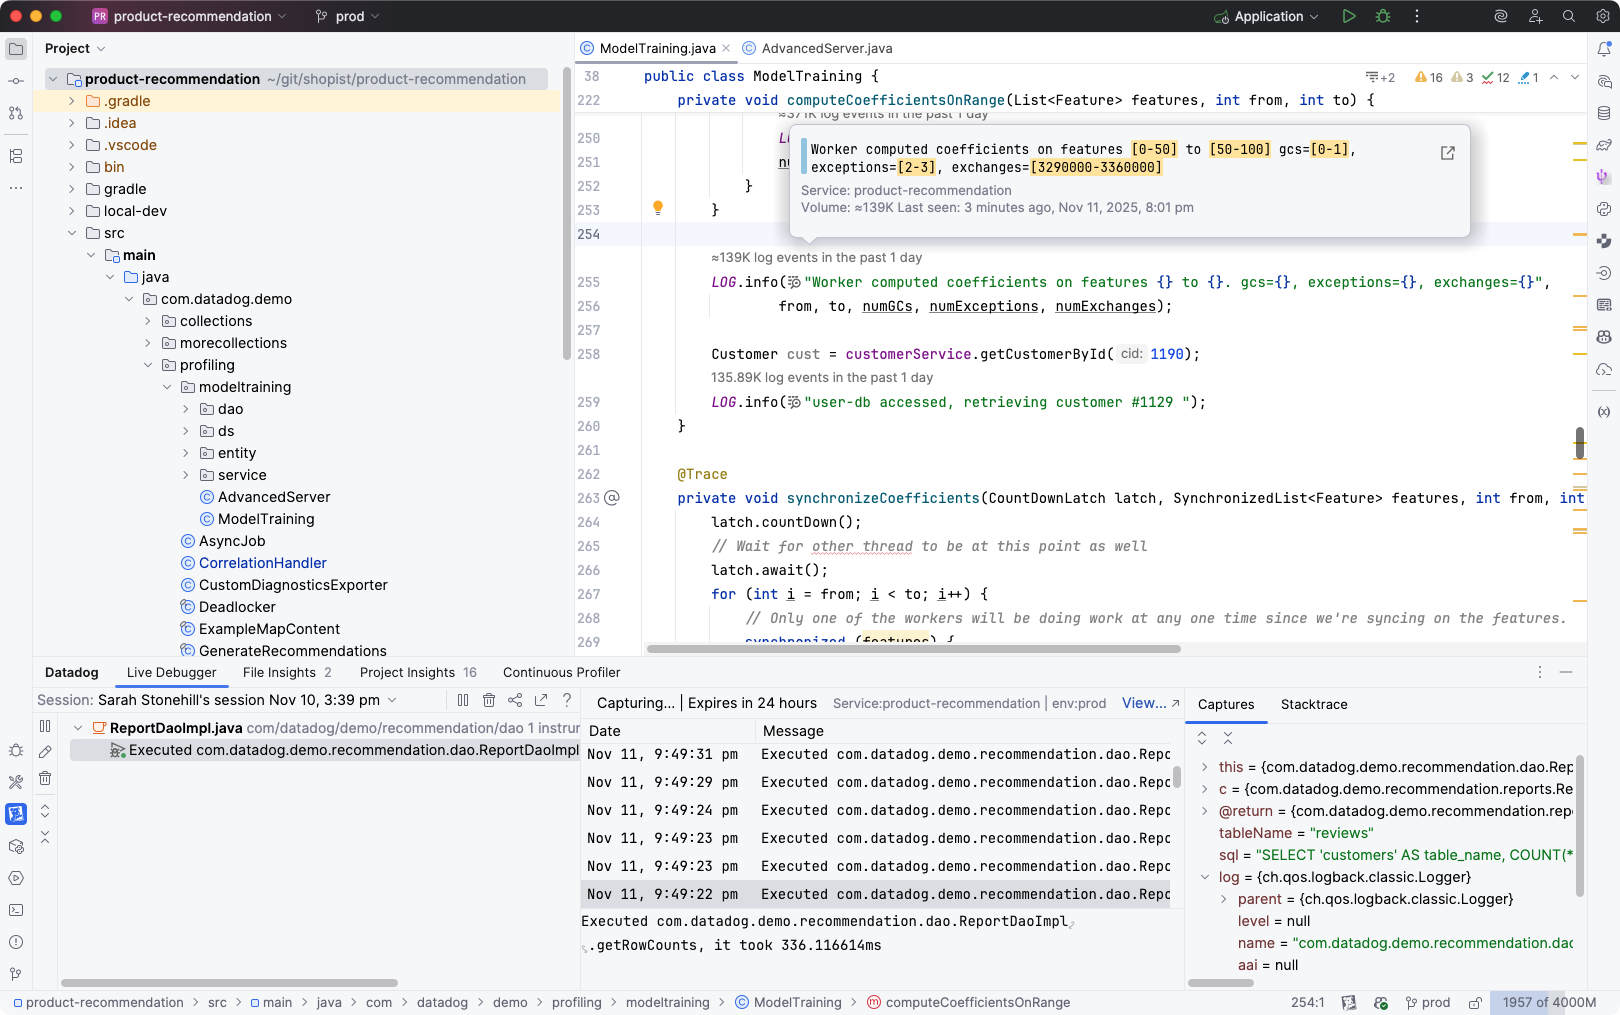
The Logs integration detects log lines in your source code, displays live event counts directly in the source editor, and provides links to the Datadog Log Explorer to view the logs generated by each log line.
Find out more in the Logs sub-section.
Live Debugger
The Live Debugger enables you to add logpoints—auto-expiring, non-breaking breakpoints—to your runtime code to collect information for debugging.
Find out more in the Live Debugger sub-section.
Code Security
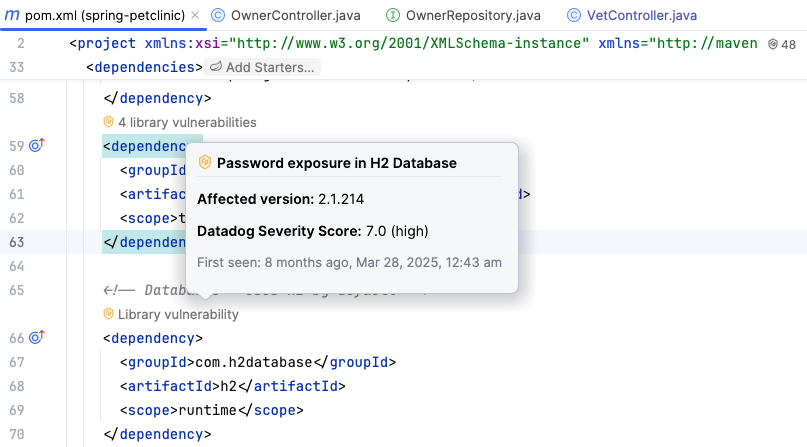
The Code Security integration promotes better security by flagging library vulnerabilities and runtime code vulnerabilities. The local code analyzer checks your code changes as you edit to detect quality and security issues prior to commit.
Find out more in the Code Security sub-section.
Other features
View in IDE
The View in IDE feature provides a link from the Datadog platform directly to the source files in your IDE. Look for the button next to frames in stack traces displayed on the platform (for example, in Error Tracking):
To make the most of this feature, ensure that Source Code Integration is configured for your service.
Code Origin for Spans
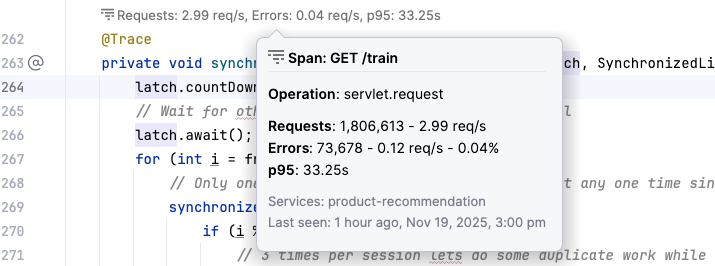
The Code Origin for Spans integration shows you metrics for entry spans at the corresponding location in your source code.
Click the inlay to open the Datadog tool window and inspect the span details.
Flaky Tests
The Flaky Tests integration shows you flaky tests detected by Test Optimization.
Click the inlay to open the Datadog tool window and inspect the test details.
CI Test Runs
You can view recent test runs in the CI Visibility Explorer by navigating directly from your source files. Look for the CI Test Run inlays above test method declarations in your source code:
Clicking the link opens the Test Runs tab showing the recent history for one test case.
Data and telemetry
Datadog collects information about your usage of this IDE, including how you interact with it, whether errors occurred while using it, and what caused those errors, in accordance with the Datadog Privacy Policy and Datadog’s EULA.
If you don’t wish to send this data to Datadog, you can disable the collection at any time in the settings: Settings > Tools > Datadog > Data Sharing and disable the Send usage statistics option.
Feedback
You can give feedback in the discussion forum, or send an e-mail to team-ide-integration@datadoghq.com.
Further reading
Additional helpful documentation, links, and articles:


