This product is not supported for your selected Datadog site. ().
Data Streams Monitoring provides a standardized method for teams to understand and manage pipelines at scale by making it easy to:
Measure pipeline health with end-to-end latencies for events traversing across your system.
Pinpoint faulty producers, consumers or queues, then pivot to related logs or clusters to troubleshoot faster.
Prevent cascading delays by equipping service owners to stop backed up events from overwhelming downstream services.
Supported languages and technologies
Data Streams Monitoring instruments Kafka clients (consumers/producers). If you can instrument your client infrastructure, you can use Data Streams Monitoring.
Java
Python
.NET
Node.js
Go
Ruby
Apache Kafka (self-hosted, Amazon MSK, Confluent Cloud, or any other hosting platform)
Amazon Kinesis
Amazon SNS
Amazon SQS
Azure Service Bus
Google Pub/Sub
IBM MQ
RabbitMQ
Data Streams Monitoring requires minimum Datadog tracer versions. See each setup page for details.
Support for OpenTelemetry
Data Streams Monitoring supports OpenTelemetry. If you have set up Datadog APM to work with OpenTelemetry, no additional setup is required to use Data Streams Monitoring. See OpenTelemetry Compatibility.
Setup
By language
By technology
Explore Data Streams Monitoring
Visualize the architecture of your streaming data pipelines
Data Streams Monitoring provides an out-of-the-box topology map, so that you can visualize data flow across your pipelines and identify producer/consumer services, queue dependencies, service ownership, and key health metrics.
Measure end-to-end pipeline health with new metrics
With Data Streams Monitoring, you can measure the time it usually takes for events to traverse between any two points in your asynchronous system:
Metric Name
Notable Tags
Description
data_streams.latency
start, end, env
End to end latency of a pathway from a specified source to destination service.
data_streams.kafka.lag_seconds
consumer_group, partition, topic, env
Lag in seconds between producer and consumer. Requires Java Agent v1.9.0 or later.
data_streams.payload_size
consumer_group, topic, env
Incoming and outgoing throughput in bytes.
You can also graph and visualize these metrics on any dashboard or notebook:
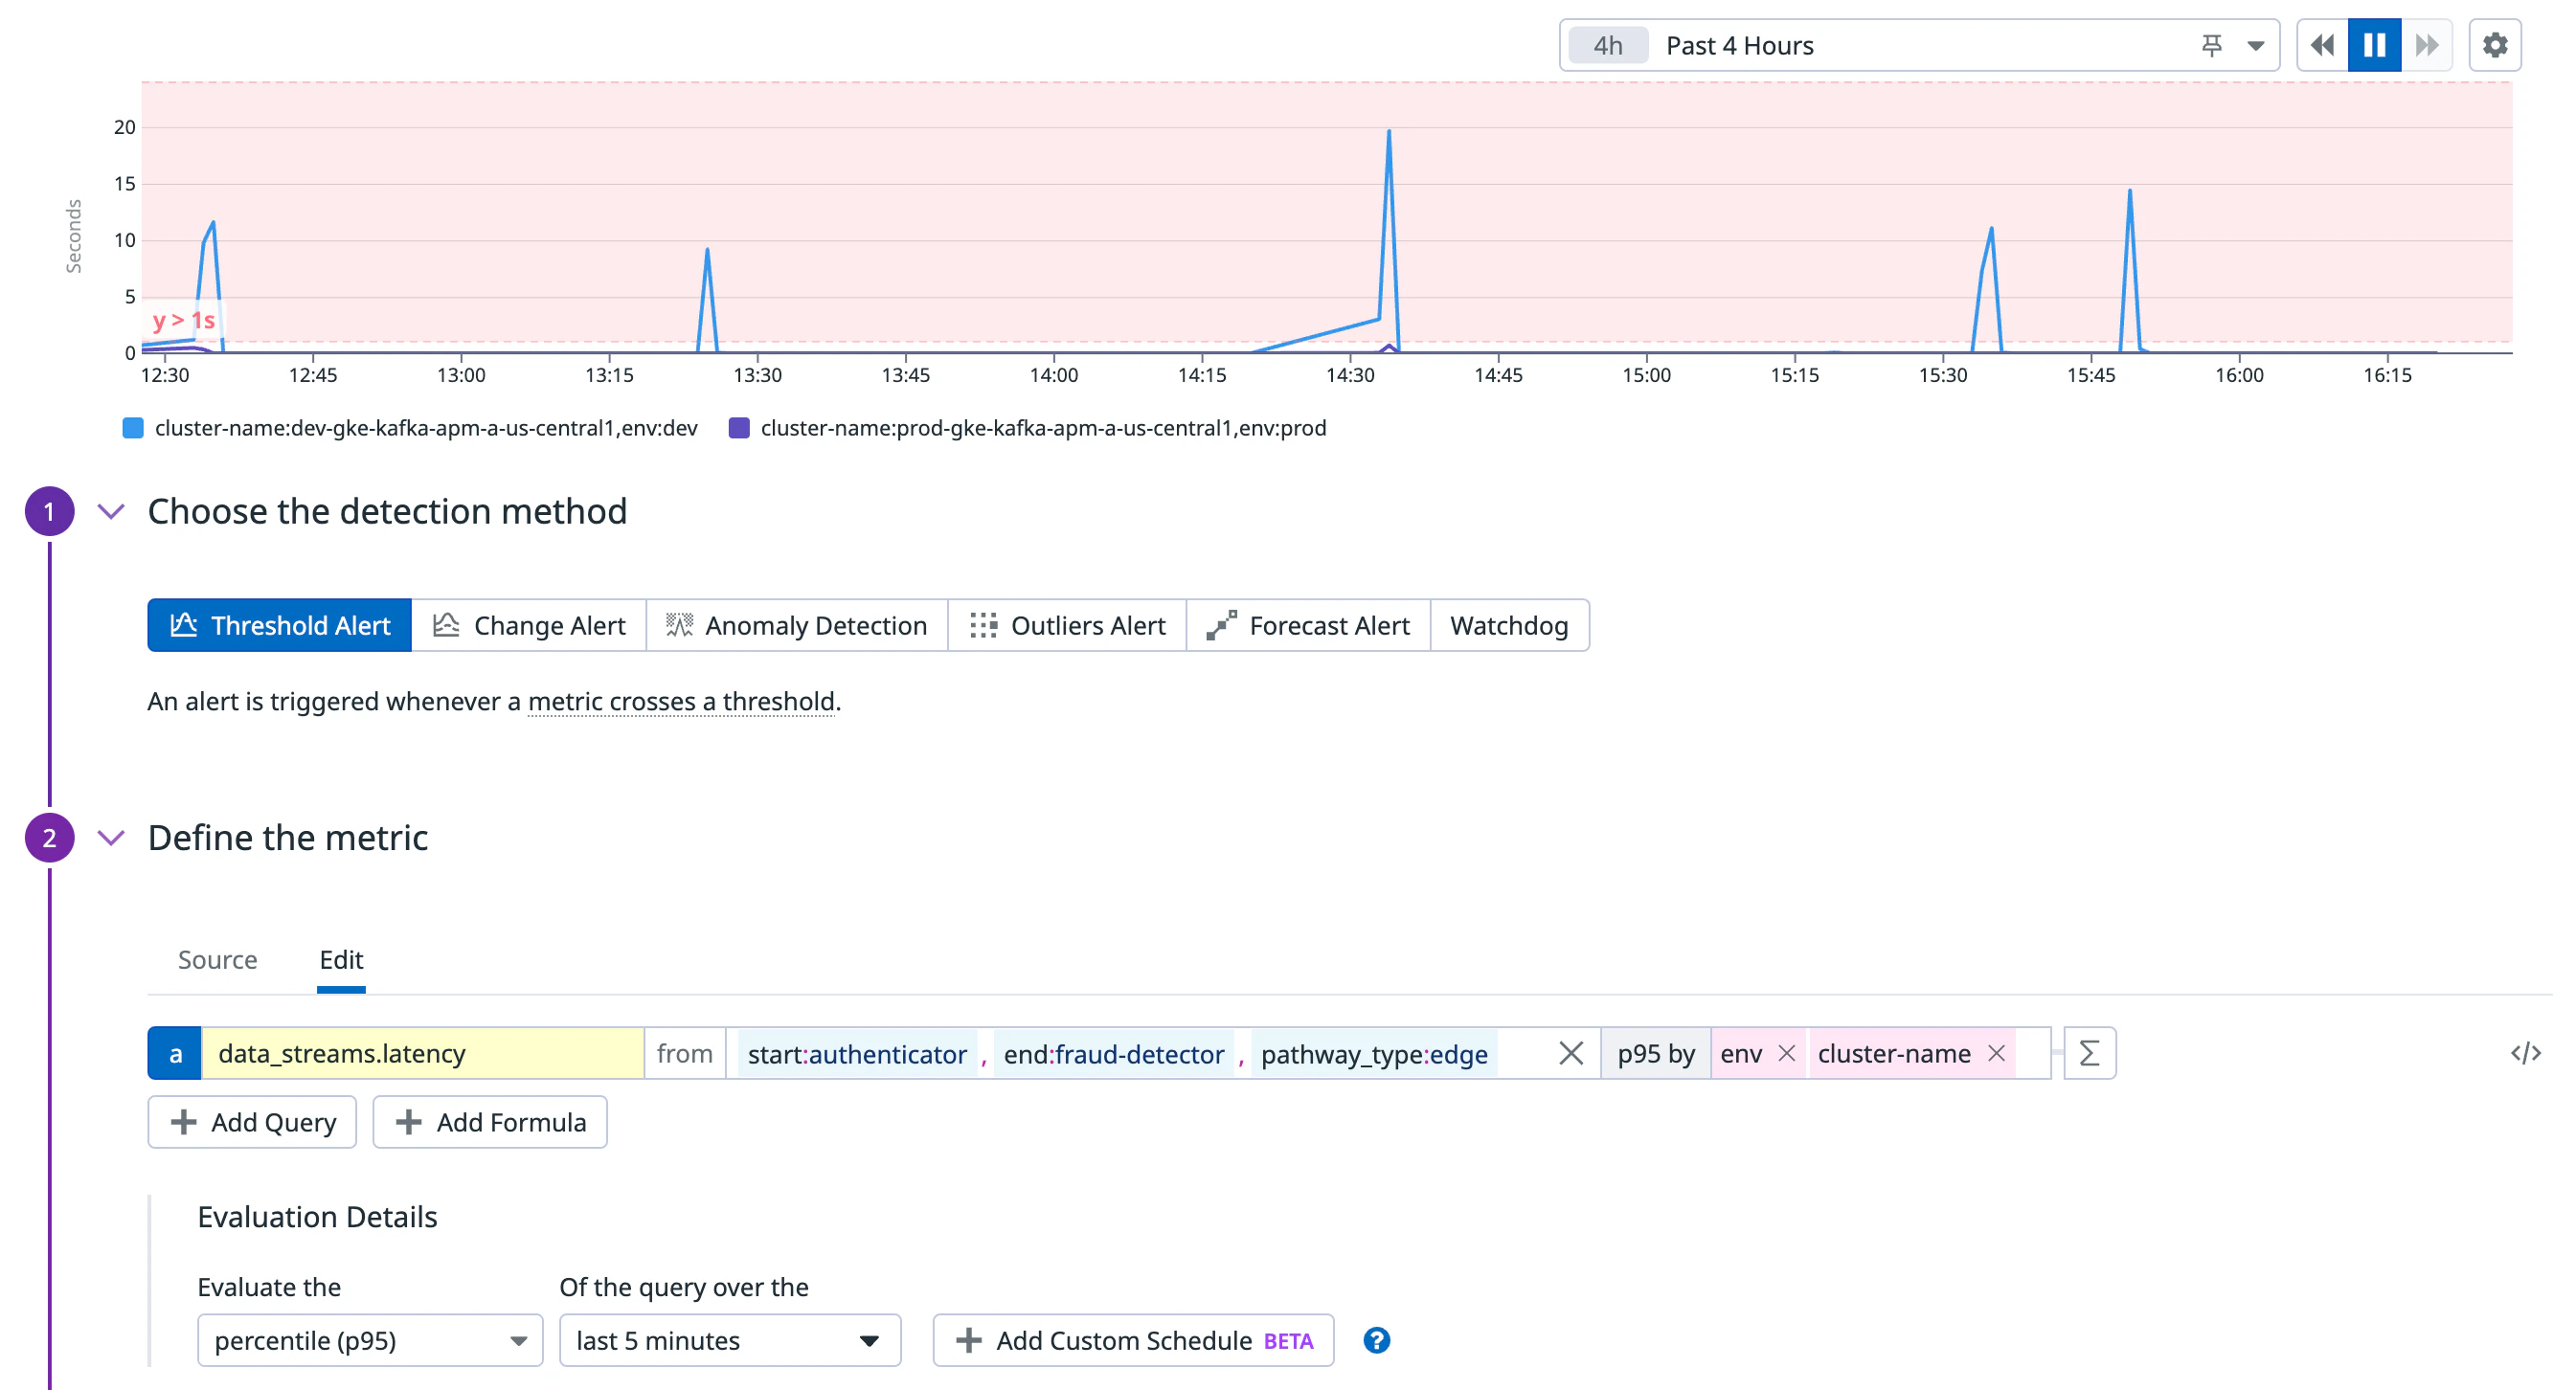
Monitor end-to-end latency of any pathway
Depending on how events traverse through your system, different paths can lead to increased latency. With the Measure tab, you can select a start service and end service for end-to-end latency information to identify bottlenecks and optimize performance. Easily create a monitor for that pathway, or export to a dashboard.
Alternatively, click a service to open a detailed side panel and view the Pathways tab for latency between the service and upstream services.
Alert on slowdowns in event-driven applications
Slowdowns caused by high consumer lag or stale messages can lead to cascading failures and increase downtime. With out-of-the-box alerts, you can pinpoint where bottlenecks occur in your pipelines and respond to them right away. For supplementary metrics, Datadog provides additional integrations for message queue technologies like Kafka and SQS.
Through Data Stream Monitoring’s out-of-the-box monitor templates, you can setup monitors on metrics like consumer lag, throughput, and latency in one click.
Click 'Add Monitors and Synthetic Tests' to view monitor templates
Attribute incoming messages to any queue, service, or cluster
High lag on a consuming service, increased resource use on a Kafka broker, and increased RabbitMQ or Amazon SQS queue size are frequently explained by changes in the way adjacent services are producing to or consuming from these entities.
Click on the Throughput tab on any service or queue in Data Streams Monitoring to quickly detect changes in throughput, and which upstream or downstream service these changes originate from. Once the Software Catalog is configured, you can immediately pivot to the corresponding team’s Slack channel or on-call engineer.
By filtering to a single Kafka, RabbitMQ, or Amazon SQS cluster, you can detect changes in incoming or outgoing traffic for all detected topics or queues running on that cluster:
Quickly pivot to identify root causes in infrastructure, logs, or traces
Datadog automatically links the infrastructure powering your services and related logs through Unified Service Tagging, so you can easily localize bottlenecks. Click the Infra, Logs or Traces tabs to further troubleshoot why pathway latency or consumer lag has increased.
Monitor connector throughput and status
Datadog can automatically detect your managed Confluent Cloud connectors and visualize them in the Data Streams Monitoring topology map. Install and configure the Confluent Cloud integration to collect information from your Confluent Cloud connectors—including throughput, status, and topic dependencies.
Further Reading
Additional helpful documentation, links, and articles: