- Agents
- Essentials
- Getting Started
- Agent
- API
- APM Tracing
- Containers
- Dashboards
- Database Monitoring
- Datadog
- Datadog Site
- DevSecOps
- Incident Management
- Integrations
- Internal Developer Portal
- Logs
- Monitors
- Notebooks
- OpenTelemetry
- Profiler
- Search
- Session Replay
- Security
- Serverless for AWS Lambda
- Software Delivery
- Synthetic Monitoring and Testing
- Tags
- Workflow Automation
- Learning Center
- Support
- Glossary
- Standard Attributes
- Guides
- Agent
- Integrations
- Extend Datadog
- Authorization
- DogStatsD
- Custom Checks
- Integrations
- Build an Integration with Datadog
- Create an Agent-based Integration
- Create an API-based Integration
- Create a Log Pipeline
- Integration Assets Reference
- Build a Marketplace Offering
- Create an Integration Dashboard
- Create a Monitor Template
- Create a Cloud SIEM Detection Rule
- Install Agent Integration Developer Tool
- Service Checks
- Community
- Guides
- OpenTelemetry
- Administrator's Guide
- API
- Partners
- Datadog Mobile App
- DDSQL Reference
- CoScreen
- CoTerm
- Remote Configuration
- Cloudcraft (Standalone)
- In The App
- Dashboards
- Notebooks
- DDSQL Editor
- Reference Tables
- Sheets
- Monitors and Alerting
- Service Level Objectives
- Metrics
- Watchdog
- Bits AI
- Internal Developer Portal
- Error Tracking
- Change Tracking
- Event Management
- Incident Response
- Actions & Remediations
- Infrastructure
- Cloudcraft
- Resource Catalog
- Universal Service Monitoring
- End User Device Monitoring
- Hosts
- Containers
- Processes
- Serverless
- Network Monitoring
- Storage Management
- Cloud Cost
- Application Performance
- APM
- Continuous Profiler
- Database Monitoring
- Agent Integration Overhead
- Setup Architectures
- Setting Up Postgres
- Setting Up MySQL
- Setting Up SQL Server
- Setting Up Oracle
- Setting Up Amazon DocumentDB
- Setting Up MongoDB
- Setting Up ClickHouse
- Connecting DBM and Traces
- Data Collected
- Exploring Database Hosts
- Exploring Query Metrics
- Exploring Query Samples
- Exploring Database Schemas
- Exploring Recommendations
- Troubleshooting
- Guides
- Data Streams Monitoring
- Data Observability
- Digital Experience
- Real User Monitoring
- Synthetic Testing and Monitoring
- Continuous Testing
- Experiments
- Product Analytics
- Session Replay
- Software Delivery
- CI Visibility
- CD Visibility
- Deployment Gates
- Test Optimization
- Code Coverage
- PR Gates
- DORA Metrics
- Feature Flags
- Developer Integrations
- Security
- Security Overview
- Cloud SIEM
- Code Security
- Cloud Security
- App and API Protection
- AI Guard
- Workload Protection
- Sensitive Data Scanner
- AI Observability
- Log Management
- Observability Pipelines
- Configuration
- Sources
- Processors
- Destinations
- Packs
- Akamai CDN
- Amazon CloudFront
- Amazon VPC Flow Logs
- AWS Application Load Balancer Logs
- AWS CloudTrail
- AWS Elastic Load Balancer Logs
- AWS Network Load Balancer Logs
- Cisco ASA
- Cloudflare
- F5
- Fastly
- Fortinet Firewall
- HAProxy Ingress
- Istio Proxy
- Juniper SRX Firewall Traffic Logs
- Netskope
- NGINX
- Okta
- Palo Alto Firewall
- Windows XML
- ZScaler ZIA DNS
- Zscaler ZIA Firewall
- Zscaler ZIA Tunnel
- Zscaler ZIA Web Logs
- Search Syntax
- Scaling and Performance
- Monitoring and Troubleshooting
- Guides and Resources
- Log Management
- CloudPrem
- Administration
Schema Tracking
This product is not supported for your selected Datadog site. ().
Data Streams Monitoring provides visibility into schemas used by producers and consumers, and how schema issues impact downstream services. You can track new schemas added, schemas with errors, and schema evolutions to manage schema migrations and identify issues.
Changing a schema produced by a service without updating the consumer can lead to the consumer struggling to process payloads, blocking further data flow downstream. Understanding schema changes ensures data compatibility between producers and consumers, and ultimately prevents issues.
Prerequisites
You must have Data Streams Monitoring installed on the producer and consumer services.
Supported languages
| Avro | Protobuf | Minimal tracer version | |
|---|---|---|---|
| Java | v1.36+ | ||
| Node.js | v5.24+ or v4.48+ | ||
| Python | v2.14+ | ||
| .NET | v3.15+ | ||
| Golang |
View schemas
Schema list
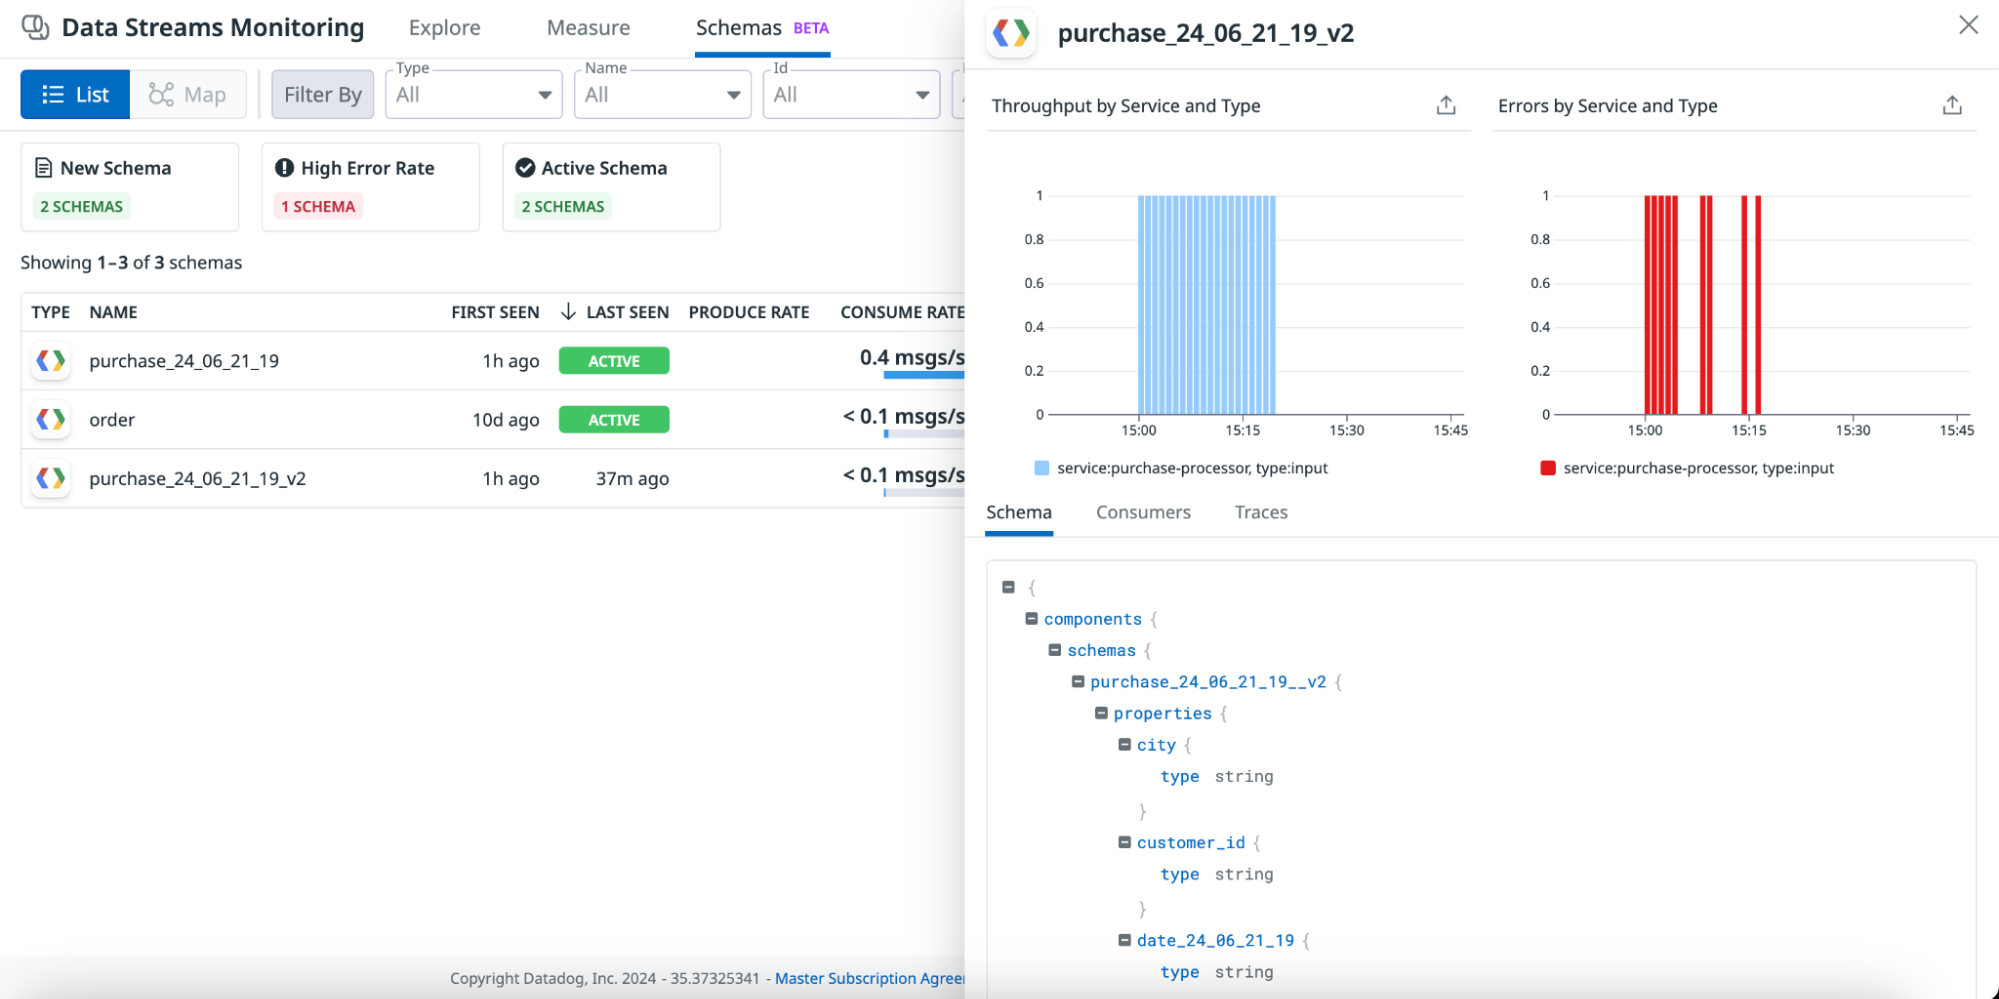
In the schema list, you can view all schemas used across your pipelines.
For each schema, the table shows the following:
- Type
- Name
- First and last seen
- Produce rate, consume rate, and error rate in the selected time frame
- All producers and consumers of the schema
- Consumer lag: the max Kafka lag for all consumers of a specific schema
Selecting a schema from the list displays the throughput of the schema by service, errors by service, and the full schema.
Use the following steps to view detailed information about a schema:
- Navigate to Data Streams Monitoring.
- Click the Schemas tab.
- Select the time frame.
- Use the quick filters to filter for new schemas (first seen within the last 3 hours), schemas with high error rates, or active schemas.
- Select a schema. A side panel opens with detailed information for that schema.
At the service level
For each service you track in Data Streams Monitoring, you can see information about the schemas that it uses.
To view schema information at the service level:
- Navigate to Data Streams Monitoring.
- Ensure the Explore tab is selected.
- Click on a service. The service detail side panel appears.
- Select the Schemas tab.
On the schemas tab, you can:
- View input throughput by schema.
- View a list of all schemas detected within the selected time frame, along with when it was first and last seen, its type (input or output schema), error rate, and throughput.
- Expand a schema to view all of its fields.


