- Essentials
- Getting Started
- Agent
- API
- APM Tracing
- Containers
- Dashboards
- Database Monitoring
- Datadog
- Datadog Site
- DevSecOps
- Incident Management
- Integrations
- Internal Developer Portal
- Logs
- Monitors
- Notebooks
- OpenTelemetry
- Profiler
- Search
- Session Replay
- Security
- Serverless for AWS Lambda
- Software Delivery
- Synthetic Monitoring and Testing
- Tags
- Workflow Automation
- Learning Center
- Support
- Glossary
- Standard Attributes
- Guides
- Agent
- Integrations
- Developers
- Authorization
- DogStatsD
- Custom Checks
- Integrations
- Build an Integration with Datadog
- Create an Agent-based Integration
- Create an API-based Integration
- Create a Log Pipeline
- Integration Assets Reference
- Build a Marketplace Offering
- Create an Integration Dashboard
- Create a Monitor Template
- Create a Cloud SIEM Detection Rule
- Install Agent Integration Developer Tool
- Service Checks
- IDE Plugins
- Community
- Guides
- OpenTelemetry
- Administrator's Guide
- API
- Partners
- Datadog Mobile App
- DDSQL Reference
- CoScreen
- CoTerm
- Remote Configuration
- Cloudcraft (Standalone)
- In The App
- Dashboards
- Notebooks
- DDSQL Editor
- Reference Tables
- Sheets
- Monitors and Alerting
- Watchdog
- Metrics
- Bits AI
- Internal Developer Portal
- Error Tracking
- Change Tracking
- Service Management
- Service Level Objectives
- Incident Management
- On-Call
- Status Pages
- Event Management
- Case Management
- Actions & Remediations
- Infrastructure
- Cloudcraft
- Resource Catalog
- Universal Service Monitoring
- End User Device Monitoring
- Hosts
- Containers
- Processes
- Serverless
- Network Monitoring
- Storage Management
- Cloud Cost
- Application Performance
- APM
- APM Terms and Concepts
- Application Instrumentation
- APM Metrics Collection
- Trace Pipeline Configuration
- Correlate Traces with Other Telemetry
- Trace Explorer
- Recommendations
- Code Origin for Spans
- Service Observability
- Endpoint Observability
- Dynamic Instrumentation
- Live Debugger
- Error Tracking
- Data Security
- Guides
- Troubleshooting
- Continuous Profiler
- Database Monitoring
- Agent Integration Overhead
- Setup Architectures
- Setting Up Postgres
- Setting Up MySQL
- Setting Up SQL Server
- Setting Up Oracle
- Setting Up Amazon DocumentDB
- Setting Up MongoDB
- Connecting DBM and Traces
- Data Collected
- Exploring Database Hosts
- Exploring Query Metrics
- Exploring Query Samples
- Exploring Database Schemas
- Exploring Recommendations
- Troubleshooting
- Guides
- Data Streams Monitoring
- Data Jobs Monitoring
- Data Observability
- Digital Experience
- Real User Monitoring
- Synthetic Testing and Monitoring
- Continuous Testing
- Product Analytics
- Software Delivery
- CI Visibility
- CD Visibility
- Deployment Gates
- Test Optimization
- Code Coverage
- PR Gates
- DORA Metrics
- Feature Flags
- Security
- Security Overview
- Cloud SIEM
- Code Security
- Cloud Security
- App and API Protection
- Workload Protection
- Sensitive Data Scanner
- AI Observability
- Log Management
- Administration
Investigate Alerts
This product is not supported for your selected Datadog site. ().
Get started with alert investigations
You can investigate alerts with Bits AI SRE in two ways:
- Manually: Trigger an investigation on an individual monitor alert
- Automatically: Configure monitors so Bits run an investigation whenever they alert
Manually start an investigation
You can manually invoke Bits on an individual monitor alert or warn event from several entry points:
Option 1: Bits AI SRE Monitors list
- Go to Bits AI SRE > Monitors > Supported.
- Click the Investigate Recent Alerts dropdown and select an alert.
Option 2: Monitor Status page
- For a monitor that is ready for Bits, navigate to its status page and click Investigate with Bits AI SRE in the top-right corner.
- Alternatively, select an alert from the event timeline and click Investigate with Bits AI SRE on the right.
Option 3: Monitor Event side panel
From the monitor event side panel, click Investigate with Bits AI SRE.
Option 4: Slack
In Slack, reply to a monitor notification with @Datadog Investigate this alert.
Enable automatic investigations
You can configure monitors so Bits runs automatically whenever they transition to the alert state:
Option 1: Bits AI SRE Monitors list
- Go to Bits AI SRE > Monitors > Supported.
- Toggle Enable under Automatic investigations for a single monitor, or bulk-edit multiple monitors by selecting a set of monitors, followed by Edit automatic investigations.
Option 2: Configure for a single monitor
- Open the monitor’s status page and click Edit.
- Scroll to Configure notifications & automations and toggle Investigate with Bits AI SRE.
Note: Enabling automatic investigations using the Datadog API or Terraform is not supported.
An investigation initiates when a monitor transitions to the alert state. Transitions to the warn or no data state, renotifications, and test notifications do not trigger automatic investigations.
Supported monitors
Prior to general availability, monitor requirements may change.
Bits is able to run investigations on the following monitor types:
- Metric
- Anomaly
- Forecast
- Integration
- Outlier
- Logs
- APM (
APM Metricstype only)
Best practices: Add investigation context to your monitors
Think of onboarding Bits as you would a new teammate: the more context you provide, the better it can investigate.
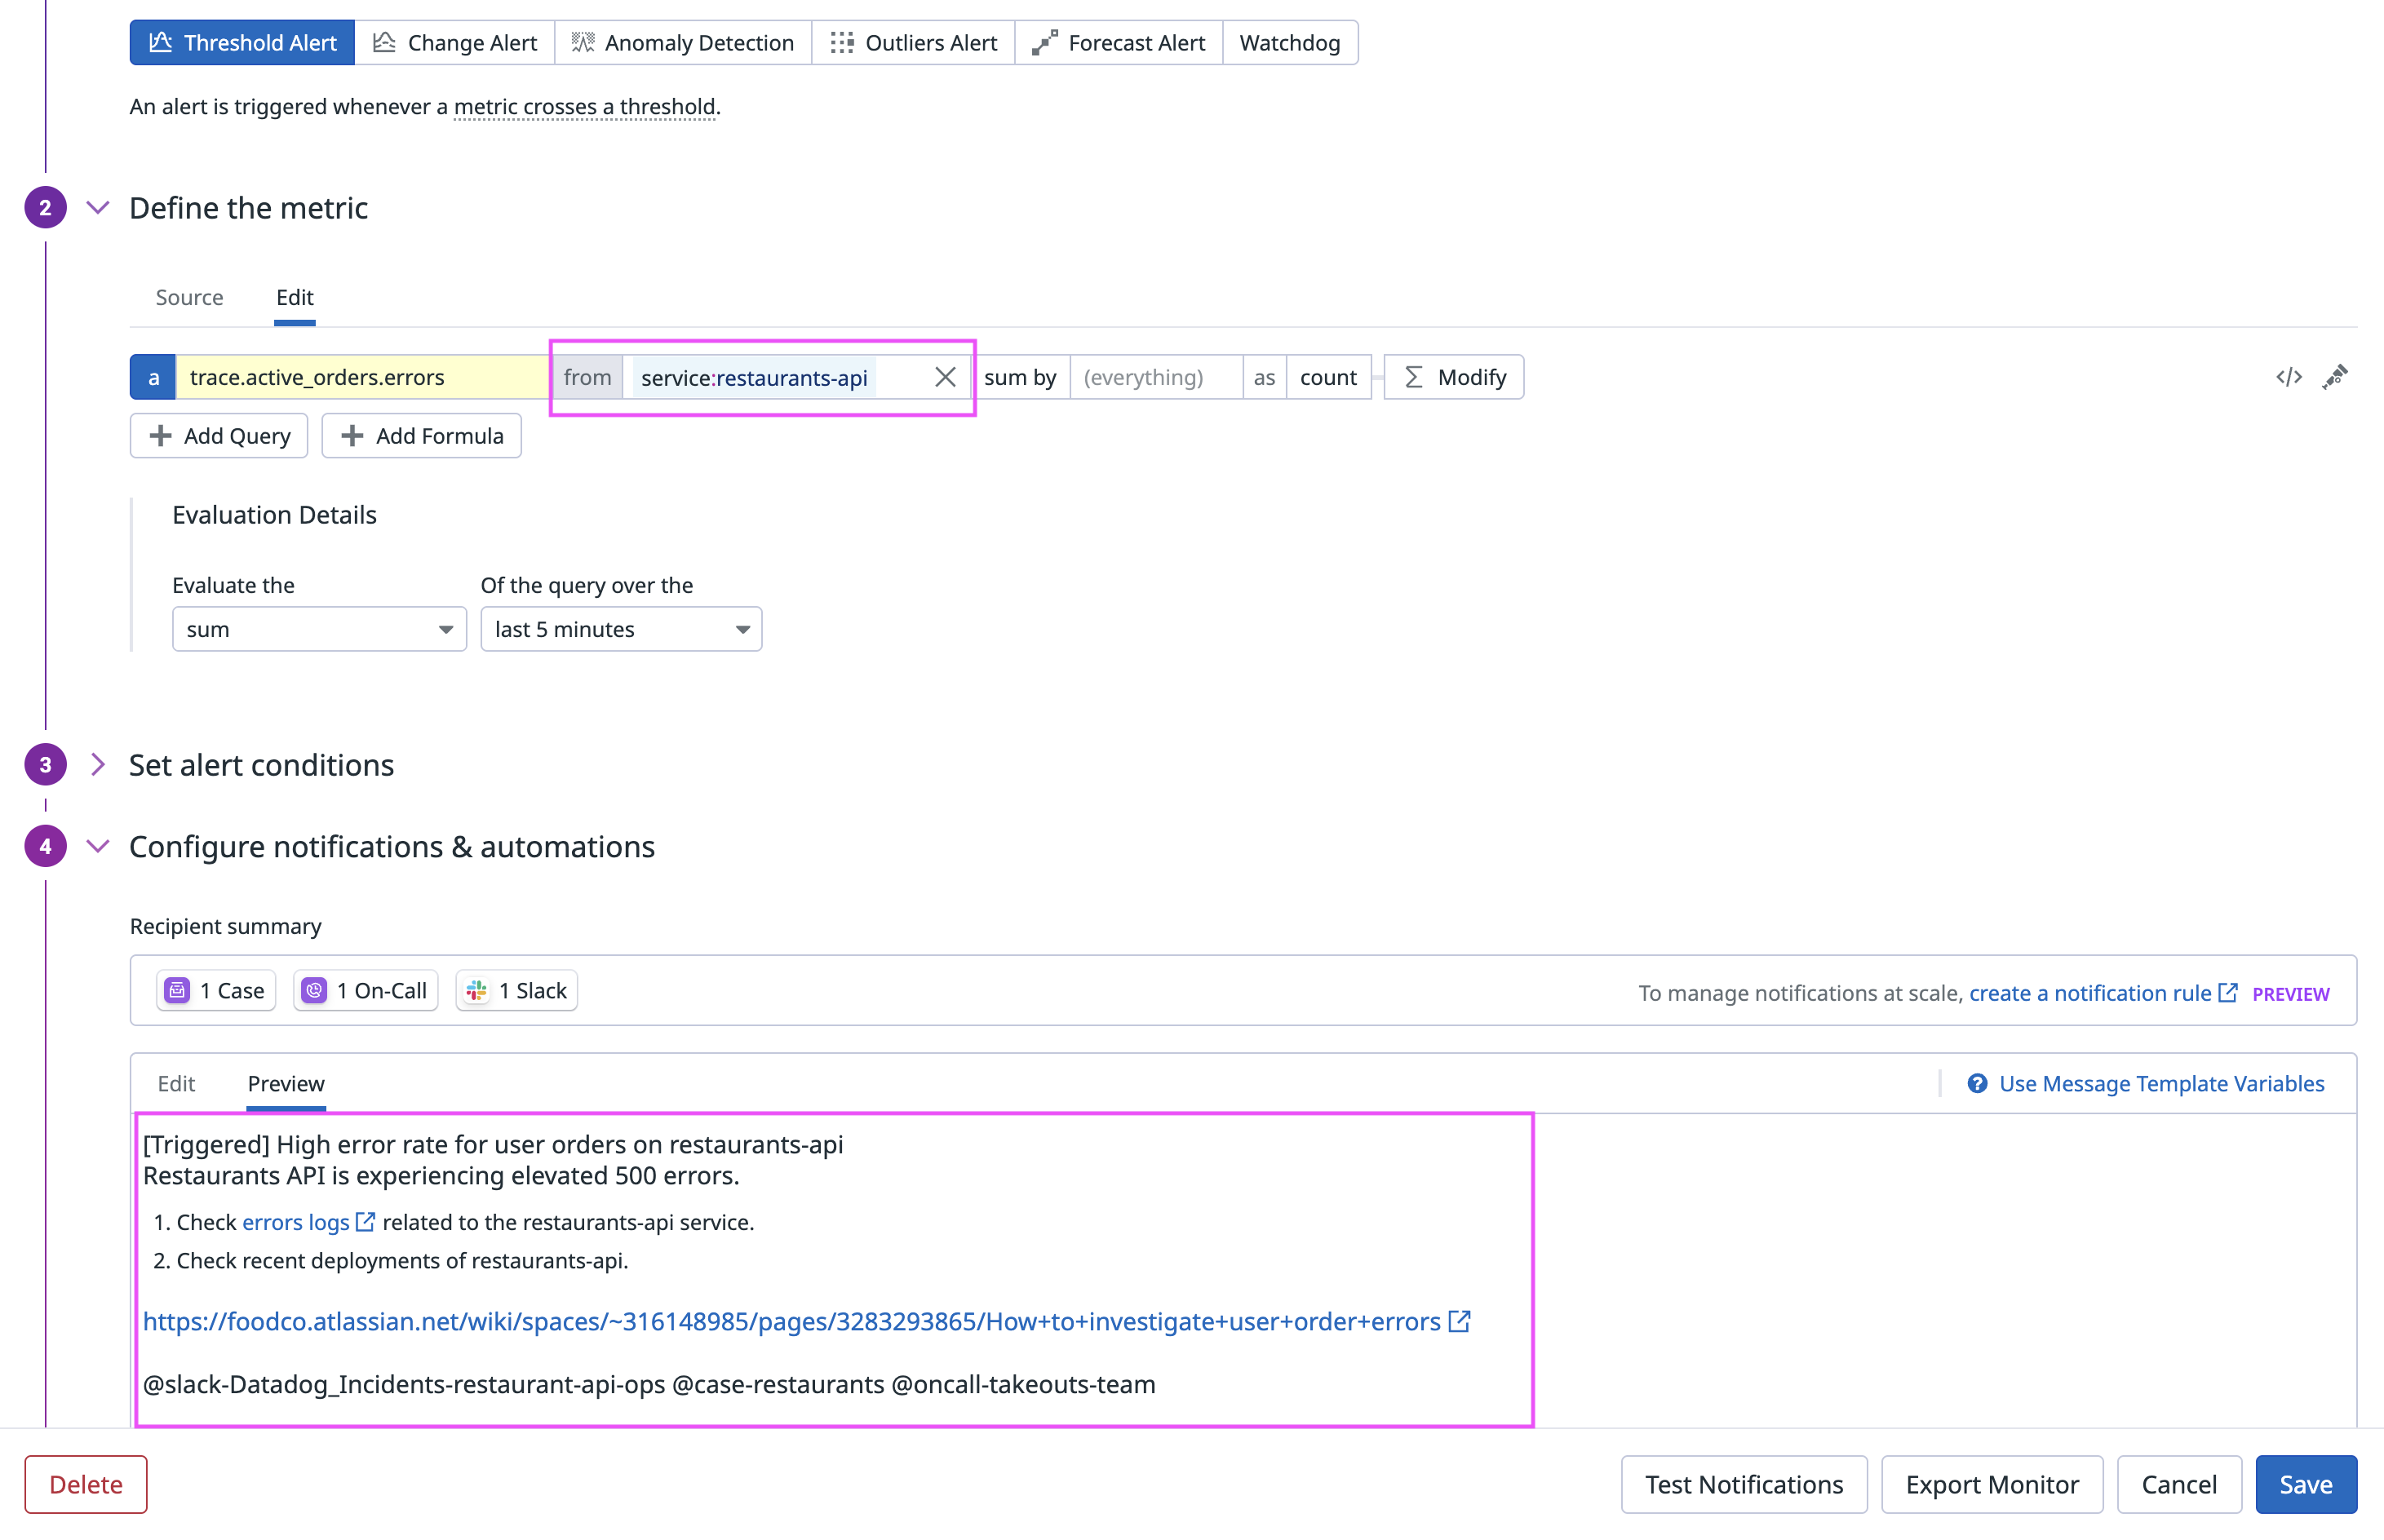
Include telemetry links: Add at least one helpful telemetry link in the monitor message. This link could be a Datadog dashboard, logs query, trace query, a Datadog notebook with helpful widgets, or a Confluence runbook page containing these links. Think about the first place you’d normally look in Datadog when this monitor triggers. Bits uses these links during the “Executing Runbook” step of the initial investigation to identify potential problem areas. Because these links are user-defined, you have control over what Bits reviews; ensuring it focuses on the same data you would, and giving you the flexibility to tailor investigations to your team’s workflows.
Add service scoping: For monitors associated with a service, add a service tag to the monitor, or filter or group the monitor query by service.
For additional suggestions on how to optimize investigations, see the section on Memories.
Configure where investigation findings are sent
By default, Bits’ investigation findings appear in two places:
- Full investigation findings are available on the Bits AI Investigations page.
- A summary of the findings is available on the status page for the monitor.
Additionally, if you have already configured @slack, @case, or @oncall notifications in your monitor, Bits automatically writes to those places. If not, you can add them as destinations for investigation findings to appear:
Slack
- Ensure the Datadog Slack app is installed in your Slack workspace.
- In your monitor, go to Configure notifications and automations and add the
@slack-{channel-name}handle. This sends monitor notifications to your chosen Slack channel. - Lastly, go to Bits AI SRE > Settings > Integrations and connect your Slack workspace. This allows Bits to write its findings directly under the monitor notification in Slack. Note: Each Slack workspace can only be connected to one Datadog organization.
Case Management
In the Configure notifications and automations section, add the @case-{project-name} handle. Case Management also supports optional two-way syncing with ticketing platforms like Jira and ServiceNow.
On-Call
In the Configure notifications and automations section, add the @oncall-{team} handle. Bits’ findings appear on the On-Call page in the Datadog mobile app, helping your teams triage issues on the go.
Configure knowledge base integrations
Bits integrates with Confluence to find relevant documentation and runbooks to support its investigations, and also allows you to interact with your Confluence content directly through chat.
- Connect your Confluence Cloud account by following the instructions in the Confluence integration tile.
- Optionally, enable account crawling to make Confluence a data source within Bits’ chat interface. This is not required for Bits to use Confluence when generating its investigation plan.
- You can view all connected Confluence accounts on the Bits Settings page.
Best practices: Optimize Bits’ understanding of your knowledge
Help Bits interpret and act on your documentation by following these best practices:
- Include relevant Datadog telemetry links in your Confluence pages. Bits queries these links to extract information for its investigation.
- Provide clear, step-by-step instructions for resolving monitor issues. Bits follows these instructions precisely, so being specific leads to more accurate outcomes.
- Document the services or systems involved in detail. Bits uses this information to understand the environment and guide investigations effectively.
Tip: The more precisely your Confluence page matches the issue at hand, the more helpful Bits can be.
Configure permissions
There are two RBAC permissions that apply to Bits AI SRE:
| Name | Description | Default Role |
|---|---|---|
Bits Investigations Read (bits_investigations_read) | Read Bits investigations. | Datadog Read Only Role |
Bits Investigations Write (bits_investigations_write) | Run and configure Bits investigations. | Datadog Standard Role |
These permissions are added by default to Managed Roles. If your organization uses Custom Roles or have previously modified the default roles, an admin with the User Access Manage permission will need to manually add the permission to the appropriate roles. For details, see Access Control.
Configure rate limits
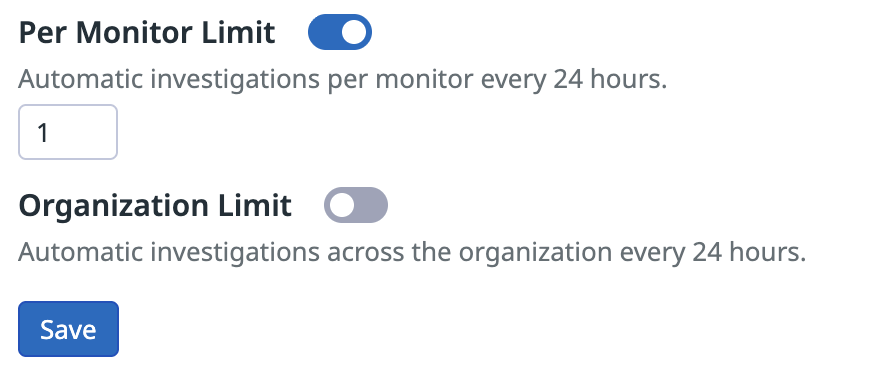
Rate limits define the maximum number of automatic investigations Bits AI SRE can run in a rolling 24-hour period.
Manual investigations can still be triggered even after rate limits.
Types of rate limits
Per monitor limit
Controls how often an investigation is triggered from a single monitor alert within a rolling 24 hour window.
Default: Each monitor can trigger one automatic investigation per 24 hours.
Organization limit
The Organization limit defines the total number of investigations Bits AI SRE can run across your entire organization within 24 hours.
Default: No limit.
Set a rate limit
To set a rate limit:
- Navigate to Bits AI SRE > Settings > Rate Limits.
- Toggle on the rate limit you want to enable.
- Set the maximum number of investigations that can run within a rolling 24-hour window.
- Click Save.
Audit Trail
You can monitor user-initiated actions with Audit Trail. Events are sent when:
- A user manually starts an investigation and when the investigation completes
- A tool call is executed in a manual investigation
- A user enables or disables automatic investigations for a monitor
- A user modifies the monitor rate limit
How Bits AI SRE investigates
Investigations happen in two phases:
- Initial context gathering
- Bits begins by identifying any Datadog or Confluence links that you have added to the monitor’s message and uses them as entry points into the investigation.
- It also automatically queries your Datadog environment to gather additional context about what’s happening around the alert.
- If you have previously interacted with an investigation for the same monitor, Bits will recall any memories associated with the monitor to inform and accelerate the current investigation.
- Root cause hypothesis generation and testing
- Using the gathered context, Bits performs a more thorough investigation by building multiple root cause hypotheses and testing them in parallel. Today, Bits is able to query:
- Metrics
- Traces
- Logs
- Dashboards
- Change events
- Watchdog alerts
- Hypotheses can end in one of three states: validated, invalidated, or inconclusive.
- Using the gathered context, Bits performs a more thorough investigation by building multiple root cause hypotheses and testing them in parallel. Today, Bits is able to query:
Chat with Bits AI SRE about the investigation
On the Bits AI Investigations page, you can chat with Bits to gather additional information about the investigation or the services involved. Click the Suggested replies bubble for examples.
| Functionality | Example prompts | Data source |
|---|---|---|
| Understand the status of its investigation | What's the latest status of the investigation? | Investigation findings |
| Ask for elaborations of its findings | Tell me more about the {issue}. | Investigation findings |
| Look up information about a service | Are there any ongoing incidents for {example-service}? | Software Catalog service definitions |
| Find recent changes for a service | Were there any recent changes on {example-service}? | Change Tracking events |
| Find a dashboard | Give me the {example-service} dashboard. | Dashboards |
| Query APM request, error, and duration metrics | What's the current error rate for {example-service}? | APM metrics |
Help Bits AI SRE learn
Reviewing Bits’ findings not only validates their accuracy, but also helps Bits learn from any mistakes it makes, enabling it to produce faster and more accurate investigations in the future.
During the investigation
You can guide Bits’ learning by:
- Improving a step: Share a link to a better query Bits should have made.
- Remembering a step: Tell Bits to remember any helpful queries it generated. This instructs Bits to prioritize running these queries the next time the same monitor fires.
After the investigation
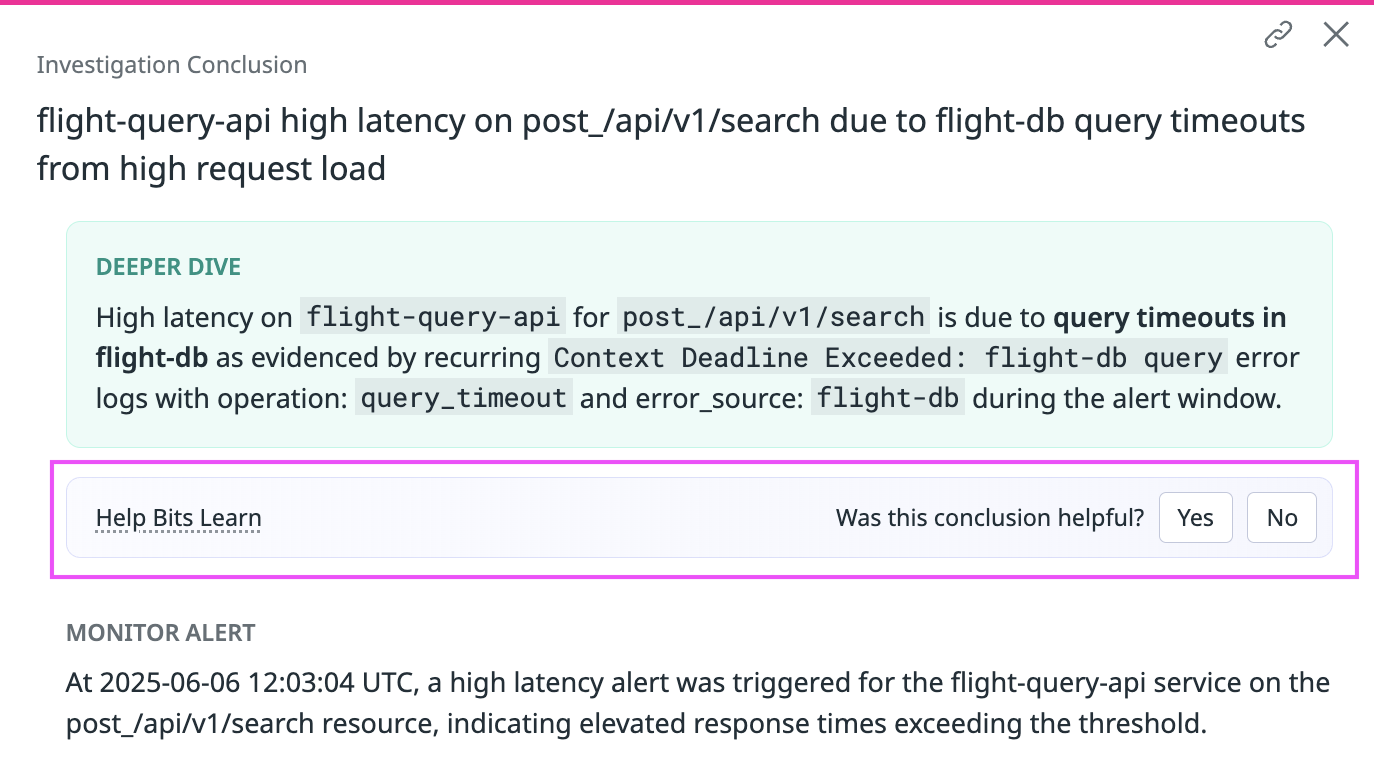
At the end of an investigation, let Bits know if the conclusion it made was correct or not. If it was inaccurate, provide Bits with the correct root cause so that it can learn from the discrepancy.
Manage memories
Every piece of feedback you give generates a memory. Bits uses these memories to enhance future investigations by recalling relevant patterns, queries, and corrections. You can navigate to the Monitor Management page to view and delete memories in the Memories column.


