- Essentials
- Getting Started
- Agent
- API
- APM Tracing
- Containers
- Dashboards
- Database Monitoring
- Datadog
- Datadog Site
- DevSecOps
- Incident Management
- Integrations
- Internal Developer Portal
- Logs
- Monitors
- OpenTelemetry
- Profiler
- Session Replay
- Security
- Serverless for AWS Lambda
- Software Delivery
- Synthetic Monitoring and Testing
- Tags
- Workflow Automation
- Learning Center
- Support
- Glossary
- Standard Attributes
- Guides
- Agent
- Integrations
- Developers
- Authorization
- DogStatsD
- Custom Checks
- Integrations
- Create an Agent-based Integration
- Create an API Integration
- Create a Log Pipeline
- Integration Assets Reference
- Build a Marketplace Offering
- Create a Tile
- Create an Integration Dashboard
- Create a Monitor Template
- Create a Cloud SIEM Detection Rule
- OAuth for Integrations
- Install Agent Integration Developer Tool
- Service Checks
- IDE Plugins
- Community
- Guides
- OpenTelemetry
- Administrator's Guide
- API
- Partners
- Datadog Mobile App
- DDSQL Reference
- CoScreen
- CoTerm
- Cloudcraft (Standalone)
- In The App
- Dashboards
- Notebooks
- DDSQL Editor
- Reference Tables
- Sheets
- Monitors and Alerting
- Metrics
- Watchdog
- Bits AI
- Internal Developer Portal
- Error Tracking
- Change Tracking
- Service Management
- Actions & Remediations
- Infrastructure
- Cloudcraft
- Resource Catalog
- Universal Service Monitoring
- Hosts
- Containers
- Processes
- Serverless
- Network Monitoring
- Cloud Cost
- Application Performance
- APM
- APM Terms and Concepts
- Application Instrumentation
- APM Metrics Collection
- Trace Pipeline Configuration
- Correlate Traces with Other Telemetry
- Trace Explorer
- Recommendations
- Code Origins for Spans
- Service Observability
- Endpoint Observability
- Dynamic Instrumentation
- Live Debugger
- Error Tracking
- Data Security
- Guides
- Troubleshooting
- Continuous Profiler
- Database Monitoring
- Agent Integration Overhead
- Setup Architectures
- Setting Up Postgres
- Setting Up MySQL
- Setting Up SQL Server
- Setting Up Oracle
- Setting Up Amazon DocumentDB
- Setting Up MongoDB
- Connecting DBM and Traces
- Data Collected
- Exploring Database Hosts
- Exploring Query Metrics
- Exploring Query Samples
- Exploring Database Schemas
- Exploring Recommendations
- Troubleshooting
- Guides
- Data Streams Monitoring
- Data Jobs Monitoring
- Data Observability
- Digital Experience
- Real User Monitoring
- Synthetic Testing and Monitoring
- Continuous Testing
- Product Analytics
- Software Delivery
- CI Visibility
- CD Visibility
- Deployment Gates
- Test Optimization
- Quality Gates
- DORA Metrics
- Security
- Security Overview
- Cloud SIEM
- Code Security
- Cloud Security
- App and API Protection
- Workload Protection
- Sensitive Data Scanner
- AI Observability
- Log Management
- Observability Pipelines
- Log Management
- Administration
Usage Metrics
Overview
The following in-app configuration pages allow you to set ingested and indexed volumes for APM:
- Use the Ingestion Control Page to control ingested span volume.
- Use the Retention Filters page to control the number of indexed spans.
Both pages are powered by usage metrics.
The following metrics are available in your account:
datadog.estimated_usage.apm.ingested_bytes(billed dimension)datadog.estimated_usage.apm.ingested_spansdatadog.estimated_usage.apm.ingested_tracesdatadog.estimated_usage.apm.indexed_spans(billed dimension)
Leverage these metrics in dashboards and monitors to visualize and control your usage. Two out-of-the box dashboards are built with these metrics. These dashboards help monitor your APM usage as well as your ingested and indexed span volumes.
Datadog APM plans come with indexed and ingested spans included. For more information, see the Pricing page or some pricing example scenarios.
Ingested spans volume
The following metrics are associated with ingested spans usage:
datadog.estimated_usage.apm.ingested_bytesdatadog.estimated_usage.apm.ingested_spansdatadog.estimated_usage.apm.ingested_traces
To control usage, use datadog.estimated_usage.apm.ingested_bytes. Ingestion is metered by volume, not by the number of spans or traces. This metric is tagged with env, service, andsampling_service. These tags help identify which environments and services contribute to the ingestion volume. For more information about the sampling_service dimension, read What is the sampling service?.
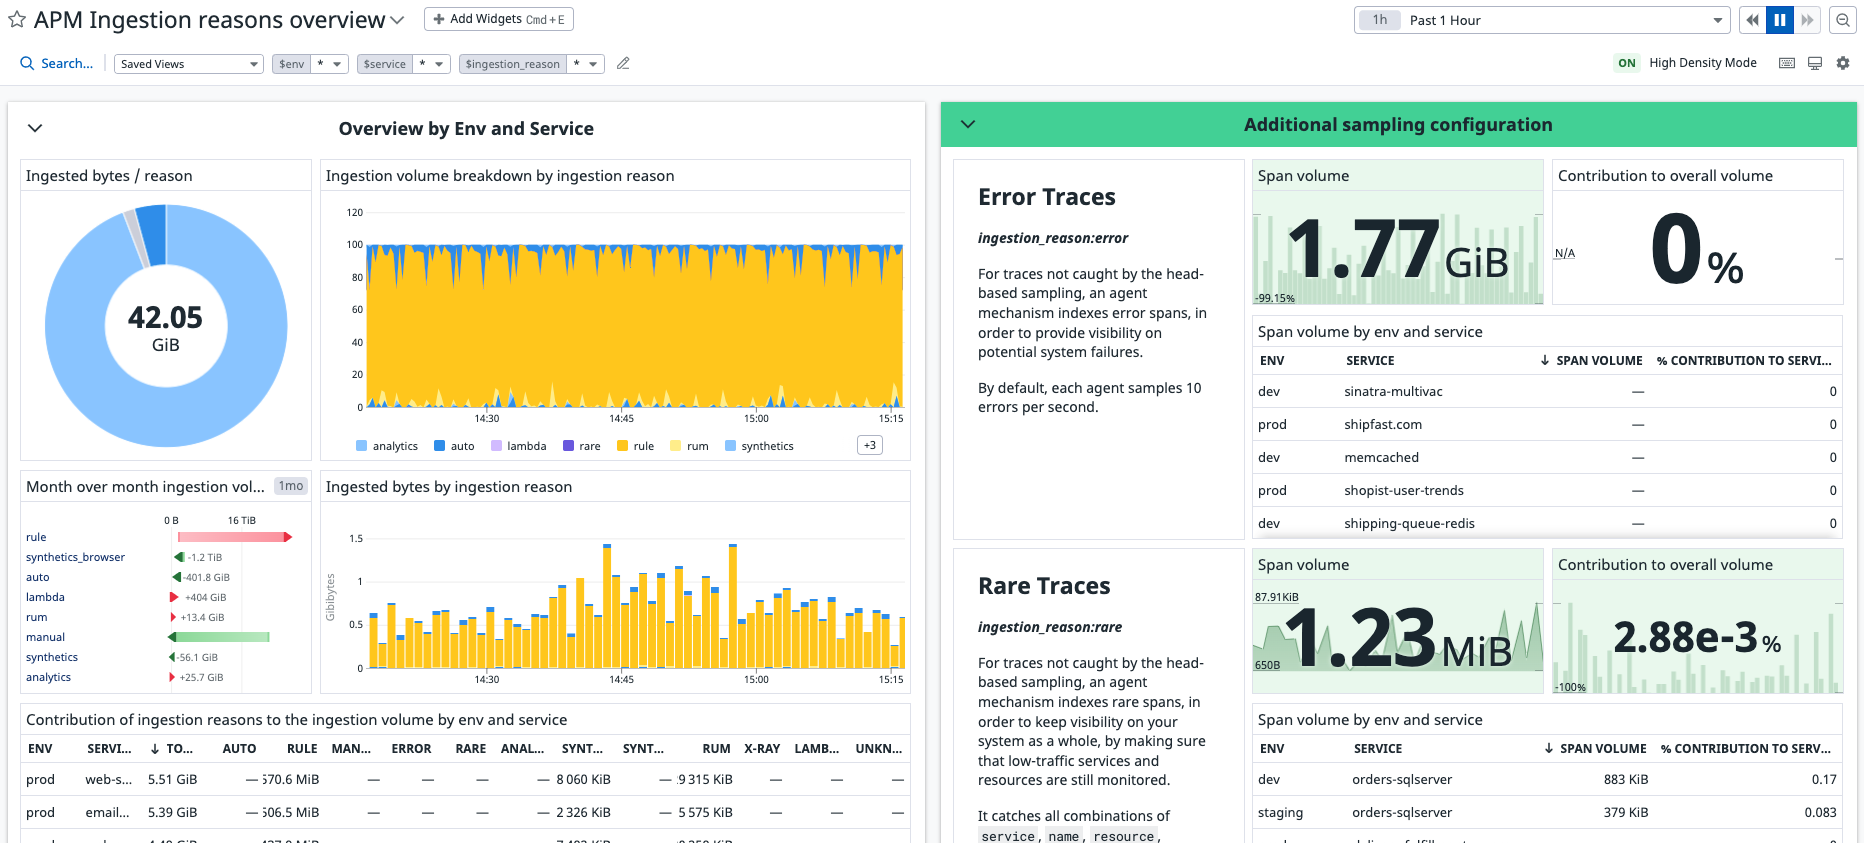
This metric is also tagged by ingestion_reason, reflecting which ingestion mechanisms are responsible for sending spans to Datadog. These mechanisms are nested in the tracing libraries of the Datadog Agent. For more information about this dimension, see the Ingestion Reasons dashboard.
The datadog.estimated_usage.apm.ingested_traces metric measures the number of requests sampled per second, and only counts traces sampled by head-based sampling. This metric is also tagged by env and service so you can spot which services are starting the most traces.
What is the sampling service?
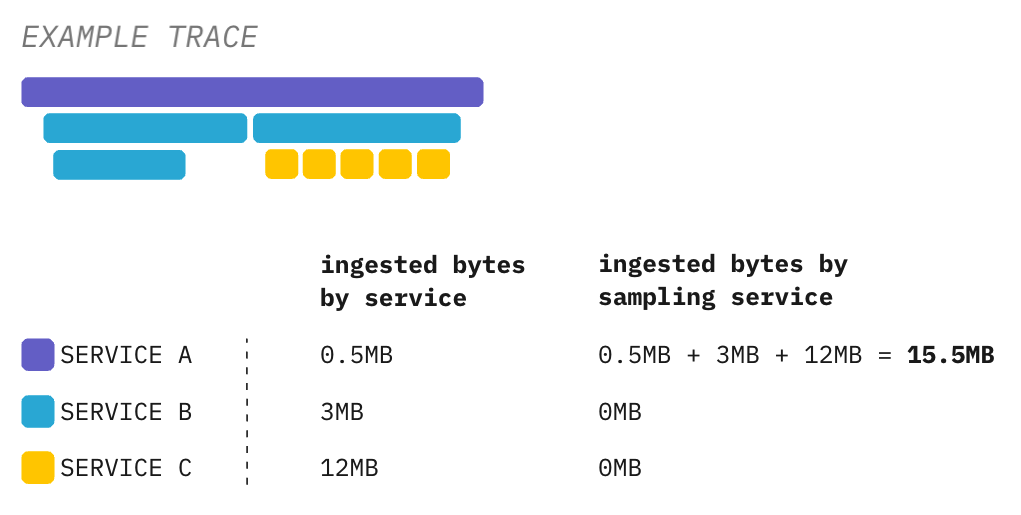
The sampling_service dimension on the datadog.estimated_usage.apm.ingested_bytes assigns ingested bytes to the service that makes the sampling decision, not the service emitting the span.
Group the metric by sampling_service to identify services contributing the most to total ingested volumes. For instance, if service A starts a trace and makes a head-based sampling decision before calling services B and C, all bytes from services A, B, and C are attributed to sampling_service:A.
Indexed spans
Use the datadog.estimated_usage.apm.indexed_spans metric to control the number of spans indexed by tag-based retention filters.
This metric is tagged by env and service so you can spot which environments and services are contributing to the indexing usage.
APM Traces Estimated Usage dashboard
The APM Traces Usage dashboard contains several widget groups displaying high-level KPIs and additional usage information.
In this dashboard, you can find information about:
- Global usage metrics
- Infrastructure with APM enabled, including hosts, Fargate, and AWS Lambda
- Ingestion volumes separated by
service,env, andingestion_reason - Indexing volumes separated by
serviceandenv
APM Ingestion Reasons dashboard
The APM Ingestion Reasons dashboard provides insights on each source of ingestion volume. Each ingestion usage metric is tagged with an ingestion_reason dimension, so you can see which configuration options (Datadog Agent configuration or tracing library configuration) and products (such as RUM or Synthetic Testing) are generating the most APM data.
For each ingestion reason, you can find out which environments and services are contributing the most to the overall volume.
Further Reading
Additional helpful documentation, links, and articles:


