- Essentials
- Getting Started
- Agent
- API
- APM Tracing
- Containers
- Dashboards
- Database Monitoring
- Datadog
- Datadog Site
- DevSecOps
- Incident Management
- Integrations
- Internal Developer Portal
- Logs
- Monitors
- OpenTelemetry
- Profiler
- Session Replay
- Security
- Serverless for AWS Lambda
- Software Delivery
- Synthetic Monitoring and Testing
- Tags
- Workflow Automation
- Learning Center
- Support
- Glossary
- Standard Attributes
- Guides
- Agent
- Integrations
- Developers
- Authorization
- DogStatsD
- Custom Checks
- Integrations
- Create an Agent-based Integration
- Create an API Integration
- Create a Log Pipeline
- Integration Assets Reference
- Build a Marketplace Offering
- Create a Tile
- Create an Integration Dashboard
- Create a Monitor Template
- Create a Cloud SIEM Detection Rule
- OAuth for Integrations
- Install Agent Integration Developer Tool
- Service Checks
- IDE Plugins
- Community
- Guides
- OpenTelemetry
- Administrator's Guide
- API
- Partners
- Datadog Mobile App
- DDSQL Reference
- CoScreen
- CoTerm
- Cloudcraft (Standalone)
- In The App
- Dashboards
- Notebooks
- DDSQL Editor
- Reference Tables
- Sheets
- Monitors and Alerting
- Metrics
- Watchdog
- Bits AI
- Internal Developer Portal
- Error Tracking
- Change Tracking
- Service Management
- Actions & Remediations
- Infrastructure
- Cloudcraft
- Resource Catalog
- Universal Service Monitoring
- Hosts
- Containers
- Processes
- Serverless
- Network Monitoring
- Cloud Cost
- Application Performance
- APM
- APM Terms and Concepts
- Application Instrumentation
- APM Metrics Collection
- Trace Pipeline Configuration
- Correlate Traces with Other Telemetry
- Trace Explorer
- Recommendations
- Code Origins for Spans
- Service Observability
- Endpoint Observability
- Dynamic Instrumentation
- Live Debugger
- Error Tracking
- Data Security
- Guides
- Troubleshooting
- Continuous Profiler
- Database Monitoring
- Agent Integration Overhead
- Setup Architectures
- Setting Up Postgres
- Setting Up MySQL
- Setting Up SQL Server
- Setting Up Oracle
- Setting Up Amazon DocumentDB
- Setting Up MongoDB
- Connecting DBM and Traces
- Data Collected
- Exploring Database Hosts
- Exploring Query Metrics
- Exploring Query Samples
- Exploring Database Schemas
- Exploring Recommendations
- Troubleshooting
- Guides
- Data Streams Monitoring
- Data Jobs Monitoring
- Data Observability
- Digital Experience
- Real User Monitoring
- Synthetic Testing and Monitoring
- Continuous Testing
- Product Analytics
- Software Delivery
- CI Visibility
- CD Visibility
- Deployment Gates
- Test Optimization
- Quality Gates
- DORA Metrics
- Security
- Security Overview
- Cloud SIEM
- Code Security
- Cloud Security
- App and API Protection
- Workload Protection
- Sensitive Data Scanner
- AI Observability
- Log Management
- Observability Pipelines
- Log Management
- Administration
Trace View
Overview
View an individual trace to see all of its spans and associated metadata. Each trace can be visualized as either a Flame Graph, Span List, Waterfall, or Map.
The trace header displays critical trace information, including the root span’s service name, resource name, trace ID, end-to-end trace duration, and the trace start time. To get a permalink to the trace, click Open Full Page and save the URL.
Trace visualizations
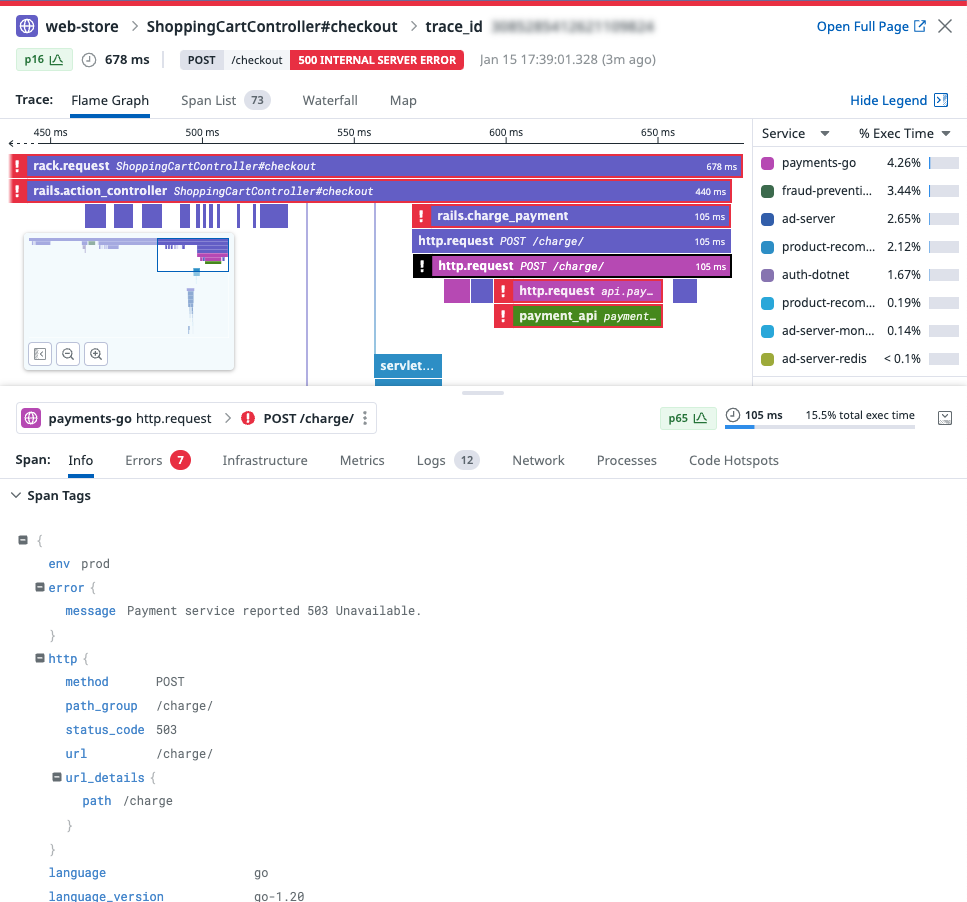
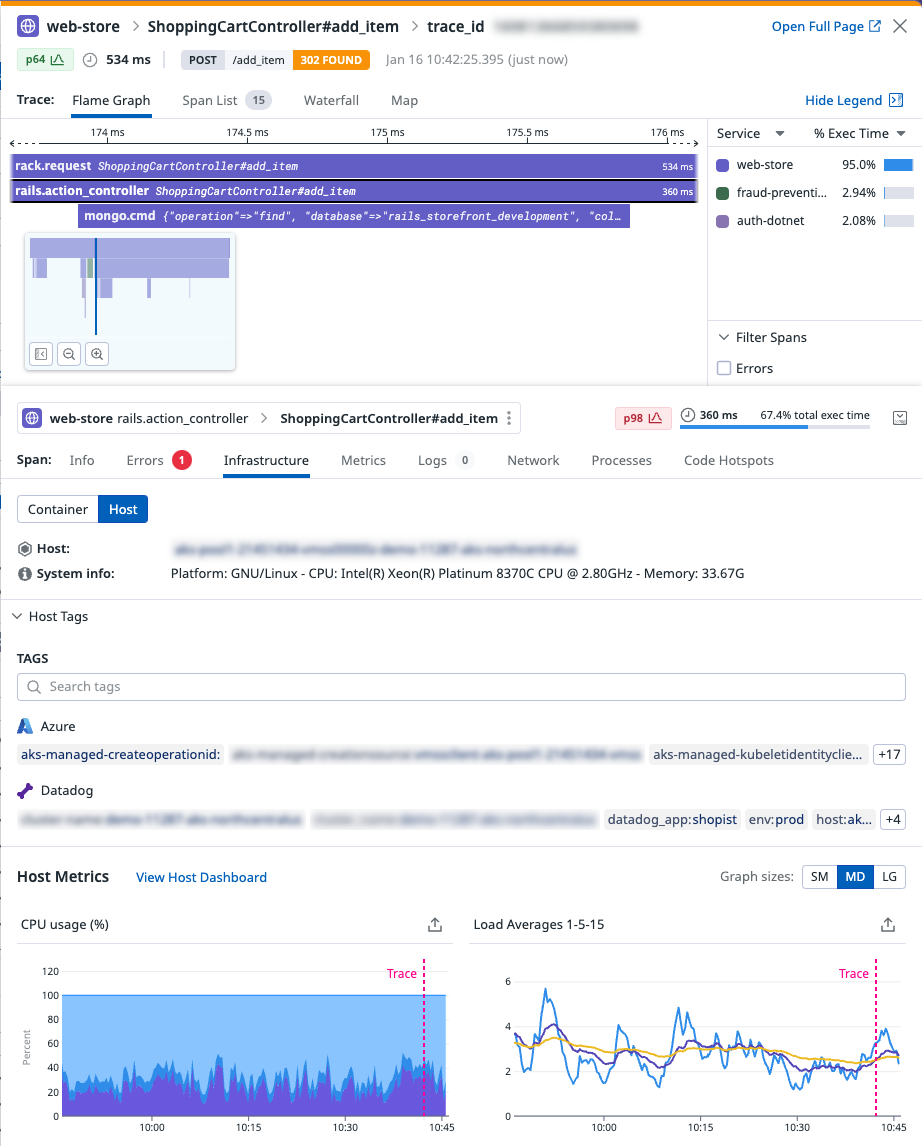
The Flame Graph is the default visualization that displays all the color-coded spans from a trace on a timeline. This is useful for understanding the execution path of a request and where time was spent over a trace.
To navigate the graph, scroll to zoom, click and drag to move around, and use the minimap to zoom into the selected span or zoom out to the full trace.
The legend details the color coding of the flame graph. Group spans by either Service (default), Base service (service from which the span is emitted), Host, or Container. Choose to display either the percentage of trace execution time (% Exec Time) or span count (Spans) by group. If errors exist on spans in the trace, highlight them in the flame graph by selecting the Errors checkbox under Filter Spans.
Spans from inferred services are represented with a dashed outline.
Displays resources by group (service by default) and sorts them according to their count of spans. This visualization is useful for scanning latency information by resource or grouping.
Filter resources by type or naming information using the corresponding buttons and text-based search.
Groups can be sorted by clicking on the corresponding column header: RESOURCE, SPANS, average duration (AVG DURATION), execution time (EXEC TIME), or percentage of trace execution time (% EXEC TIME).
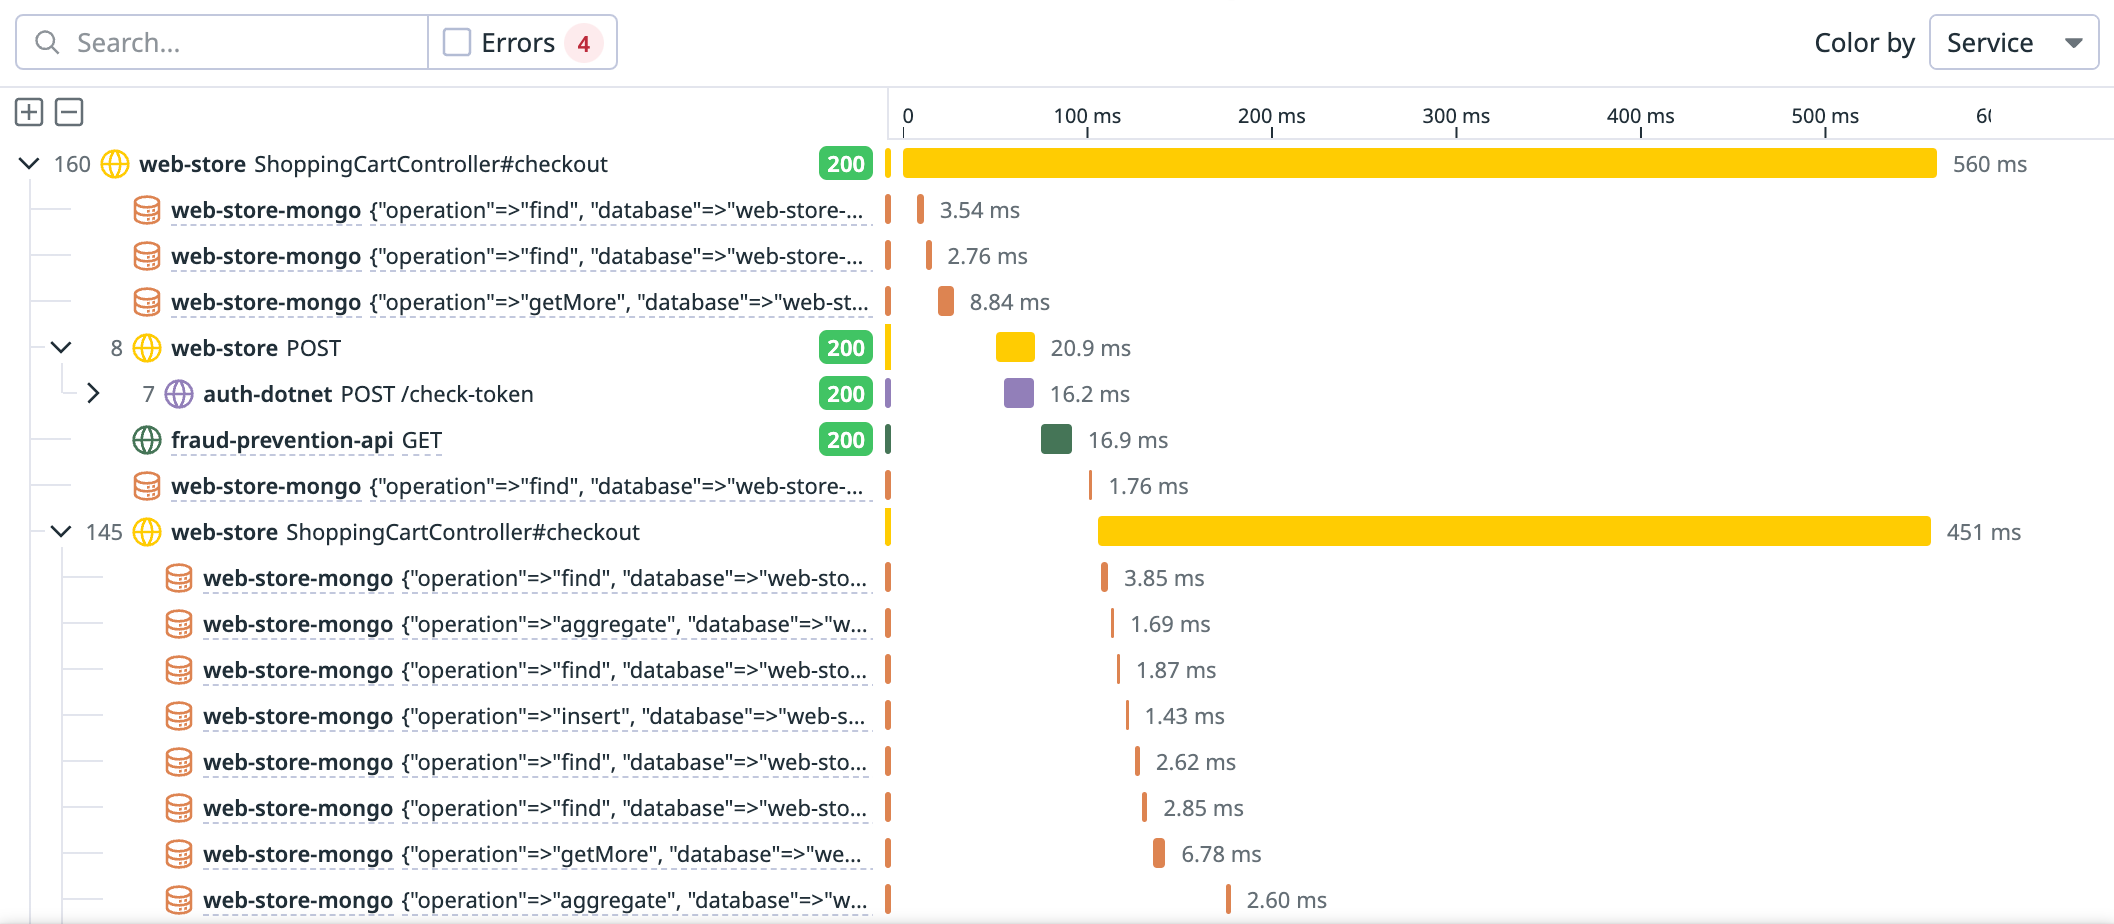
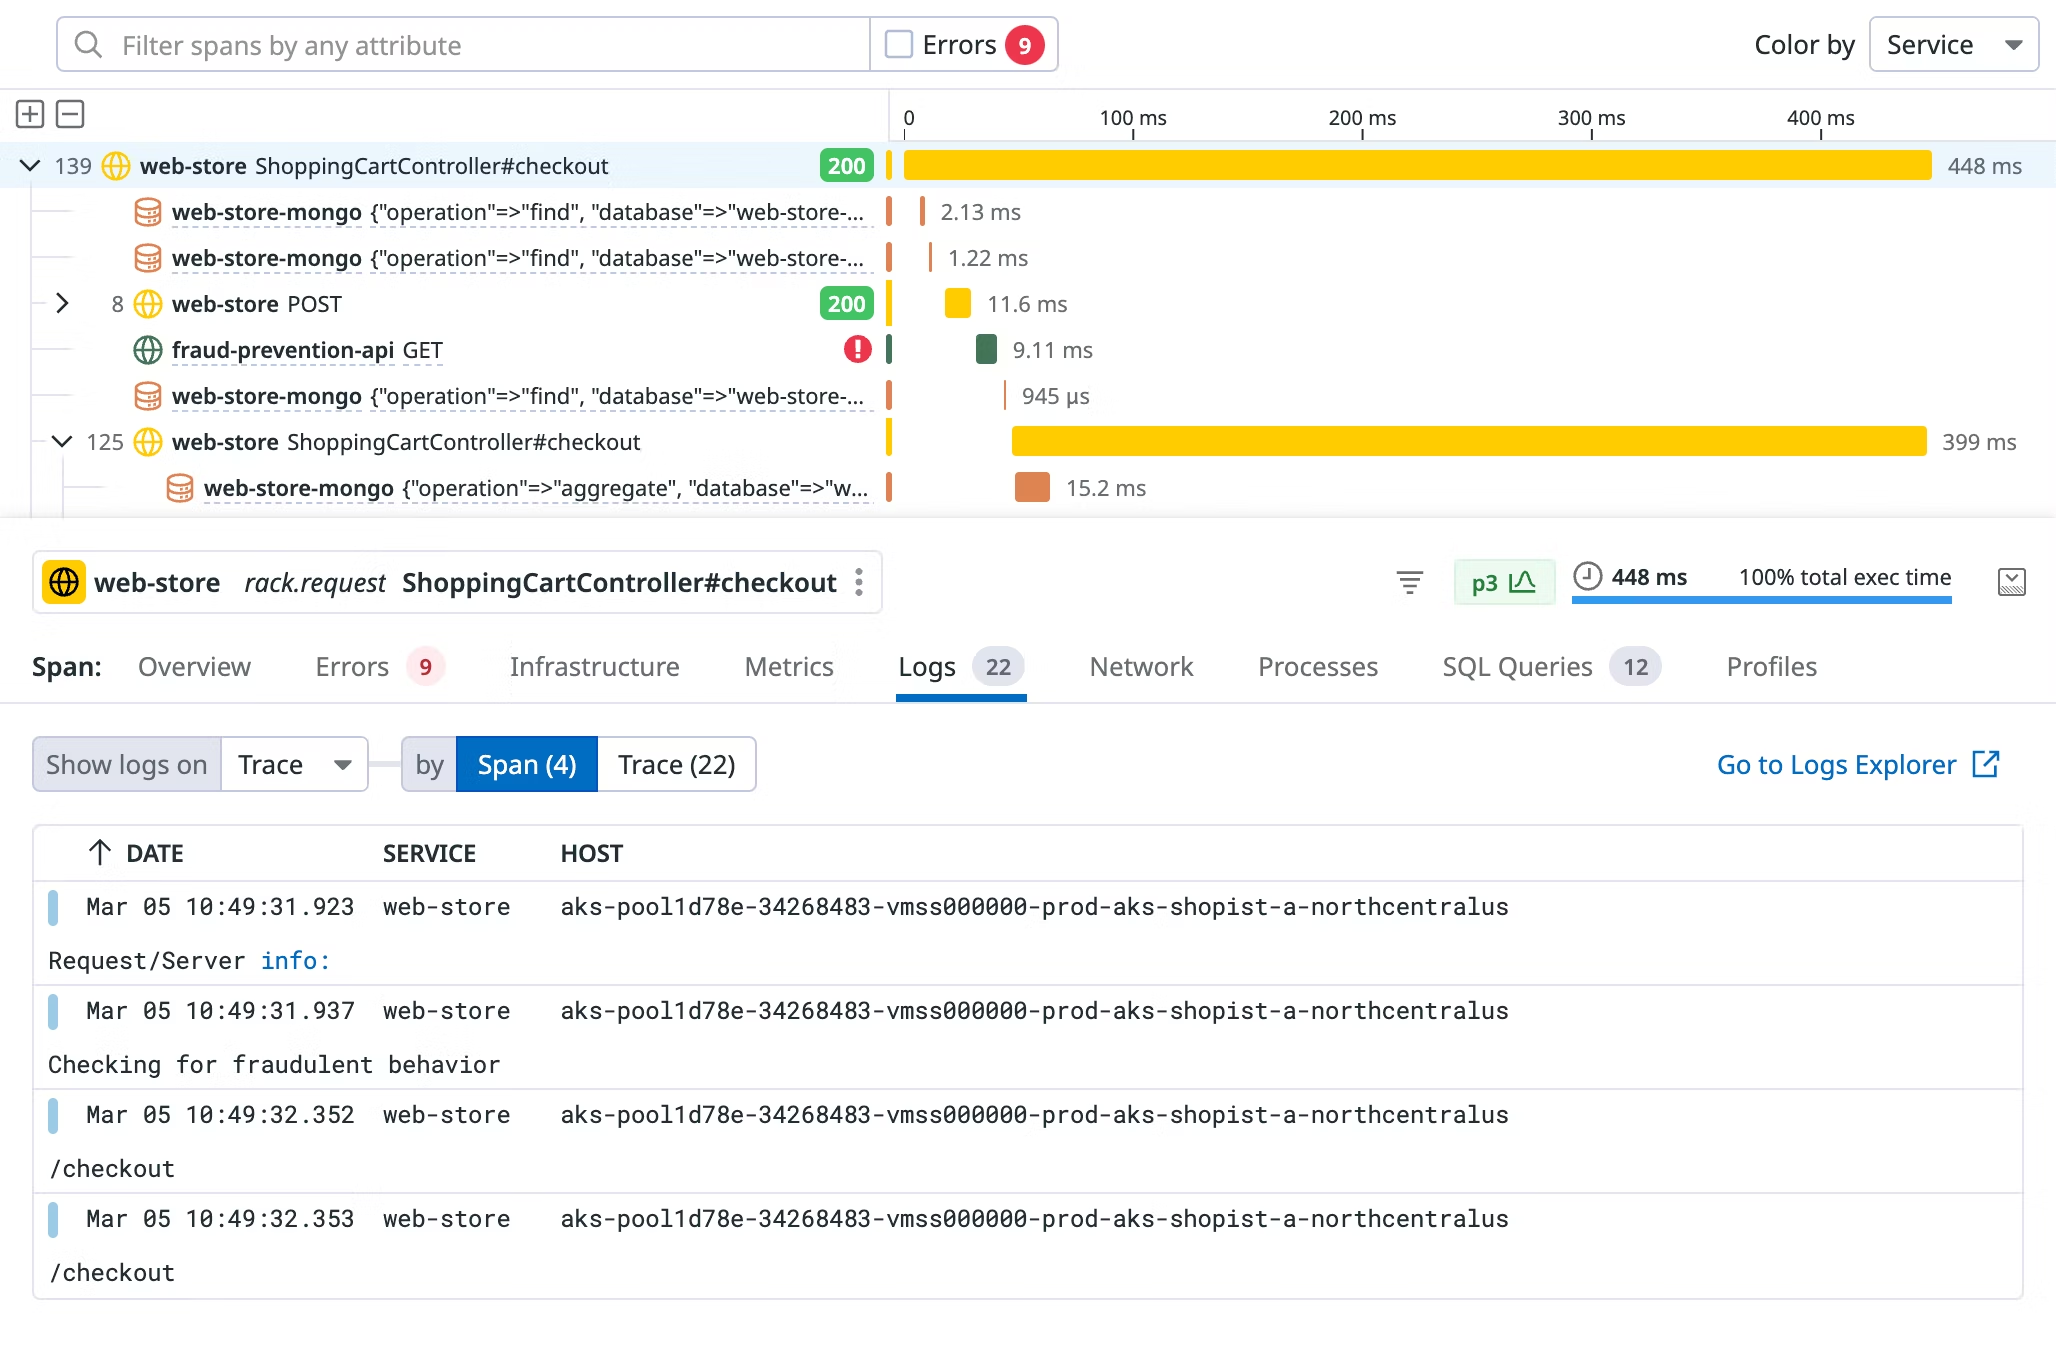
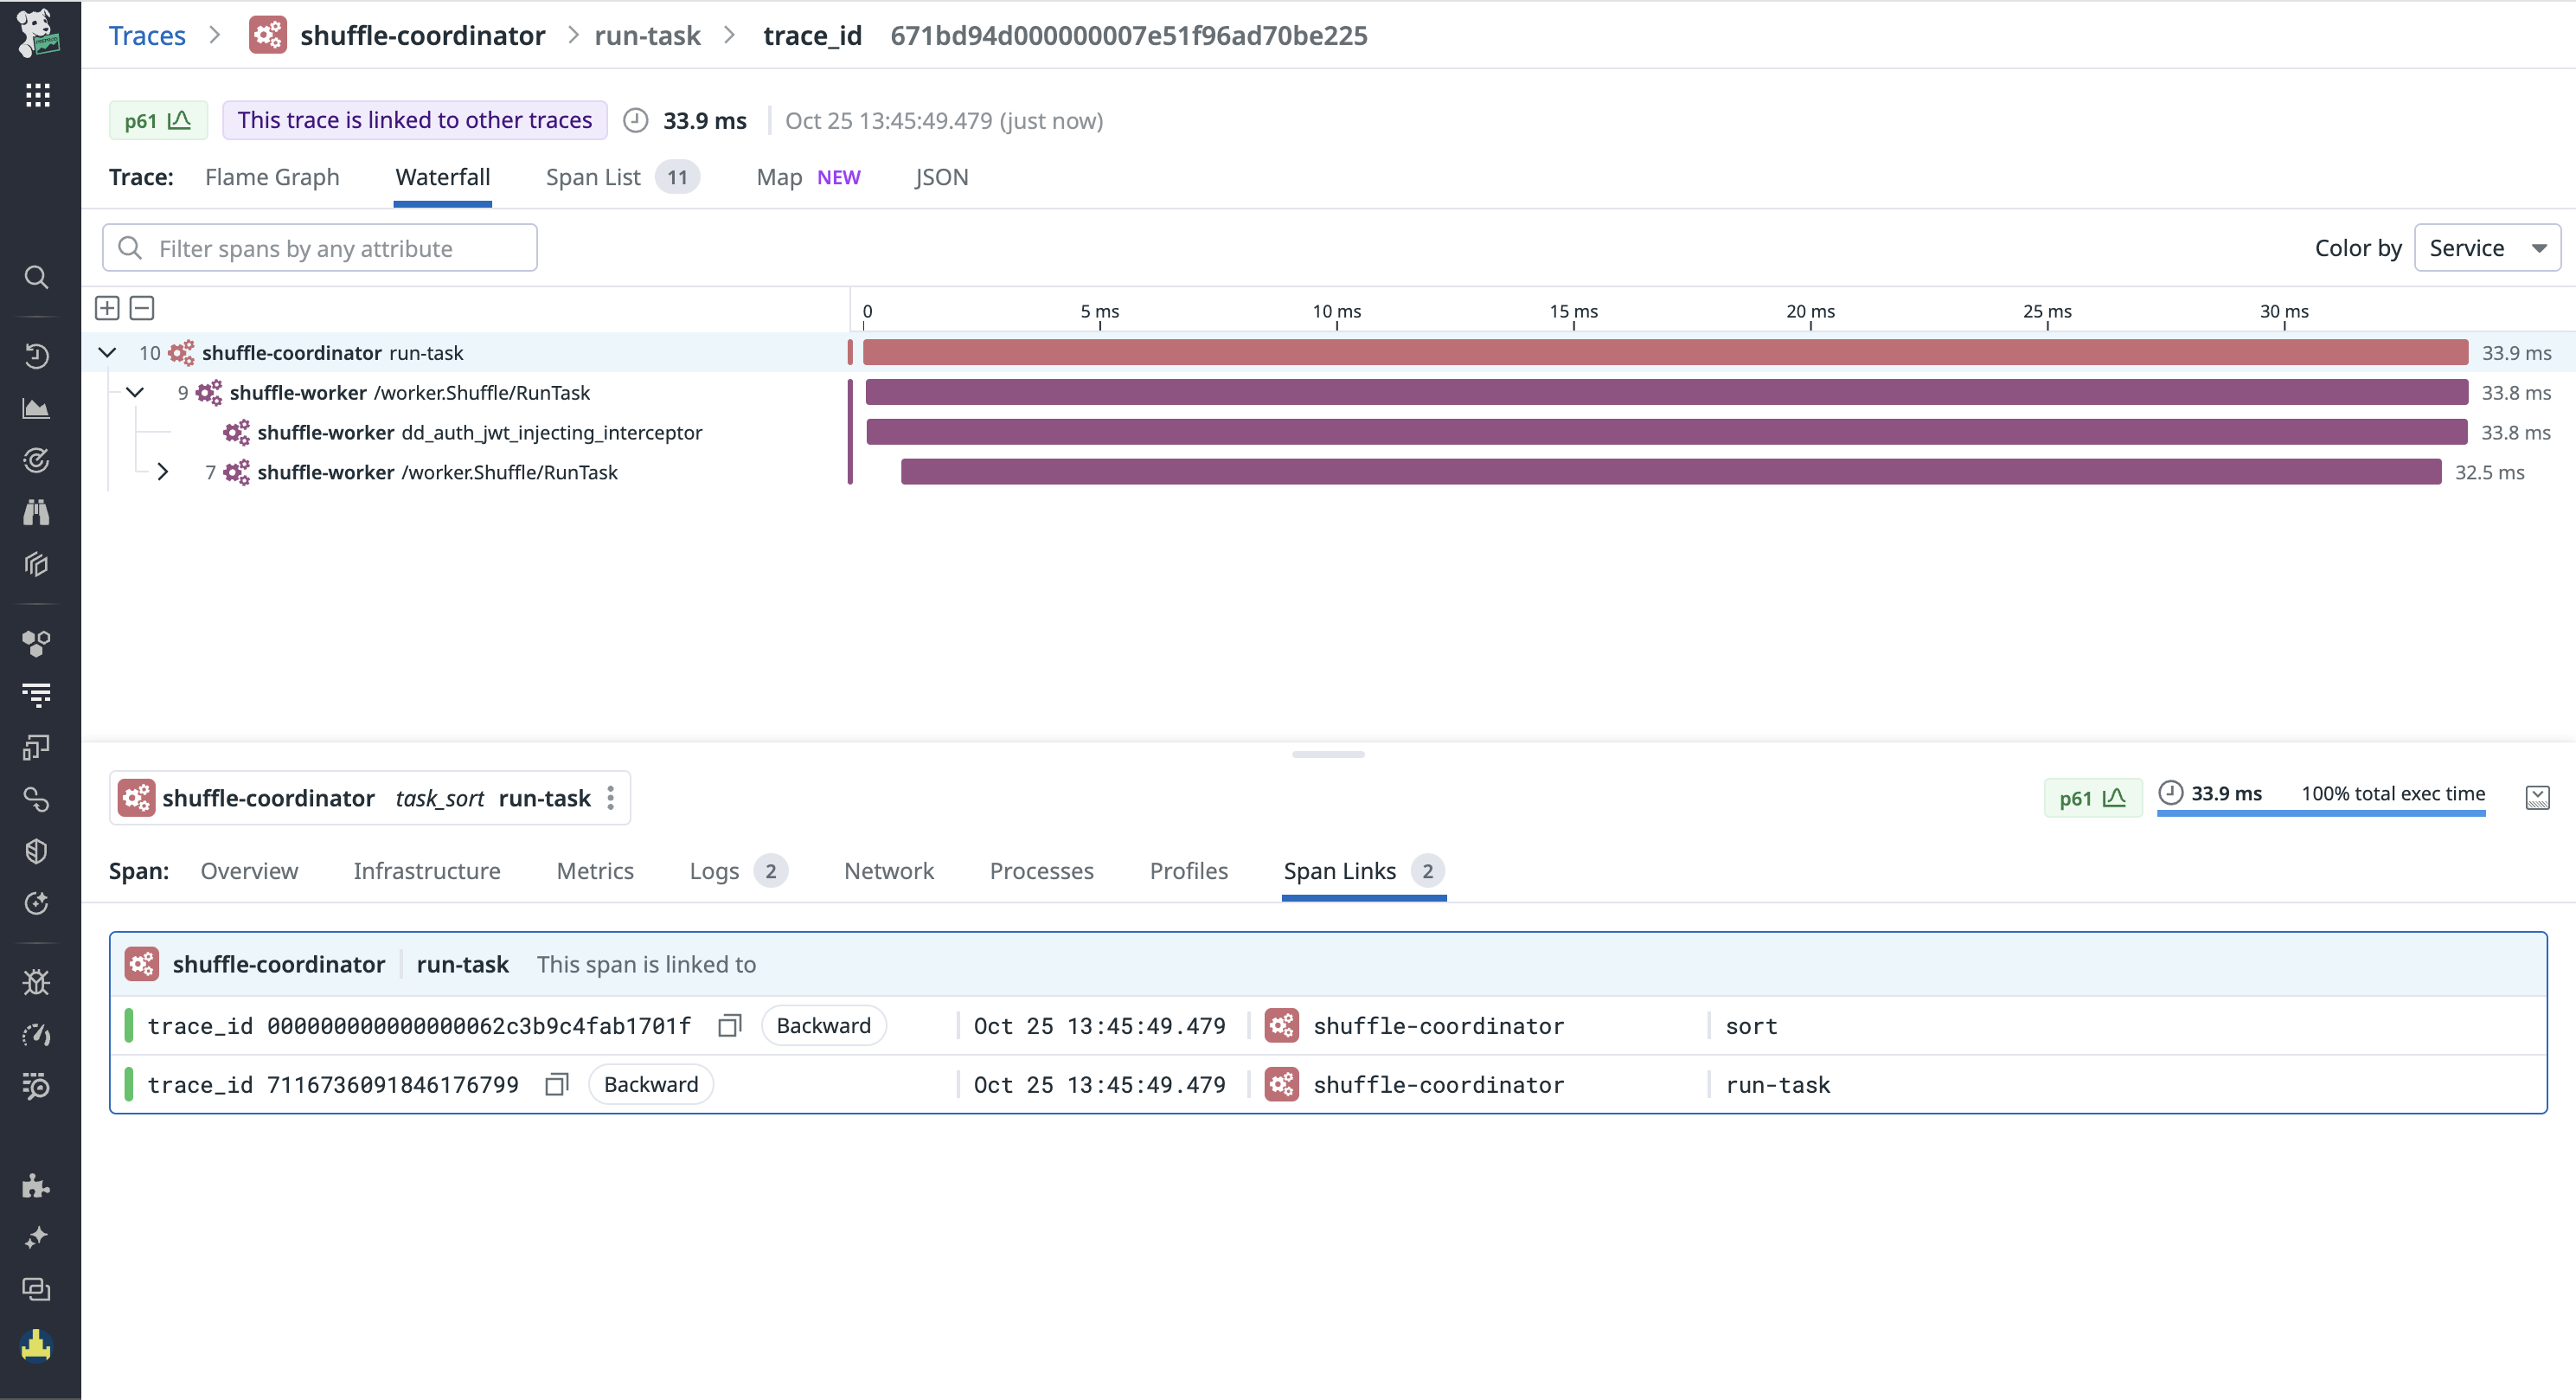
Displays all spans for a trace on a timeline where each row corresponds to a span. This visualization is useful for isolating and focusing on relevant parts of a trace.
Each row (span) indicates the following:
- Relative span duration: The length of the color-coded bar corresponds to the percentage of total trace duration.
- Absolute span duration: The absolute time in milliseconds (ms).
- Span details: The corresponding service name and resource name are displayed.
- Statuses: When applicable, an HTTP status code is displayed.
- Color coding: Spans are color-coded by service (default), host, or container. To change how spans are color-coded, use the Color by dropdown.
Spans from inferred services are represented with a dashed underline.
To expand or collapse span descendants, click the chevron (>) icon on a row. To expand or collapse all spans, click the Expand all (+) or Collapse all (-) buttons.
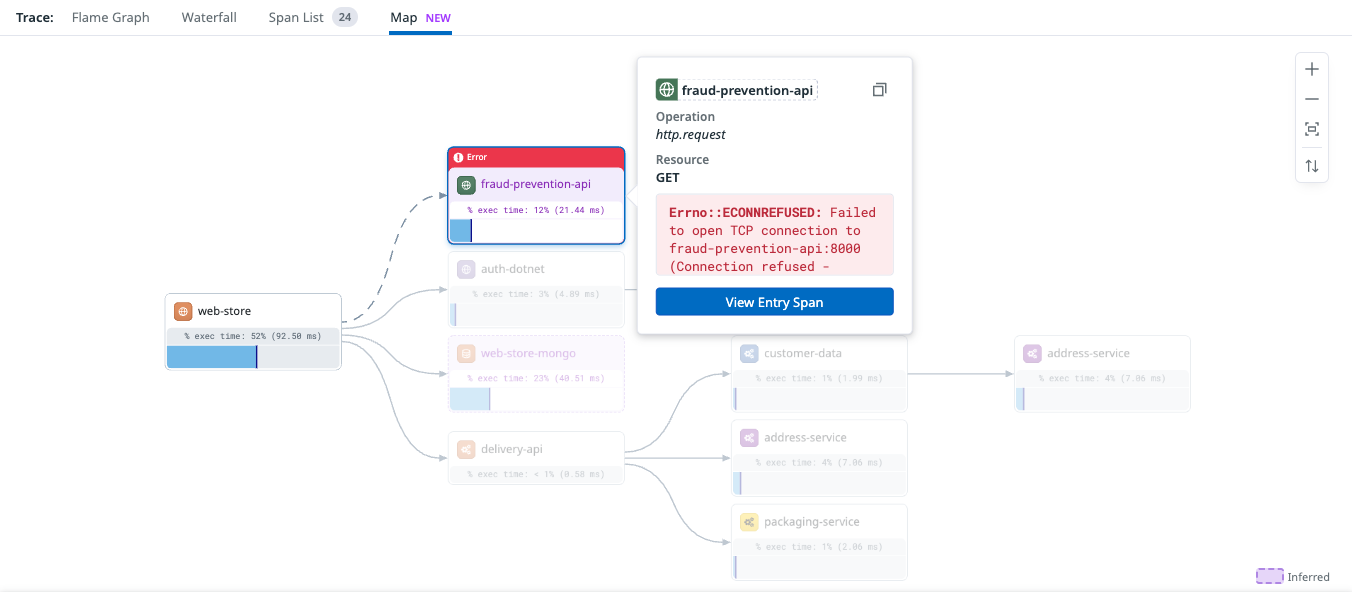
Trace map displays a representation of all services involved in a single trace. It provides an overview of the transaction lifecycle at the service level and shows service dependencies.
Each node on the map represents a service in the transaction lifecycle. To prevent cyclic dependencies on the map, services that call another service that had already been invoked by the original service, are represented by duplicated nodes. Inferred services are represented with a dashed outline and a purple background.
Service nodes explicitly show the percentage of the total execution time, which shows the trace duration breakdown at the service level.
If a service entry span is in an error state, the corresponding service node is marked with a red border to highlight a faulty services. If an error occurs in a service exit span, the edge indicating the call to the next service is also highlighted in red.
To view additional information about the service entry spans for each node, hover over the error state. The tooltip displays details about the service entry span’s operation and resource name, along with any error messages. To further investigation, click View Entry Span to switch to the Waterfall view.
Trace preview
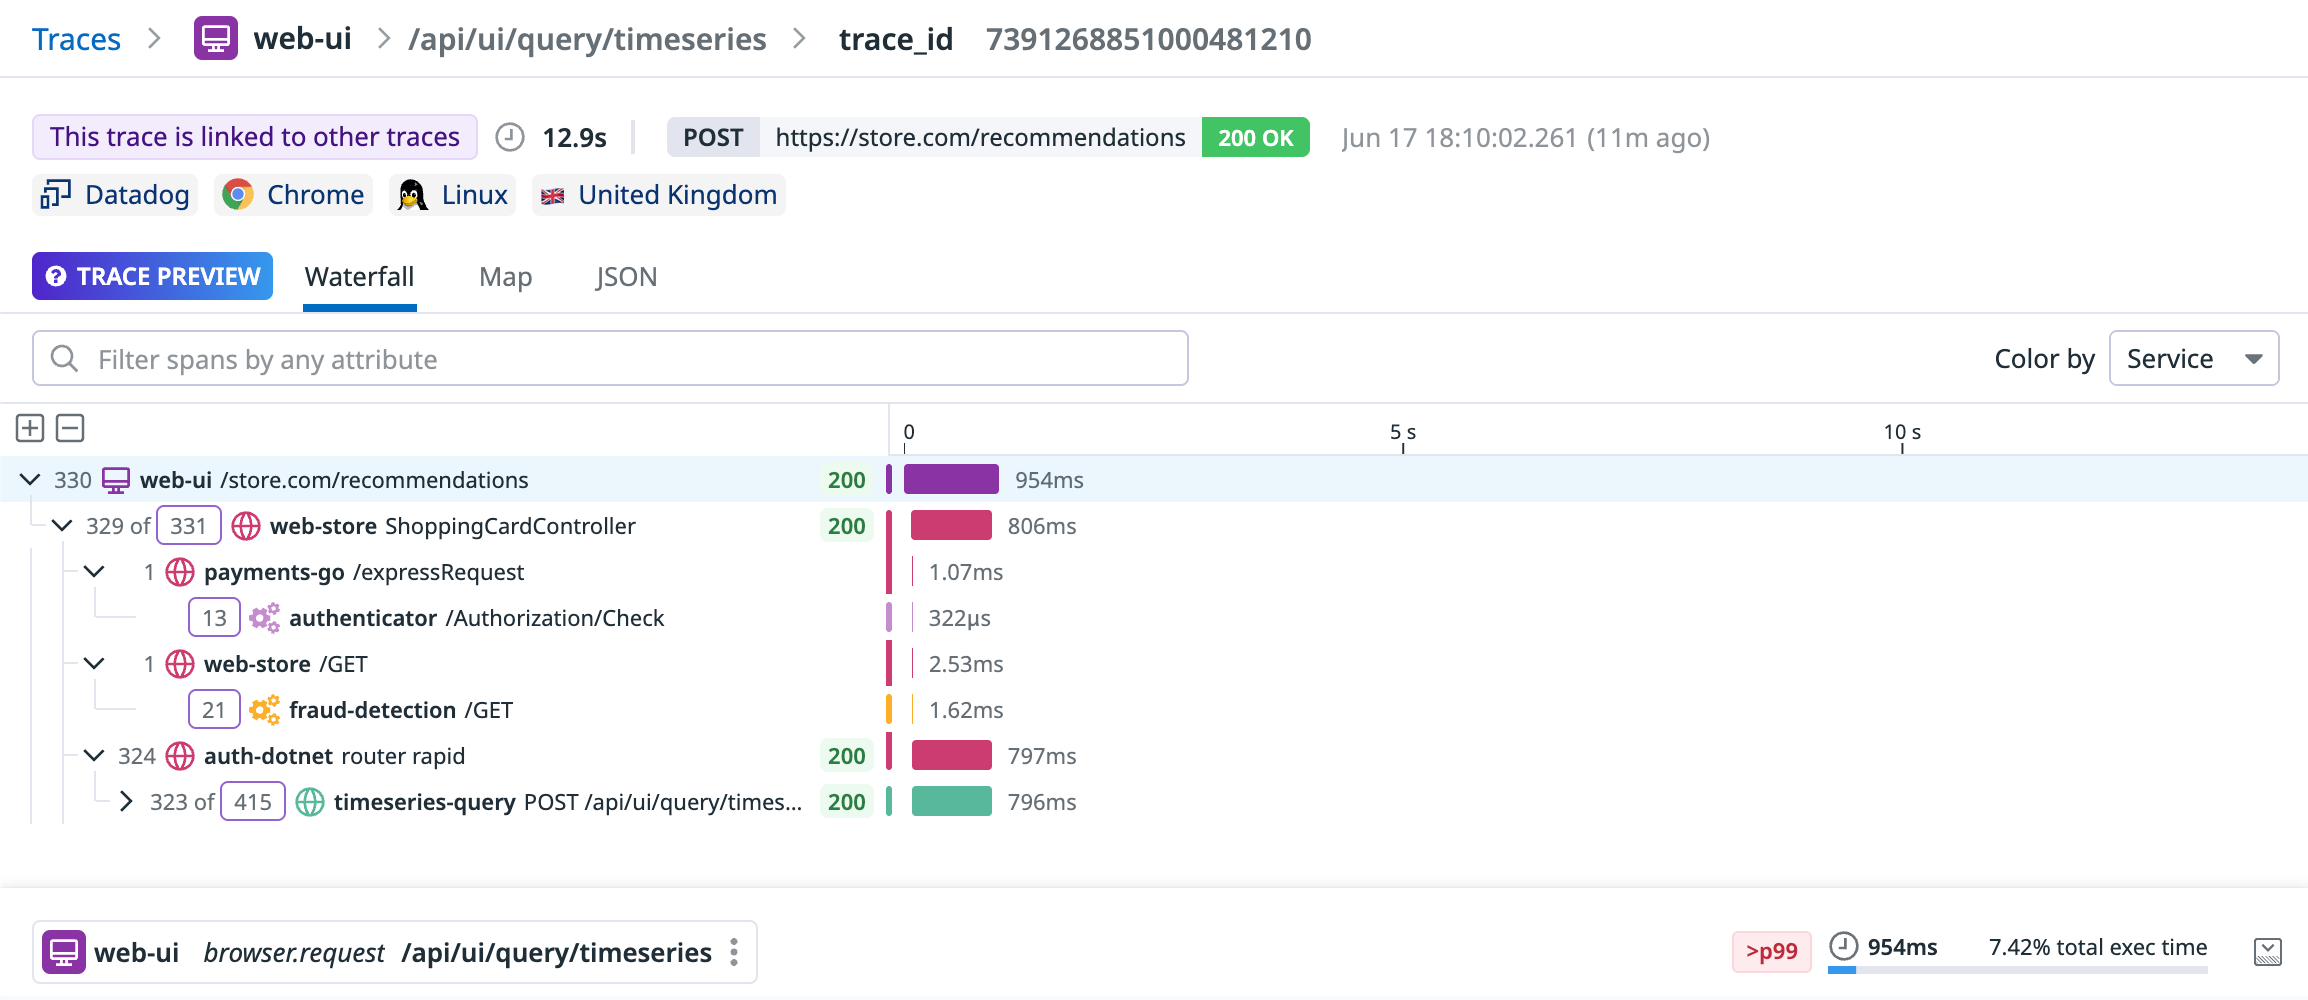
When a trace size exceeds 100MB, it cannot be fully visualized using the default trace side panel. In such cases, Trace Preview mode is enabled. This mode returns only the most critical spans to help you continue your investigation. These include:
- Service entry level spans
- Error spans
- Long-running spans
- Spans linked to other spans or traces
The available visualization options for large traces are limited to the Waterfall and Map views. In Preview mode, the Waterfall view provides additional an option to fetch spans that are not included by default. These spans are grouped and represented using numbered pills. Each pill displays the total number of spans available in that group. You can click on a number pill to expand and view all spans within that group.
Span search
In the Waterfall and Flamegraph visualizations, the search option allows you to find the spans that meet specific queries. Spans that match the search query are highlighted in the trace view and you can navigate between these matches using the arrows next to the search bar.
Note: When the Error checkbox is selected, the search results return spans that match the query and are in an error state.
The search query on the trace side panel supports the following options:
- Free text search:
Free-form text search allows filtering by service, resource, or operation name. It highlights the spans containing the specified text within these categories.
Example:
web - Key-value search:
Use key:value expression to filter spans with specific key-value pairs.
Example:
service:web-ui
Note: Wildcards are not supported in the Trace search bar.
Supported expressions:
- Group expression:
language:(go OR python) - Boolean expression:
service:event-query OR terminator - Range expression:
duration:>200ms
Note: Numerical values support <, >, <=, and >= expressions.
More information
The height-adjustable bottom of the Trace View shows selected span and trace information.
The span header contains service, operation, and resource names of the selected span as well as latency information. Pivot to other parts of the platform or narrow down your Trace Explorer search by clicking on the naming pill.
When the span represents a client call from an instrumented service to a database, a queue, or a third-party service, the span header shows the service and the inferred entity.
See all span metadata, including custom tags. Click on a span tag to update the search query in the Trace Explorer or copy the tag’s value to the clipboard.
Other information may be displayed under various conditions:
Error message and stack trace (on error span)
SQL Query markup (on database spans)
RUM Context and Metadata (on RUM spans)
Spark Metrics (on Spark job spans)
A git warning message (when git information is missing on a CI Test)
When the service name is an override from the base service name, the top of the info section shows the:
Base service: service from which the span is emitted, identified by the
@base_serviceattribute.Service override: service name, different from the base service name, set automatically in Datadog integrations or changed via the programmatic API. The service override is identified by the
servicereserved attribute.Inferred service (when applicable): name of the inferred entity being called by the base service, identified by one of the peer attributes.
Toggle between host-level and container-level (when available) infrastructure information for the selected span.
See associated tags, as well as critical host/container metrics graphs including CPU, Memory, and I/O with an overlay of when the trace occurred.
See logs related to your service at the time of the trace. When you hover over a log, a line showing its timestamp is displayed on the trace flame graph. Clicking on the log brings you to the Log Explorer search.
Click on a service’s span to see the processes running on its underlying infrastructure. A service’s span processes are correlated with the hosts or pods on which the service runs at the time of the request. You can analyze process metrics such as CPU and RSS memory alongside code-level errors to distinguish between application-specific and wider infrastructure issues. Clicking on a process will bring you to the Live Processes page. To view span-specific processes, enable process collection. Related processes are not currently supported for serverless and browser traces.
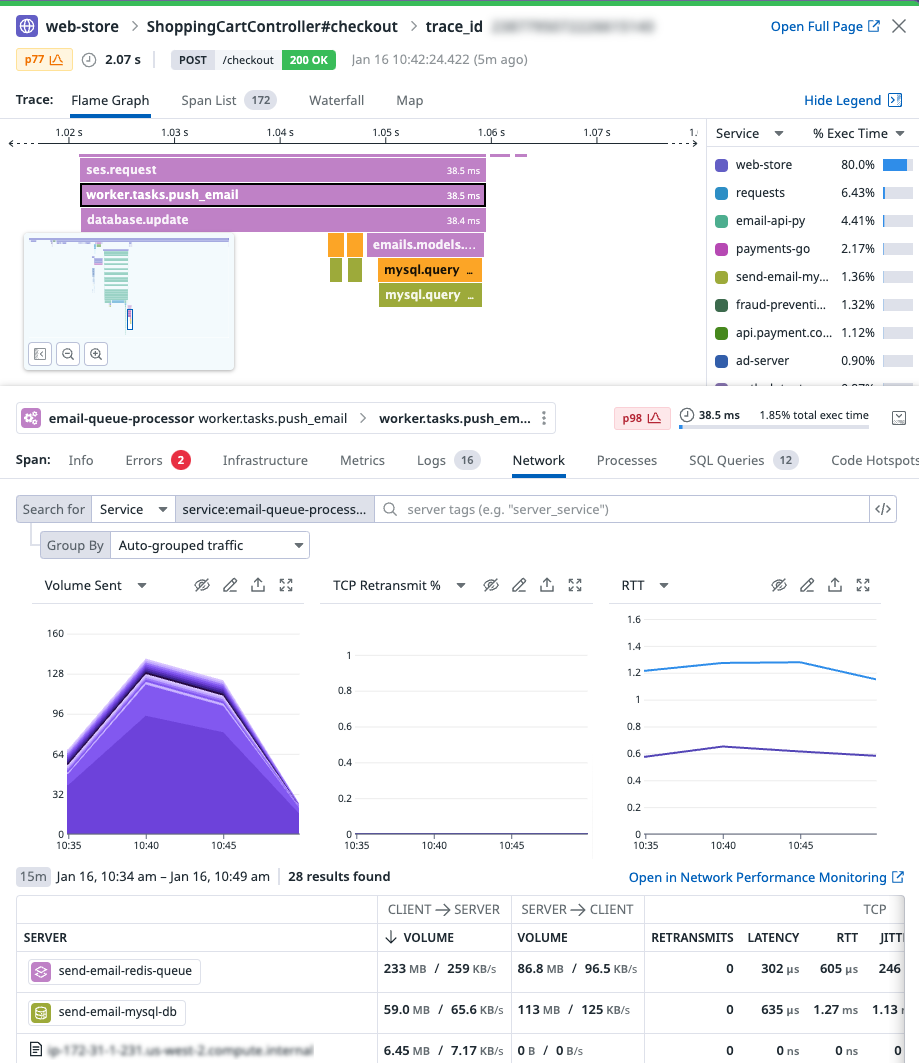
Click on a service’s span to see network dependencies of the service making the request. Use key network performance metrics such as volume, errors (TCP retransmits), and network latency (TCP round-trip time) to differentiate between application-specific and network-wide issues, especially when no code errors have been generated. For instance, you can use network telemetry to determine if high request latency is due to traffic overloading of the relevant application, or faulty dependencies with a downstream pod, security group, or any other tagged endpoint. Clicking on a process brings you to the Network Analytics page. To view span-specific processes, enable Cloud Network Monitoring.
Note: Related network telemetry is not currently supported for serverless traces.
See attack attempts that target the services of the distributed trace. You can see the pattern used by the attacker, the rule that detects the attack, and whether the attacker found a vulnerability in your service.
Click View in AAP to investigate further using Datadog App and API Protection.
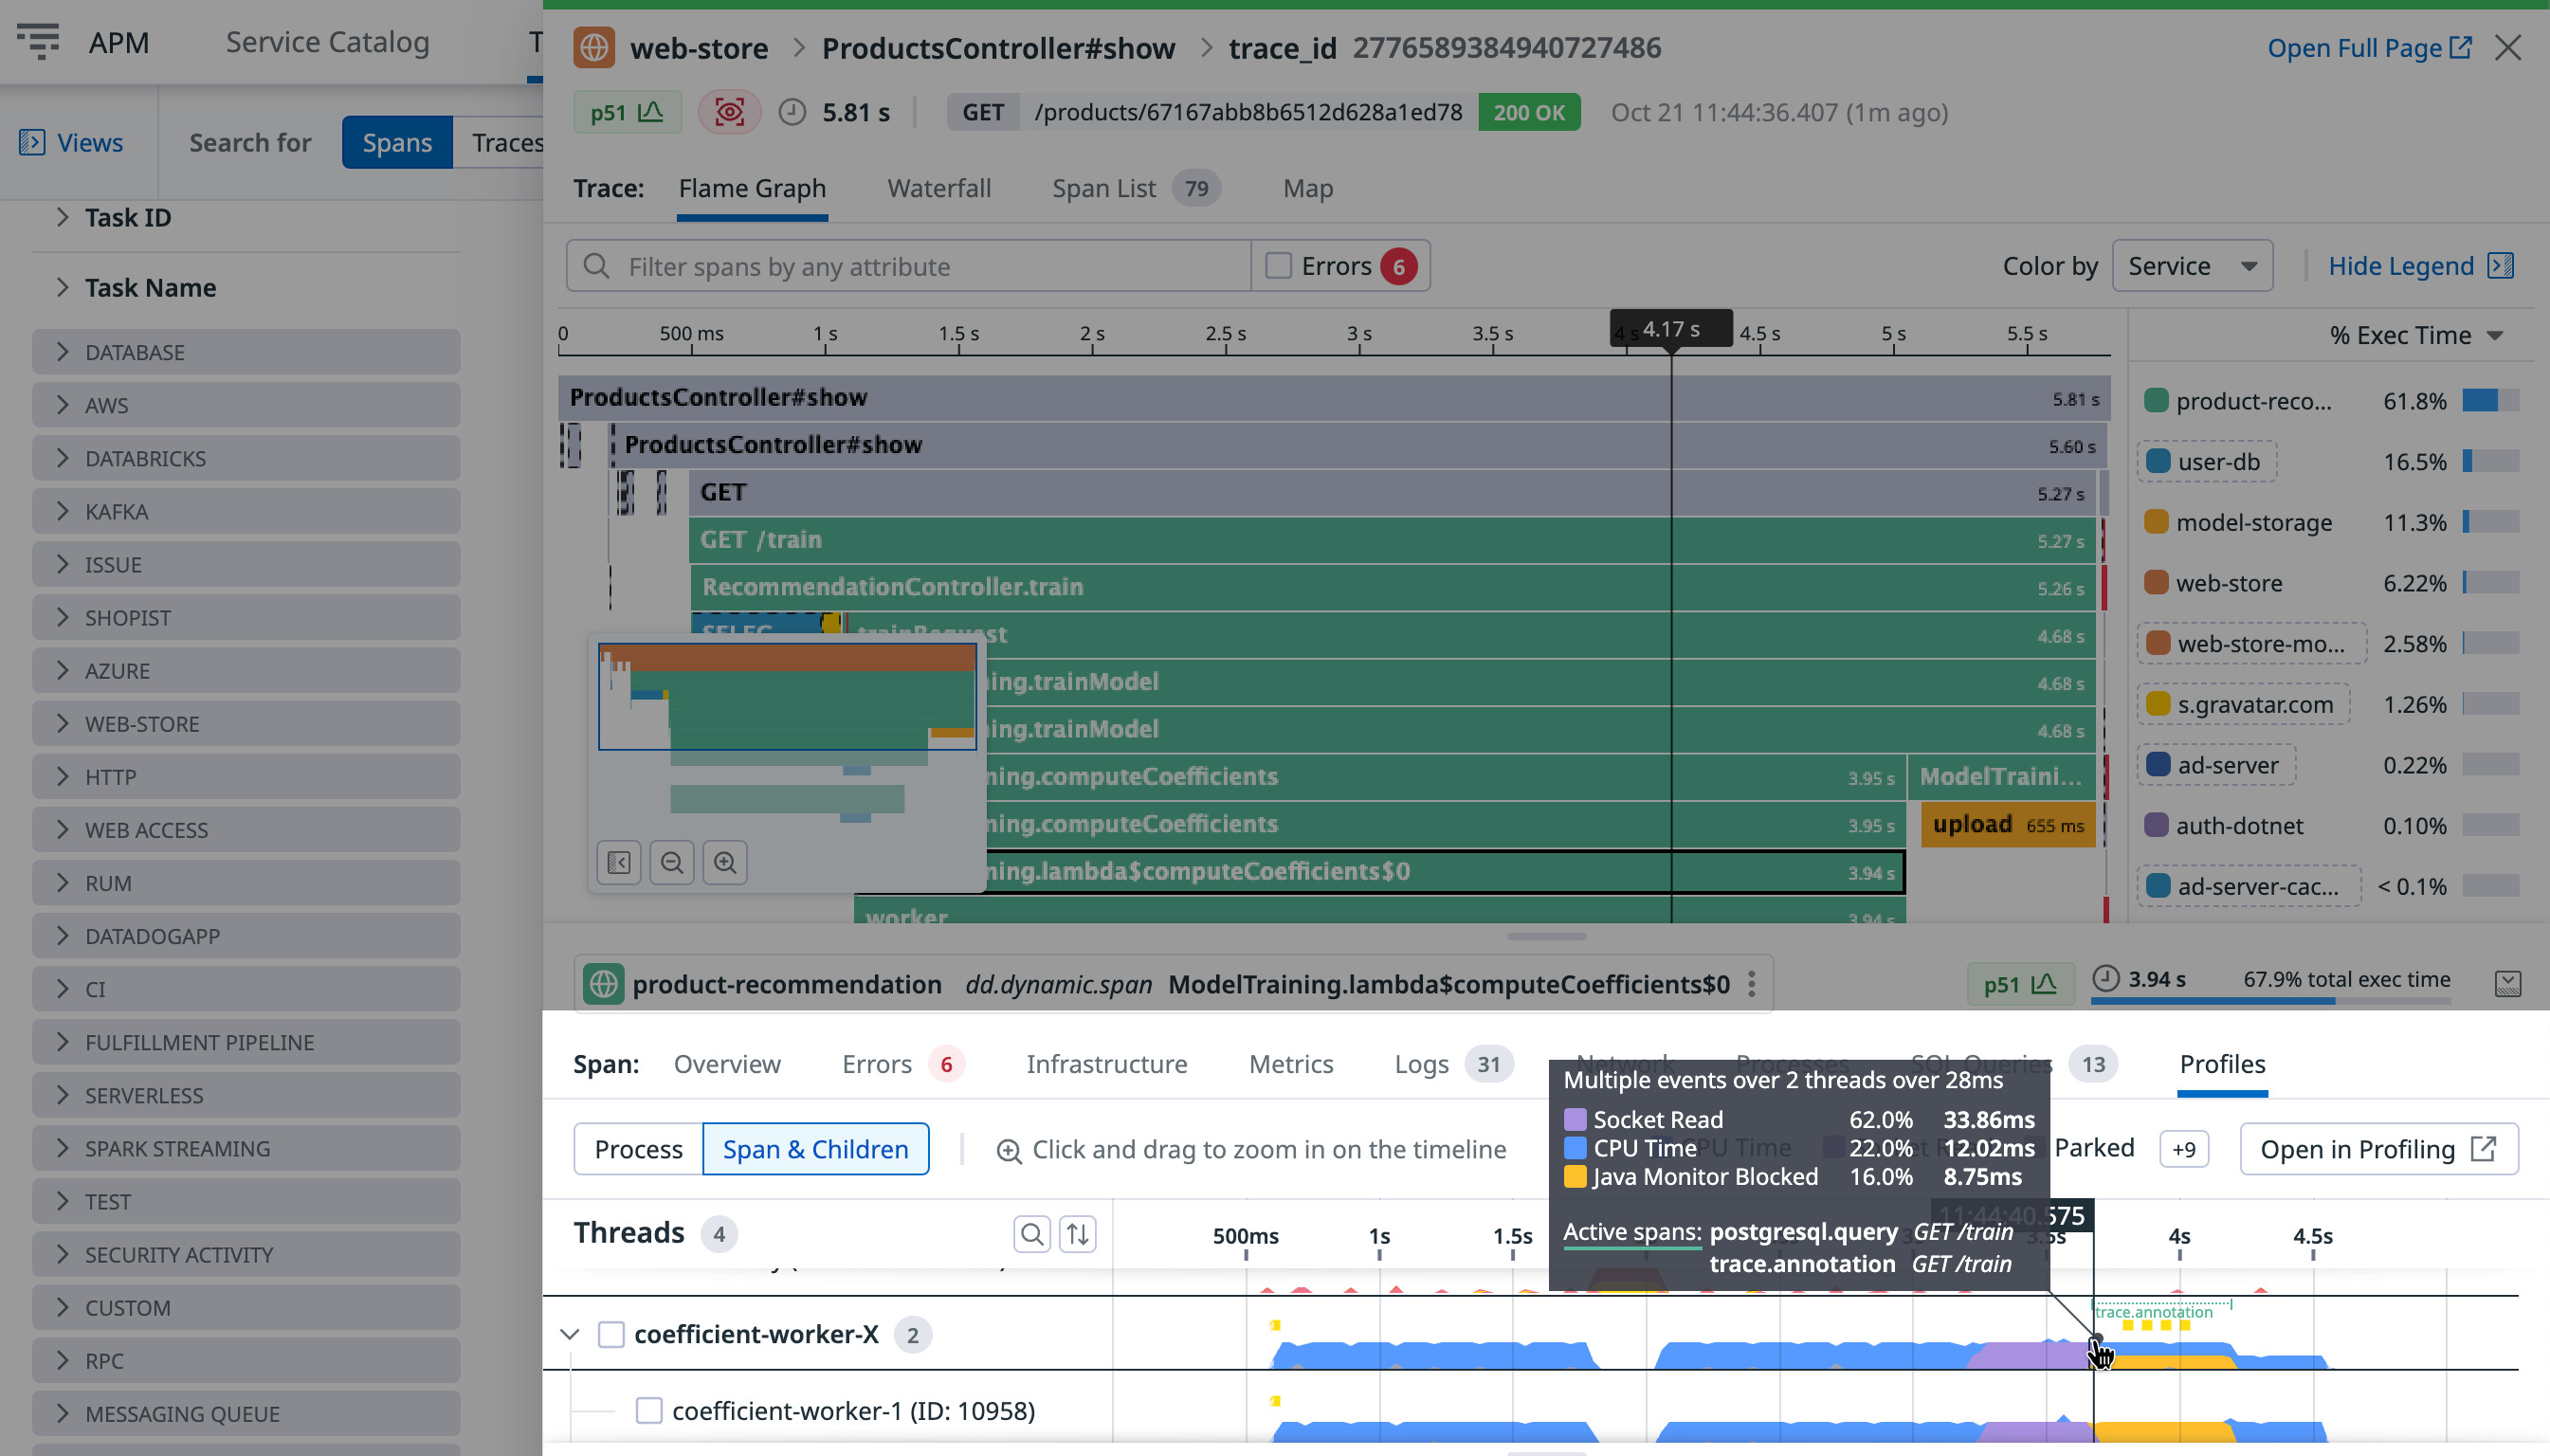
View Profiles to identify lines of code related to performance issues. The values on the left side represent the time spent in each method call during the selected span.
Span links correlate one or more spans together that are causally related but don’t have a typical parent-child relationship.
Click a span in the flame graph to display spans connected with span links:
Note: Span links only display when the corresponding spans are ingested and indexed, for example, with a retention filter.
To learn more about span links and how to add them with custom instrumentation, read Span Links.
Further Reading
Additional helpful documentation, links, and articles:


