Search query
All search parameters are contained in the url of the page, which can be helpful for sharing your view.
Search syntax
A query is composed of terms and operators.
There are two types of terms:
- Span attribute: Content of the span, collected with automatic or manual instrumentation in the application.
- Span tag: Enrichments of context related to the span. For instance, host or container tags describing the infrastructure the service is running on.
To combine multiple terms into a complex query, use any of the following boolean operators:
| Operator | Description | Example |
|---|
AND | Intersection: both terms are in the selected events (if nothing is added, AND is taken by default) | authentication AND failure |
OR | Union: either terms is contained in the selected events | authentication OR password |
- | Exclusion: the following term is NOT in the event | authentication AND -password |
Attribute search
To search for a span attribute you must add @ at the beginning of the attribute key.
For instance, if you want to access a span with the following attribute below, you can use:
@git.commit.sha:12345
  "git": {
    "commit": {
      "sha": "12345"
    },
    "repository": {
      "id": "github.com/datadog/datadog"
    }
  }
Span attributes are visible in the Overview tab of the trace side panel.
Note: You do not need to use @ on the reserved attributes: env, operation_name, resource_name, service, status, span_id, timestamp, trace_id, type, link
Your spans inherit tags from hosts and integrations that generate them.
For example:
| Query | Match |
|---|
(hostname:web-server OR env:prod) | All traces with the infrastructure tag hostname:web-server or the reserved attribute env:prod |
(availability-zone:us-east OR container_name:api-frontend) | All traces with either of these infrastructure tags |
(service:api AND -kube_deployment:canary) | All traces from the api service that are not deployed to the canary deployment |
Span tags are visible in the Infrastructure tab of the trace side panel.
If your tags don’t follow tags best practices, then do not use key:value syntax. Instead, use the following search query:
tags:<MY_TAG>
For example, this tag does not follow the best practices:
auto-discovery.cluster-autoscaler.k8s.io/daffy
To search for this tag, use the following query:
tags:"auto-discovery.cluster-autoscaler.k8s.io/daffy"
Wildcards
To perform a multi-character wildcard search, use the * symbol as follows:
service:web* matches every trace that has a services starting with web@url:data* matches every trace that has a url starting with data.
Numerical values
Use <,>, <=, or >= to perform a search on numerical attributes. For instance, retrieve all traces that have a response time over 100ms with:
@http.response_time:>100
It is also possible to search for numerical attributes within a specific range. For instance, retrieve all your 4xx errors with:
@http.status_code:[400 TO 499]
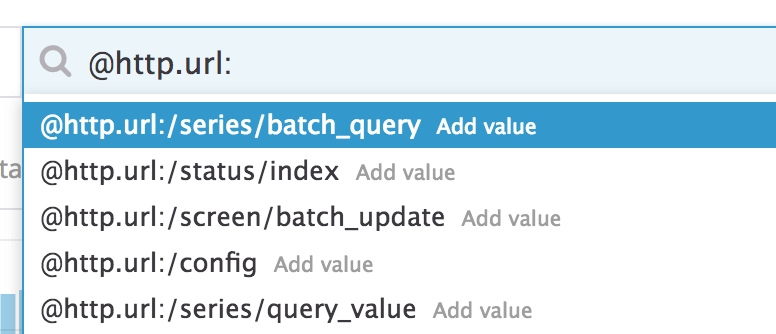
Autocomplete
Typing a complex query can be cumbersome. Use the search bar’s autocomplete feature to complete your query using existing values:
Escaping of special characters
The following attributes are considered as special: ?, >, <, :, =,", ~, /, and \ require escaping.
For instance, to search traces that contain user=JaneDoe in their url the following search must be entered:
@url:*user\=JaneDoe*
The same logic must be applied to spaces within trace attributes. It is not recommended to have spaces in trace attributes but in such cases, spaces require escaping.
If an attribute is called user.first name, perform a search on this attribute by escaping the space:
@user.first\ name:myvalue
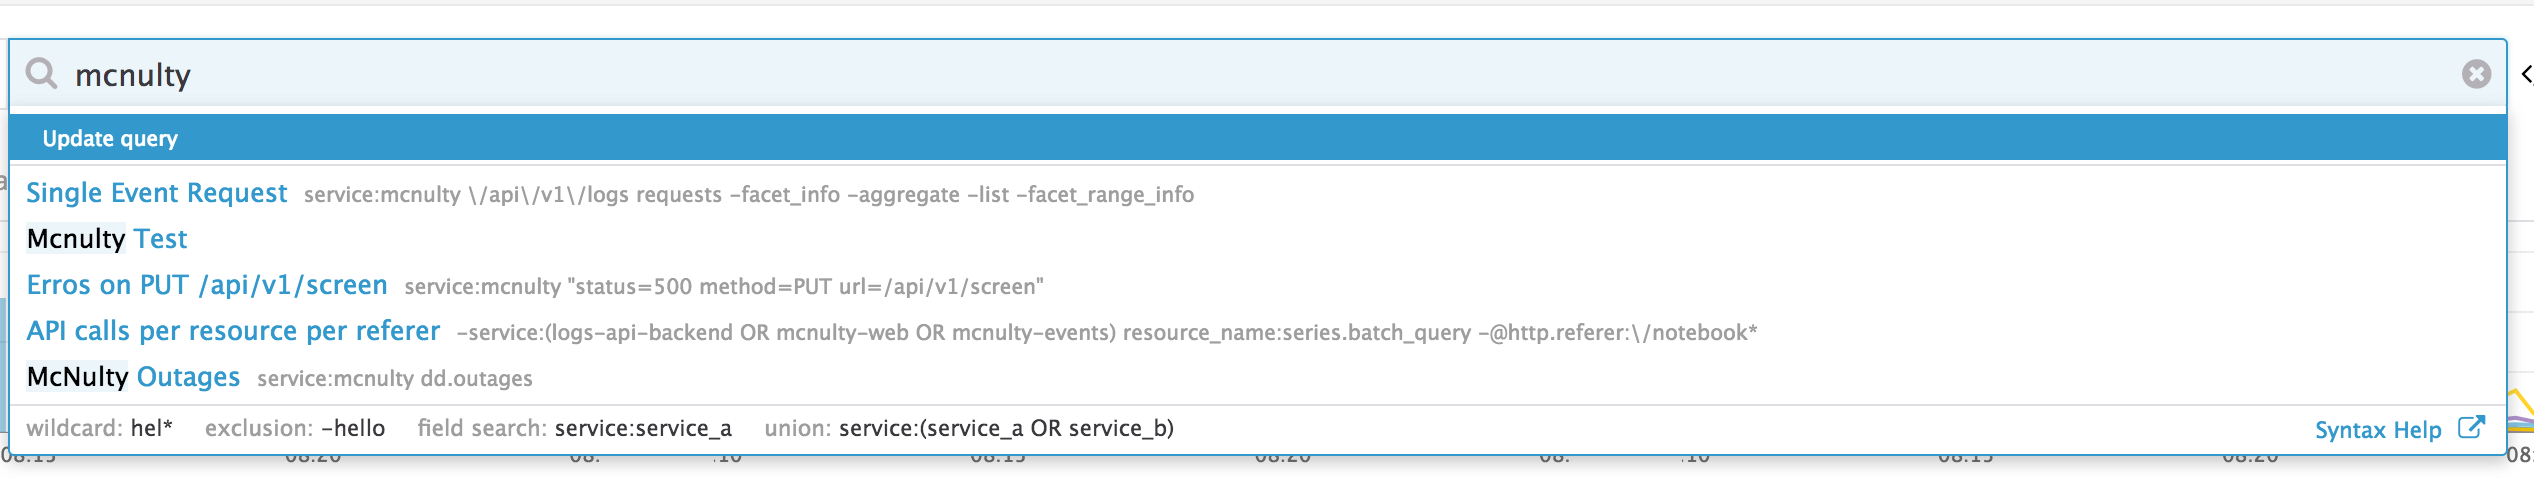
Saved searches
Don’t lose time building the same views everyday. Saved searches contain your search query, columns, and time horizon. They are then available in the search bar thanks to the auto-complete matching whether the search name or query.
To delete a saved search, click on the bin icon under the Trace search dropdown menu.
Search for services and entities
To search for a service, use the service attribute. To search for another entity type (for example, a database, a queue, or a third-party provider), rely on other peer attributes which Datadog uses to describe dependencies that are not instrumented with APM. For instance, to find spans representing calls to a users table from a postgres database, use the following query: @peer.db.name:users @peer.db.system:postgres
Note: The span’s service tag represents the service emitting the span if you migrated to the global service naming by setting DD_TRACE_REMOVE_INTEGRATION_SERVICE_NAME_ENABLED=true.
Time range
The time range allows you to display traces within a given time period. Quickly change the time range by selecting a preset range from the dropdown menu (or entering a custom time frame):
Span table
The Span table is the list of spans that match the selected context. A context is defined by a search bar filter and a time range.
The service column
By default, the service column shows the service reserved attribute from the span.
When the span represents a client call from an instrumented service to an inferred service, the service column shows:
the service, identified by the service reserved attribute.
the inferred service: name of the inferred entity being called by the base service, identified by one of the peer attributes
When the service name is an override from the base service name, the service column shows:
the base service: service from which the span is emitted, identified by the @base_service attribute.
the service override: service name, different from the base service name, set automatically in Datadog integrations or changed via the programmatic API. The service override is identified by the service reserved attribute.
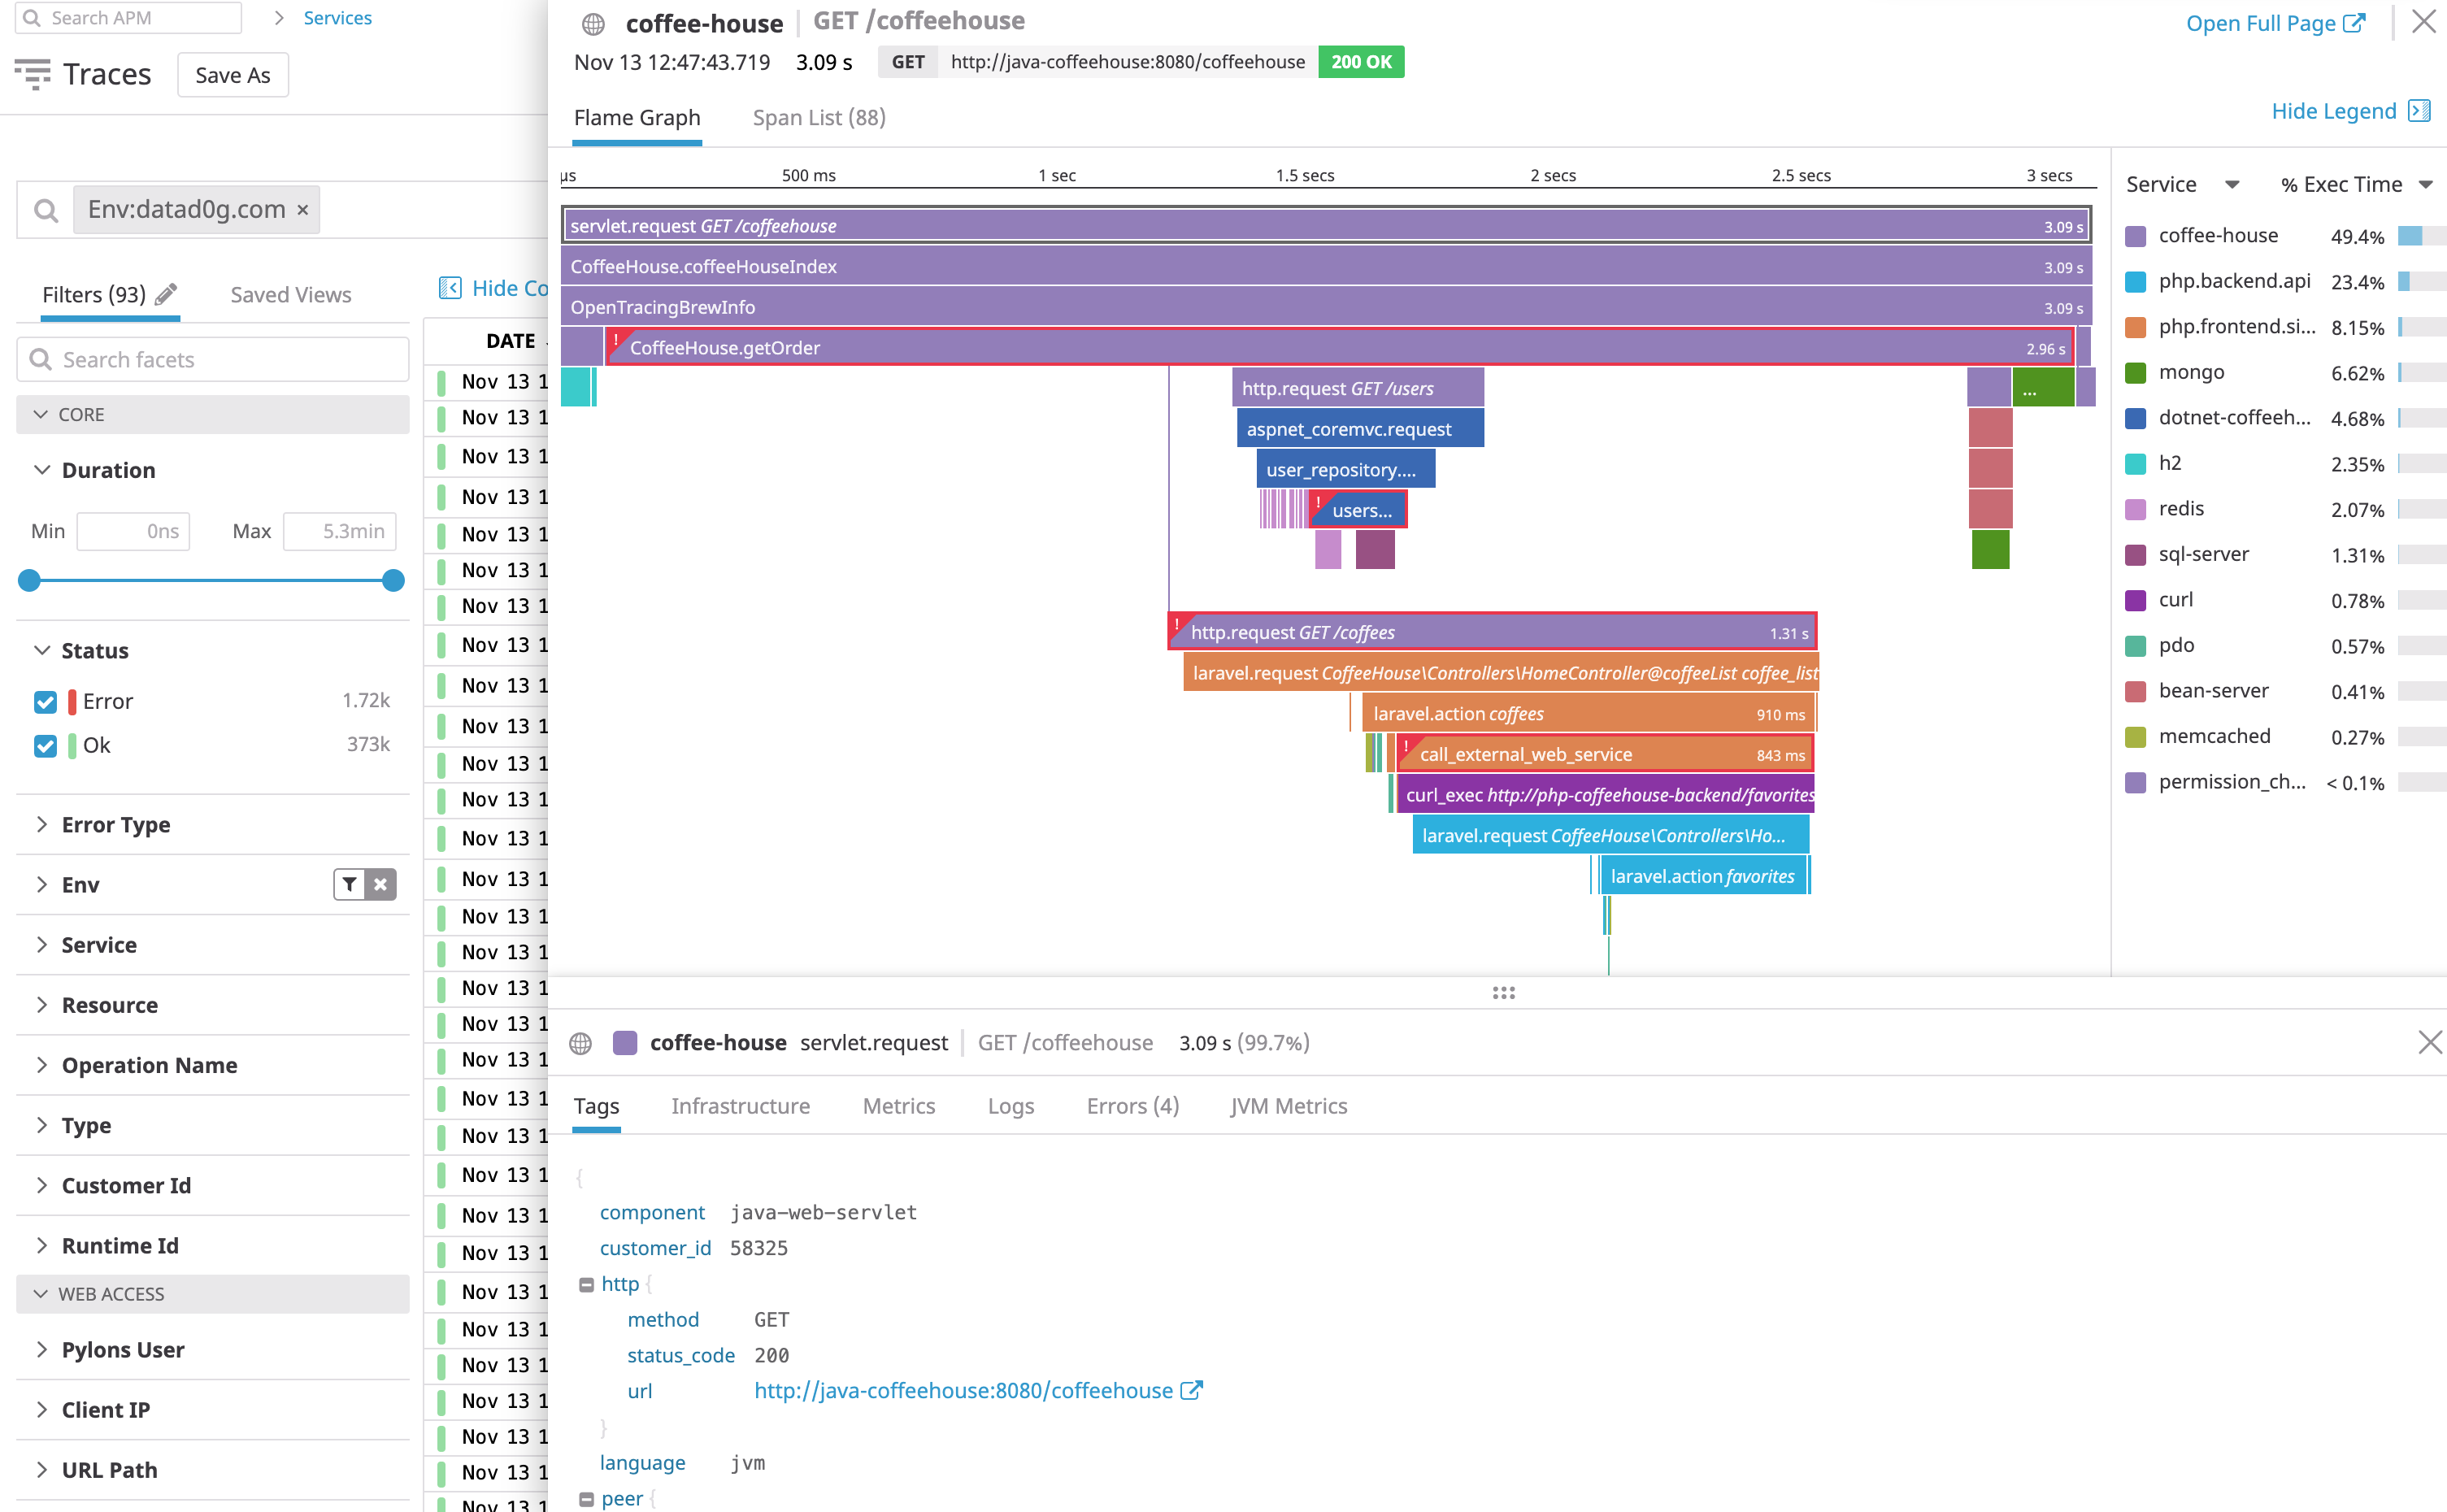
Displaying a full trace
Click on any span to see details about the associated trace:
Columns
To add other span tags or attributes as columns to the list, click the Options button and select any dimension you want to add:
Trace Groups
Group the query by any span tag or attribute to observe request counts, error rates and latency distributions in the list view. You can select up to four dimensions in the Group by clause.
Advanced ‘Group By’ queries
After selecting a dimension to group by, you can specify where to get the dimension’s values from using the from dropdown:
- Span: Group by the dimension of the queried span (default). For example,
a. - Parent of span: Group by the specified dimension from the parent span of spans matching the query. For example, to visualize how an API endpoint performs based on the service calling it, group by
service from parent(a). - Root span: Group by the specified dimension from the root span of the trace. For example, to analyze backend request patterns based on the frontend pages requests originate from, group by
@view.name from root.
View trace groups in the group list
Trace groups are displayed as unique values of the selected dimension. Each group is shown with three key metrics:
- REQUESTS: Count of spans within the group.
- ERRORS: Error rate and count of errors.
- P95 Latency: p95 latency of spans.
To view these metrics aggregated over the parent or root span instead of the queried span, select parent(a) or root in the Show metrics from statement.
Additionally, the Latency Breakdown surfaces how time is spent between different services within requests from each group, allowing you to visually spot latency bottlenecks for given groups.
For deeper analysis, click any group to examine the individual span events that make up the aggregated metrics.
Facets
A Facet displays all the distinct values of an attribute or a tag as well as provides some basic analytics such as the amount of traces represented. This is also a switch to filter your data.
Facets allow you to pivot or filter your datasets based on a given attribute. Examples Facets may include users, services, etc…
Measures
Measures are the specific type of facets for quantitative values.
Use measures when you need to:
- Aggregate values from multiple traces. For example, create a measure on the number of rows in Cassandra and view the P95 or top-most referrers per sum of file size requested.
- Numerically compute the highest latency services for shopping cart values over $1000.
- Filter continuous values. For example, the size in bytes of each payload chunk of a video stream.
Types
Measures come with either a (long) integer or double value, for equivalent capabilities.
Units
Measures support units (time in seconds or size in bytes) for handling of orders of magnitude at query time and display time. Unit is a property of the measure itself, not of the field. For example, consider a duration measure in nanoseconds: you have a span tag from service:A where duration:1000 stands for 1000 milliseconds, and another span tags from service:B where duration:500 stands for 500 microseconds:
Scale duration into nanoseconds for all span tags flowing in with the arithmetic processor. Use a *1000000 multiplier on span tags from service:A, and a *1000 multiplier on span tags from service:B.
Use duration:>20ms (see search syntax for reference) to consistently query span tags from both services at once, and see an aggregated result of max one minute.
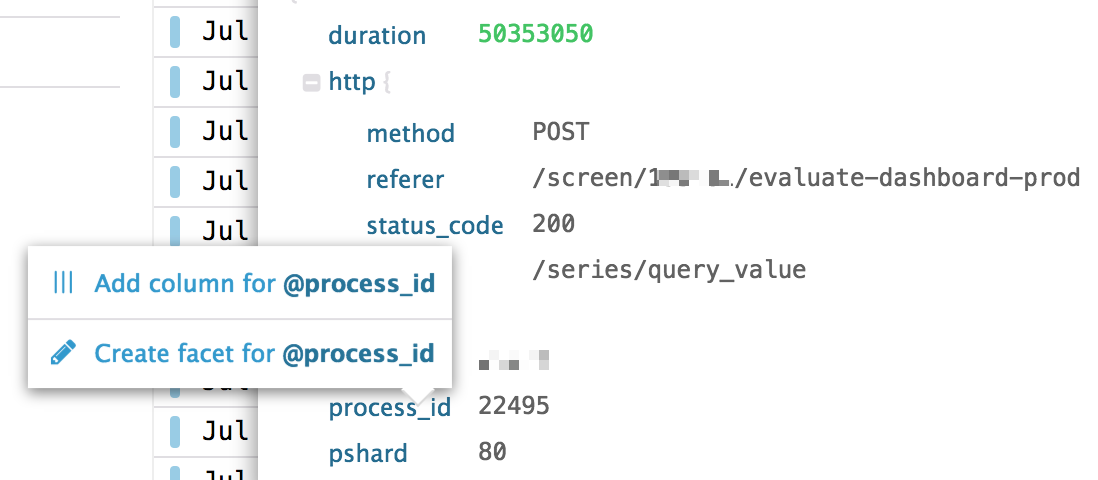
Create a facet
To start using an attribute as a Facet or in the search, click on it and add it as a Facet:
After you create a new facet, it is available in the facet panel for filtering and basic analytics.
Facet panel
Use Facets to filter on your Traces. The search bar and url automatically reflect your selections.
Visualizations
Select an Analytics visualization type using the Analytic selector:
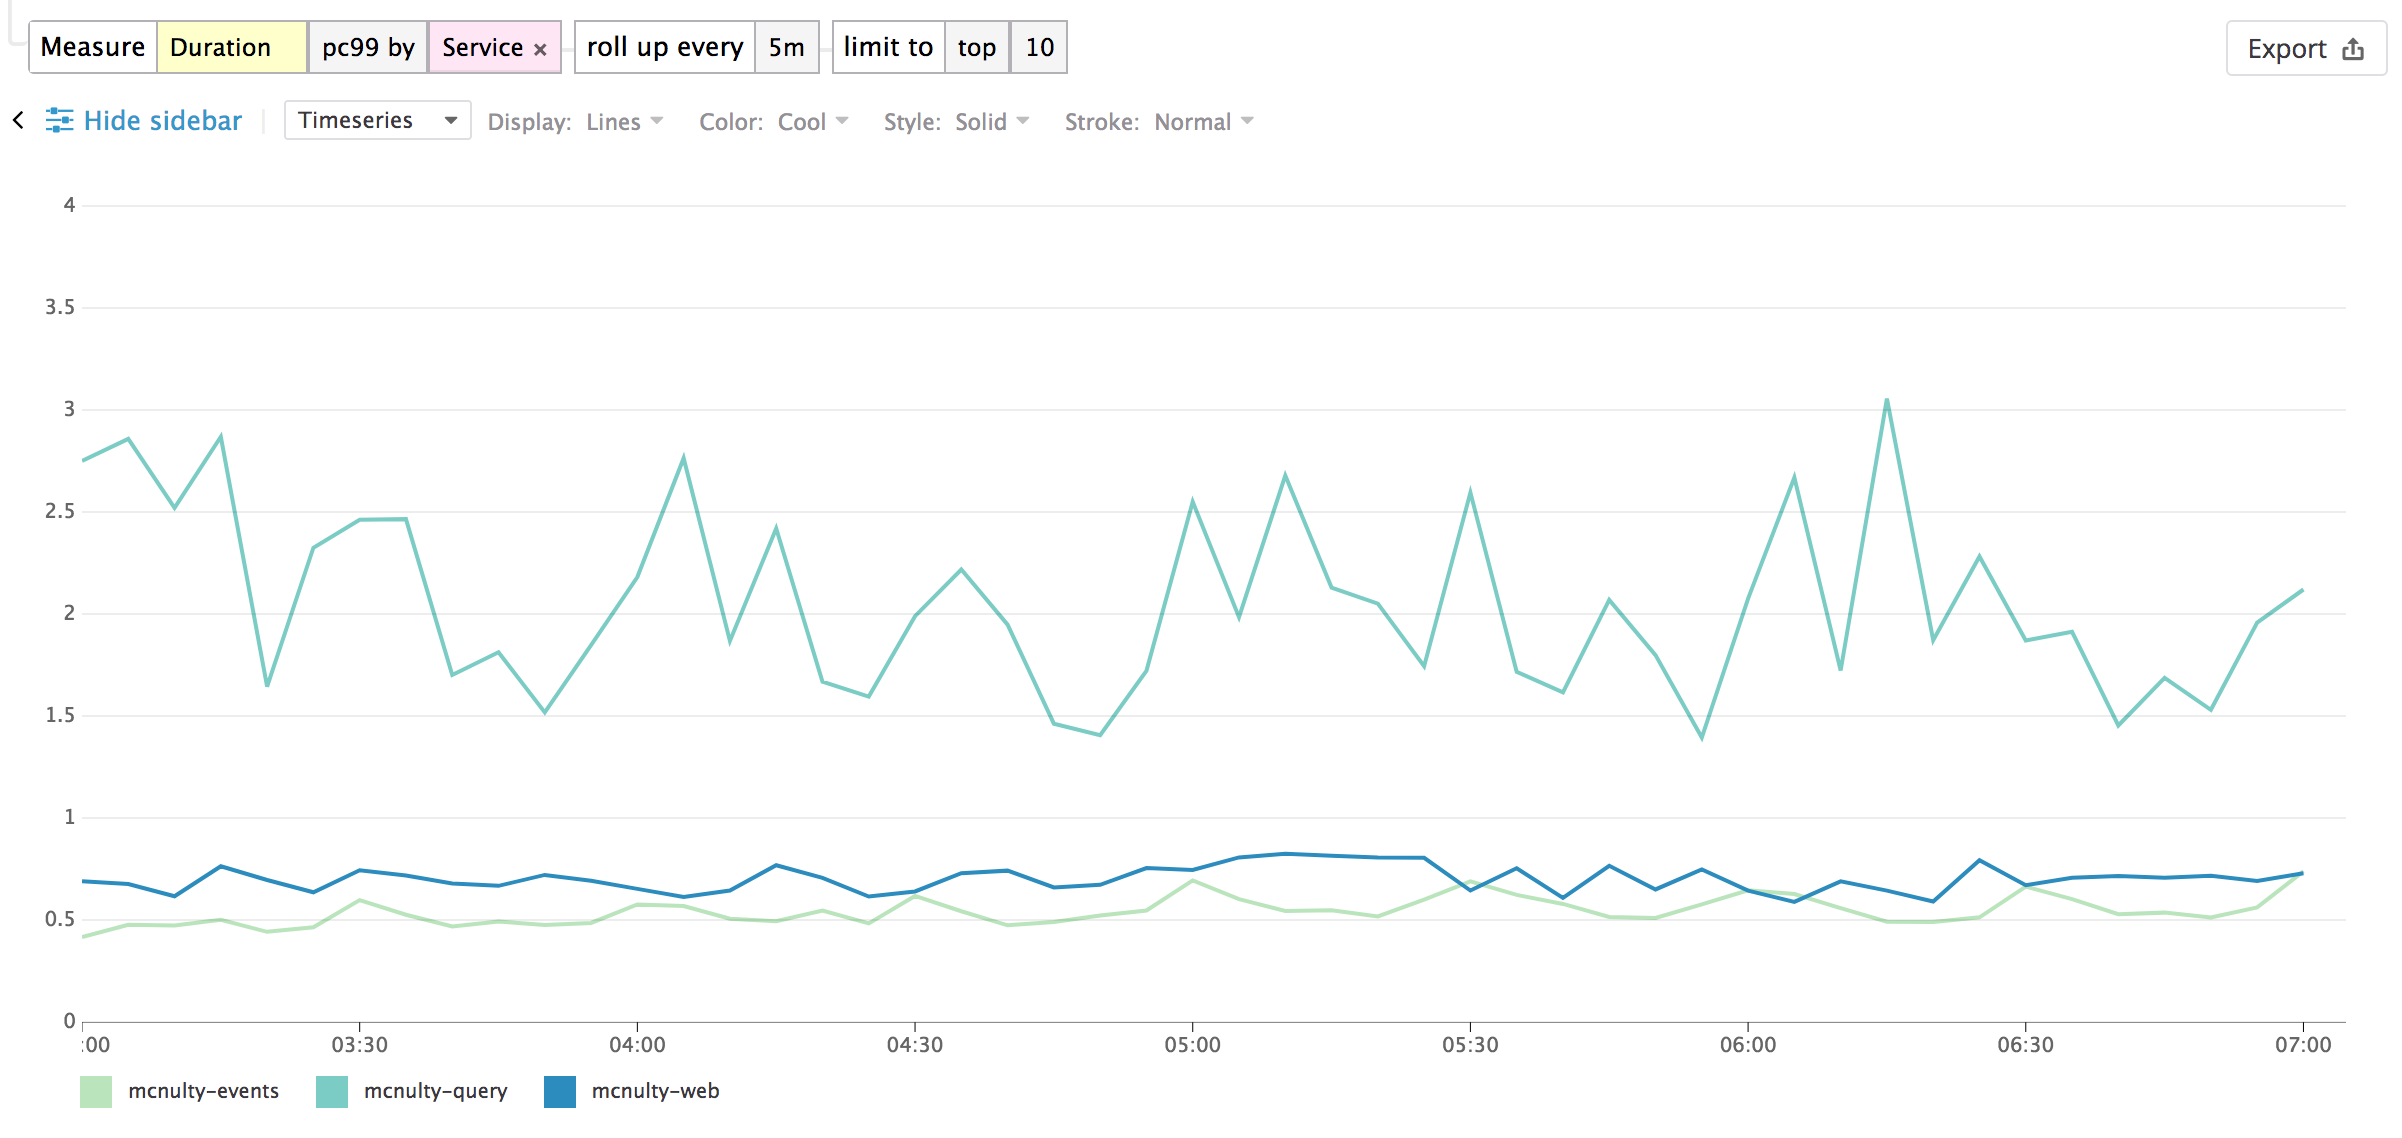
Timeseries
Visualize the evolution of the Duration metric (or a facet unique count of values) over a selected time frame, and (optionally) split by an available facet.
The following timeseries Analytics shows the evolution of the pc99 duration by steps of 5min for each Service
Top list
Visualize the top values from a facet according to their Duration (or a facet unique count of values).
The following top list analytics shows the top pc99 duration of Service:
Table
Visualize the top values from a facet according to a chosen measure (the first measure you choose in the list), and display the value of additional measures for elements appearing in this top list. Update the search query or investigate logs corresponding to either dimension.
- When there are multiple dimensions, the top values are determined according to the first dimension, then according to the second dimension within the top values of the first dimension, then according to the third dimension within the top values of the second dimension.
- When there are multiple measures, the top or bottom list is determined according to the first measure.
- The subtotal may differ from the actual sum of values in a group, since only a subset (top or bottom) is displayed. Events with a null or empty value for this dimension are not displayed as a sub-group.
Note: A table visualization used for one single measure and one single dimension is the same as a toplist, just with a different display.
The following Table Log Analytics shows the evolution of the top Status Codes according to their Throughput, along with the number of unique Client IPs, and over the last 15 minutes:
Select or click on a section of the graph to either zoom in the graph or see the list of traces corresponding to your selection:
Export
Export your queries:
You can also generate a new metric for the query.
Note: APM queries in dashboards and notebooks are based on all indexed spans. APM queries in monitors are based on spans indexed by custom retention filters only.
Further Reading
Additional helpful documentation, links, and articles: