- Essentials
- Getting Started
- Datadog
- Datadog Site
- DevSecOps
- Serverless for AWS Lambda
- Agent
- Integrations
- Containers
- Dashboards
- Monitors
- Logs
- Tracing
- Profiler
- Tags
- API
- Service Catalog
- Session Replay
- Continuous Testing
- Synthetic Monitoring
- Incident Management
- Database Monitoring
- Cloud Security Management
- Cloud SIEM
- Application Security Management
- Workflow Automation
- CI Visibility
- Test Visibility
- Intelligent Test Runner
- Learning Center
- Support
- Glossary
- Standard Attributes
- Guides
- Agent
- Integrations
- OpenTelemetry
- Developers
- Authorization
- DogStatsD
- Custom Checks
- Integrations
- Create an Agent-based Integration
- Create an API Integration
- Create a Log Pipeline
- Integration Assets Reference
- Build a Marketplace Offering
- Create a Tile
- Create an Integration Dashboard
- Create a Recommended Monitor
- Create a Cloud SIEM Detection Rule
- OAuth for Integrations
- Install Agent Integration Developer Tool
- UI Extensions
- Service Checks
- IDE Plugins
- Community
- Guides
- API
- CoScreen
- Cloudcraft
- In The App
- Dashboards
- Notebooks
- Monitors and Alerting
- Infrastructure
- Metrics
- Watchdog
- Bits AI
- Service Catalog
- API Catalog
- Error Tracking
- Service Management
- Infrastructure
- Application Performance
- APM
- Continuous Profiler
- Database Monitoring
- Data Streams Monitoring
- Data Jobs Monitoring
- Digital Experience
- Real User Monitoring
- Synthetic Monitoring
- Continuous Testing
- Mobile Application Testing
- Software Delivery
- Security
- Security Overview
- Cloud SIEM
- Cloud Security Management
- Application Security Management
- Log Management
- Observability Pipelines
- Log Management
- Administration
Trace Explorer
Overview
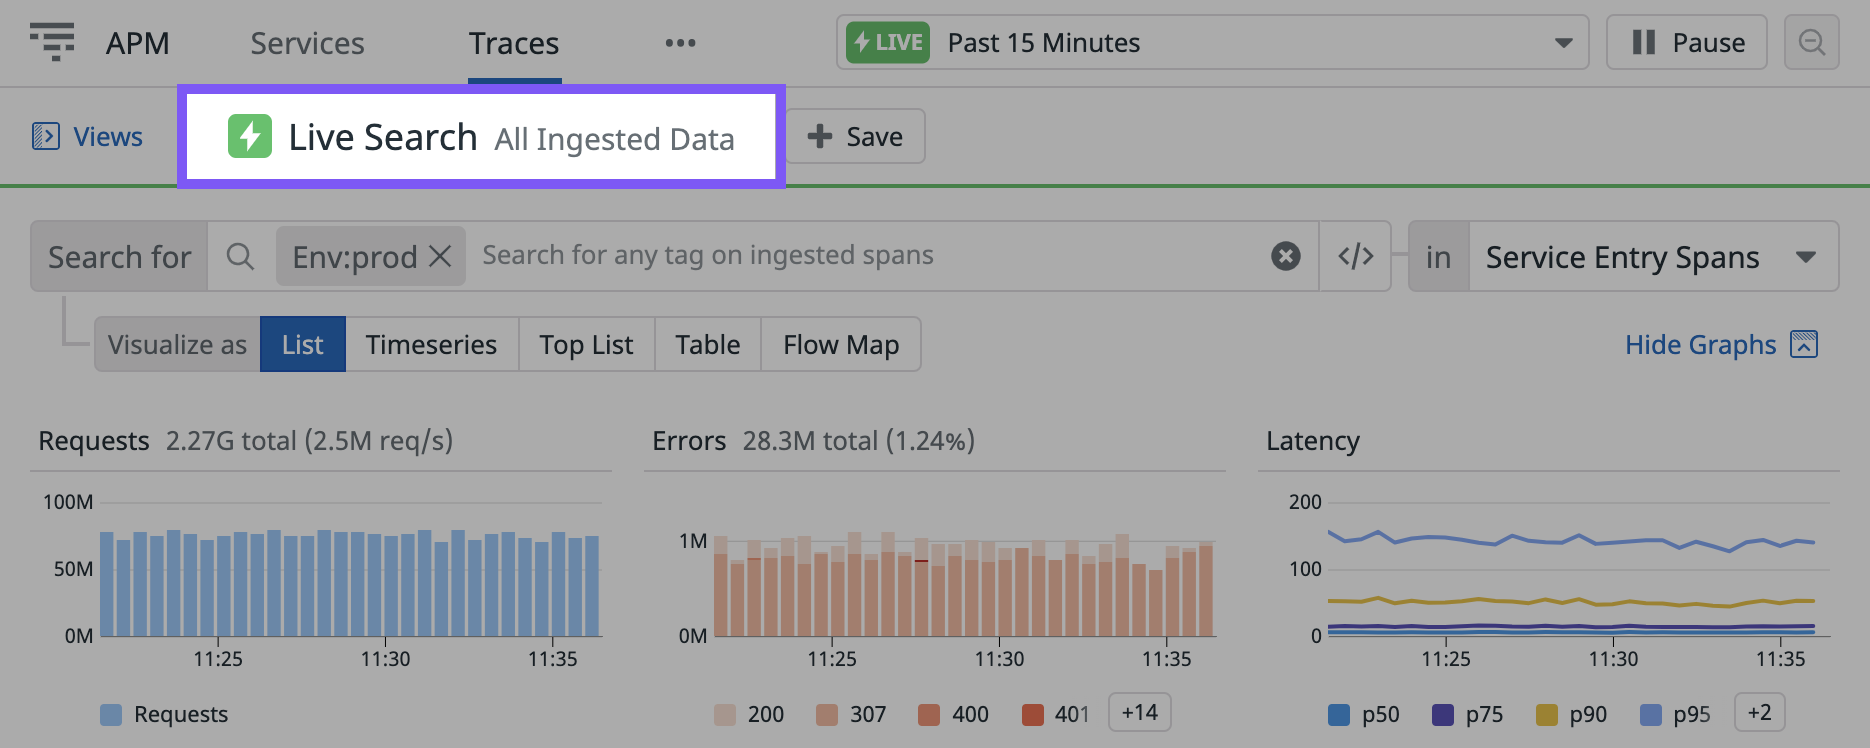
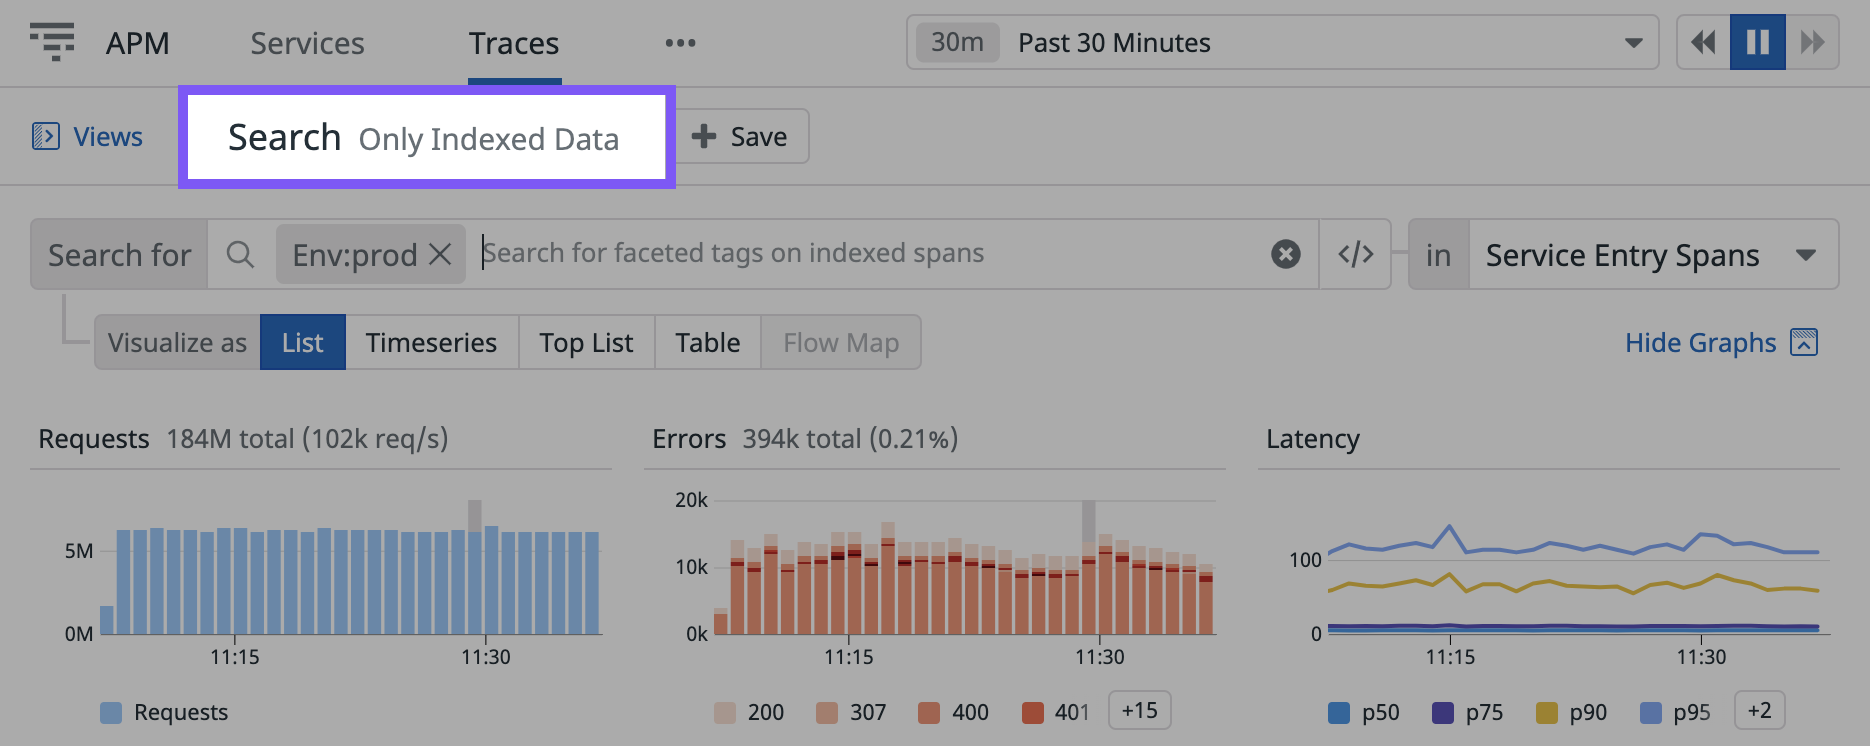
The Trace Explorer gives you the ability to search all ingested or indexed spans using any tag on any span. The spans found by your query change depending on whether you are searching Live (all spans ingested in the last 15 minutes, rolling) or indexed spans (spans retained for 15 days by your custom filters).
Instrumented applications send 100% of their traces to Datadog for ingestion, making the traces available as Live traces for a rolling window of 15 minutes.
The Trace Explorer shows a Live Search - All ingested data indicator whenever you are in Live mode:
All ingested traces are then passed through:
- Custom retention filters that you can create to determine which spans to index. Once indexed through a custom retention filter, traces are retained for 15 days.
- The default intelligent retention filter that retains a diverse set of traces. When indexed through the intelligent retention filter, traces are retained for 30 days.
The Trace Explorer shows an Search - Only Indexed Data indicator whenever you search indexed spans:
Live Search is the default view on the Traces page. Switch from Live Search to Indexed Data Search by using the time selector in the top right-hand corner.
Trace volume control
You can customize settings for both ingestion and retention to send and keep exactly what data is most relevant to you.
Ingestion
Control your volume globally with Datadog Agent configuration options or set precise ingestion rules per service instrumented with Datadog APM.
Indexing
After you instrument your services and ingest traces, set tag-based retention filters within the Datadog app so that Datadog retains spans that are relevant to you.
Note: Both ingested and indexed spans may impact your bill. For more information, see APM Billing.
Live Search for 15 minutes
When you use Live Search, Datadog displays spans as soon as they are sent by the Datadog Agent and before they have been indexed by your retention filters. All ingested spans are available for the last 15 minutes (rolling window), displayed without any sampling.
With the List view, you can:
- Monitor whether a new deployment went smoothly by filtering on
version_idof all tags. - View outage-related information in real time by searching 100% of ingested traces for a particular
org_idorcustomer_idthat is associated with a problematic child span. - Check if a process has correctly started by typing
process_idand autocompleting the new process ID as a tag on child spans. - Monitor load test and performance impact on your endpoints by filtering on the duration of a child resource.
- Run one-click search queries on any span or tag directly from the trace panel view.
- Add, remove, and sort columns from span tags for a customized view.
The number of received spans per second is displayed at the top of the traces table. Since a stream of thousands of spans per second is not human readable, high throughput span streams show some spans for visual clarity. You can search for all available spans in the search query. Use the Live Search query bar filtering features to filter the spans stream and the Pause/Play button at the top right of the screen to pause or resume the stream.
Note: Selecting any span pauses the stream and displays more details about the selected span in the trace side panel.
Visualize your spans as timeseries instead of a list using the Timeseries view. The Live Search Timeseries view is useful for graphing requests or errors that correspond to specified criteria, such as:
Errors for the
ShoppingCart##checkoutservice and endpoint, with a cart value of at least$100, with the ability to view traces matching these criteria individually.Monitor a canary deployment of a critical application update in real time.
Compare latency across geographic regions scoped to the latest version of your iOS application.
In addition to showing timeseries for requests that match your queries, you can also visualize your spans as a top list of the most impacted customers, availability zones, or any other tag during an outage or investigation.
Note: Exporting to dashboards and monitors is only possible using retained spans.
Filtering
A valid query in the search bar displays traces that match your search criteria across all spans. The search syntax is the same in the Live Search views as in the other trace views, but here, your query is matched against all of the ingested traces across any span and any tag, and not just the indexed ones.
You can choose to query the service entry spans, the root spans, or all spans by changing the selection to the box above the trace table. Use this feature on high traffic applications to reduce the number of spans displayed and view only the entry point spans of the services or the entry point of the trace. Selecting this box only filters the spans shown in the list; the others are still shown in the flame graph when clicking on a span to view the trace details.
You can also filter on attributes that are not defined as facets. For example, to filter on the cart.value attribute, there are two options:
Click on the
cart.valueattribute in the trace details panel and add it to the search query:Filter on all spans with a
cart.valueattribute by typing “cart.value” in the search query bar:
Indexed spans search with 15 day retention
You can search retained traces in the same way as you do a Live Search. To switch from searching live data to searching retained data, change the time selector to any period of time greater than 15 minutes. All spans that are indexed by retention filters are accessible from search. These spans are kept by Datadog for 15 days after being indexed by a retention filter.
All spans indexed by custom retention filters and the intelligent retention filter are available to be searched in the List view. However, if you filter by a tag that appears only on spans that are not indexed by any retention filter, your search does not return any results, unlike when using Live Search.
All spans indexed by custom retention filters or the intelligent retention filter are available to be searched when using trace analytics.
From the timeseries view, export your query to a dashboard, monitor, or notebook to investigate further or to alert automatically when an aggregate number of spans crosses a specific threshold.
Note: Spans indexed by the intelligent retention filter are excluded from APM queries that appear in dashboards, notebooks, and from trace analytics monitor evaluations. For more information, see Trace Retention.
Retention configuration
You can customize which spans are retained and at what retention rates. By default, the Datadog intelligent retention filter is applied, which automatically retains traces with error and latency diversity as well as low-throughput resources. To learn more about the default intelligent retention filter and how to create your own additional filters, see the retention filters documentation. Go to the Retention Filters page within the Datadog app to create or modify your own filters.
Further Reading
Additional helpful documentation, links, and articles:


