- Essentials
- Getting Started
- Datadog
- Datadog Site
- DevSecOps
- Serverless for AWS Lambda
- Agent
- Integrations
- Containers
- Dashboards
- Monitors
- Logs
- Tracing
- Profiler
- Tags
- API
- Service Catalog
- Session Replay
- Continuous Testing
- Synthetic Monitoring
- Incident Management
- Database Monitoring
- Cloud Security Management
- Cloud SIEM
- Application Security Management
- Workflow Automation
- CI Visibility
- Test Visibility
- Intelligent Test Runner
- Learning Center
- Support
- Glossary
- Standard Attributes
- Guides
- Agent
- Integrations
- OpenTelemetry
- Developers
- Authorization
- DogStatsD
- Custom Checks
- Integrations
- Create an Agent-based Integration
- Create an API Integration
- Create a Log Pipeline
- Integration Assets Reference
- Build a Marketplace Offering
- Create a Tile
- Create an Integration Dashboard
- Create a Recommended Monitor
- Create a Cloud SIEM Detection Rule
- OAuth for Integrations
- Install Agent Integration Developer Tool
- Service Checks
- IDE Plugins
- Community
- Guides
- API
- CoScreen
- Cloudcraft
- In The App
- Dashboards
- Notebooks
- Monitors and Alerting
- Infrastructure
- Metrics
- Watchdog
- Bits AI
- Service Catalog
- API Catalog
- Error Tracking
- Service Management
- Infrastructure
- Application Performance
- APM
- Continuous Profiler
- Database Monitoring
- Data Streams Monitoring
- Data Jobs Monitoring
- Digital Experience
- Real User Monitoring
- Synthetic Testing and Monitoring
- Continuous Testing
- Software Delivery
- CI Visibility
- CD Visibility
- Test Visibility
- Intelligent Test Runner
- Code Analysis
- Quality Gates
- DORA Metrics
- Security
- Security Overview
- Cloud SIEM
- Cloud Security Management
- Application Security Management
- AI Observability
- Log Management
- Observability Pipelines
- Log Management
- Administration
Core LLM Observability Concepts
LLM Observability is not available in the US1-FED site.
LLM Observability is in public beta.
Spans
A span is a unit of work representing an operation in your LLM application, and is the building block of a trace.
Span attributes
A span consists of the following attributes:
- Name
- Start time and duration
- Error type, message, and traceback
- Inputs and outputs, such as LLM prompts and completions
- Metadata (for example, LLM parameters such as
temperature,max_tokens) - Metrics, such as
prompt_tokensandcompletion_tokens - Tags
Span kinds
LLM Observability categorizes spans by their span kind, which defines the type of work the span is performing. This can give you more granular insights on what operations are being performed by your LLM application. LLM Observability supports the following span kinds:
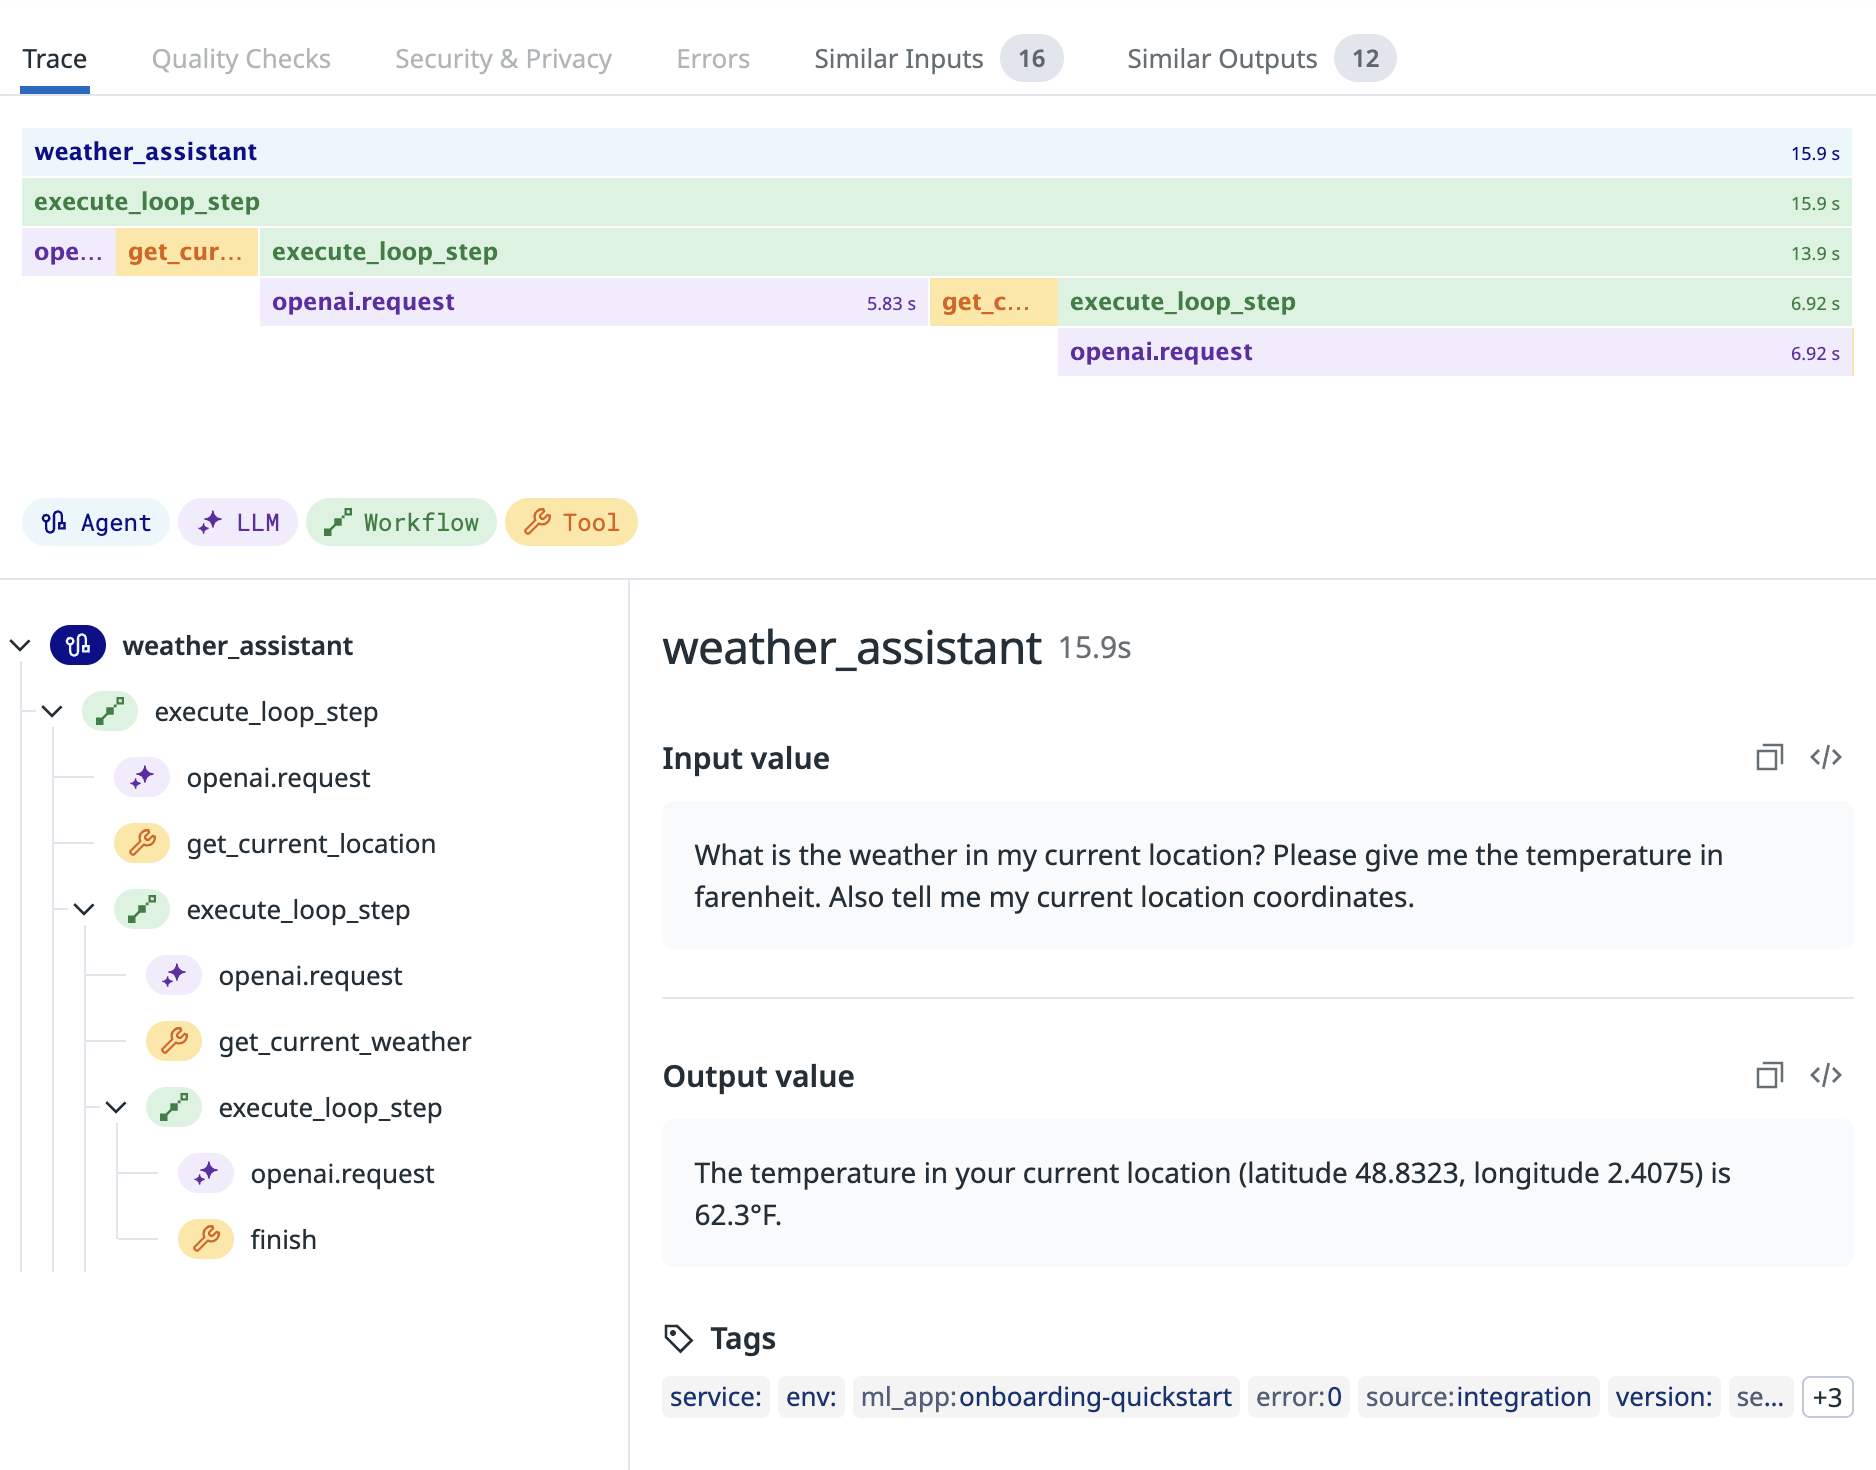
- LLM: A call to an LLM.
- Workflow: A sequence of operations which include LLM calls and any supporting operations.
- Agent: A series of decisions and operations made by an autonomous agent.
- Tool: A call to external programs or services, such as a web API or a database.
- Task: Any standalone step in a workflow or agent that does not involve a call to an external service.
- Embedding: A call to an embedding model or function.
- Retrieval: A data retrieval operation from an external knowledge base.
To learn more about each span kind, see Span Kinds.
Traces
A trace represents the work involved in processing a request in your LLM application, and consists of one or more nested spans. A root span is the first span in a trace, and marks the beginning and end of the trace.
Datadog’s LLM Observability product is designed to support observability for LLM applications with varying complexity. Based on the structure and complexity of your traces, you can unlock the following features of LLM Observability:
1. LLM Inference Monitoring
LLM inference traces are composed of a single LLM span.
Tracing individual LLM inferences unlocks basic LLM Observability features, allowing you to:
- Track inputs and outputs to your LLM calls
- Track token usage, error rates, and latencies for your LLM calls
- Break down important metrics by model and model provider
The SDK provides integrations to automatically capture LLM calls to specific providers. See Auto-instrumentation for more information. If you are using an LLM provider that is not supported, you must manually instrument your application.
2. LLM Workflow Monitoring
A workflow trace is composed of a root workflow span with nested LLM, task, tool, embedding, and retrieval spans.
Most LLM applications include operations that surround LLM calls and play a large role in your overall application performance - for example, tool calls to external APIs or preprocessing task steps.
By tracing LLM calls and contextual task or tool operations together under workflow spans, you can unlock more granular insights and a more holistic view of your LLM application.
3. LLM Agent Monitoring
An agent monitoring trace is composed of a root agent span with nested LLM, task, tool, embedding, retrieval, and workflow spans.
If your LLM application has complex autonomous logic, such as decision-making that can’t be captured by a static workflow, you are likely using an LLM Agent. Agents may execute multiple different workflows depending on the user input.
You can instrument your LLM application to trace and group together all workflows and contextual operations run by a single LLM agent as an agent trace.
Evaluations
Evaluations are a method for measuring the performance of your LLM application. For example, quality checks like failure to answer or topic relevancy are different types of evaluations that you can track for your LLM application.
Datadog’s LLM Observability associates evaluations with individual spans so that you can view the inputs and outputs that led to a specific evaluation. Datadog provides a few out-of-the-box evaluations for your traces, but you can also submit your own evaluations to LLM Observability (see the Evaluations guide for more information).


