- Essentials
- Getting Started
- Agent
- API
- APM Tracing
- Containers
- Dashboards
- Database Monitoring
- Datadog
- Datadog Site
- DevSecOps
- Incident Management
- Integrations
- Internal Developer Portal
- Logs
- Monitors
- Notebooks
- OpenTelemetry
- Profiler
- Search
- Session Replay
- Security
- Serverless for AWS Lambda
- Software Delivery
- Synthetic Monitoring and Testing
- Tags
- Workflow Automation
- Learning Center
- Support
- Glossary
- Standard Attributes
- Guides
- Agent
- Integrations
- Developers
- Authorization
- DogStatsD
- Custom Checks
- Integrations
- Build an Integration with Datadog
- Create an Agent-based Integration
- Create an API-based Integration
- Create a Log Pipeline
- Integration Assets Reference
- Build a Marketplace Offering
- Create an Integration Dashboard
- Create a Monitor Template
- Create a Cloud SIEM Detection Rule
- Install Agent Integration Developer Tool
- Service Checks
- IDE Plugins
- Community
- Guides
- OpenTelemetry
- Administrator's Guide
- API
- Partners
- Datadog Mobile App
- DDSQL Reference
- CoScreen
- CoTerm
- Remote Configuration
- Cloudcraft (Standalone)
- In The App
- Dashboards
- Notebooks
- DDSQL Editor
- Reference Tables
- Sheets
- Monitors and Alerting
- Service Level Objectives
- Metrics
- Watchdog
- Bits AI
- Internal Developer Portal
- Error Tracking
- Change Tracking
- Event Management
- Incident Response
- Actions & Remediations
- Infrastructure
- Cloudcraft
- Resource Catalog
- Universal Service Monitoring
- End User Device Monitoring
- Hosts
- Containers
- Processes
- Serverless
- Network Monitoring
- Storage Management
- Cloud Cost
- Application Performance
- APM
- Continuous Profiler
- Database Monitoring
- Agent Integration Overhead
- Setup Architectures
- Setting Up Postgres
- Setting Up MySQL
- Setting Up SQL Server
- Setting Up Oracle
- Setting Up Amazon DocumentDB
- Setting Up MongoDB
- Connecting DBM and Traces
- Data Collected
- Exploring Database Hosts
- Exploring Query Metrics
- Exploring Query Samples
- Exploring Database Schemas
- Exploring Recommendations
- Troubleshooting
- Guides
- Data Streams Monitoring
- Data Observability
- Digital Experience
- Real User Monitoring
- Synthetic Testing and Monitoring
- Continuous Testing
- Product Analytics
- Session Replay
- Software Delivery
- CI Visibility
- CD Visibility
- Deployment Gates
- Test Optimization
- Code Coverage
- PR Gates
- DORA Metrics
- Feature Flags
- Security
- Security Overview
- Cloud SIEM
- Code Security
- Cloud Security
- App and API Protection
- AI Guard
- Workload Protection
- Sensitive Data Scanner
- AI Observability
- Log Management
- Observability Pipelines
- Configuration
- Sources
- Processors
- Destinations
- Packs
- Akamai CDN
- Amazon CloudFront
- Amazon VPC Flow Logs
- AWS Application Load Balancer Logs
- AWS CloudTrail
- AWS Elastic Load Balancer Logs
- AWS Network Load Balancer Logs
- Cisco ASA
- Cloudflare
- F5
- Fastly
- Fortinet Firewall
- HAProxy Ingress
- Istio Proxy
- Juniper SRX Firewall Traffic Logs
- Netskope
- NGINX
- Okta
- Palo Alto Firewall
- Windows XML
- ZScaler ZIA DNS
- Zscaler ZIA Firewall
- Zscaler ZIA Tunnel
- Zscaler ZIA Web Logs
- Search Syntax
- Scaling and Performance
- Monitoring and Troubleshooting
- Guides and Resources
- Log Management
- CloudPrem
- Administration
APM Investigator
Request access to the Preview!
APM Investigator is in Preview. To request access, fill out this form.
Request AccessOverview
The APM Investigator helps you diagnose and resolve application latency issues through a guided, step-by-step workflow. It consolidates analysis tools into a single interface so you can identify root causes and take action.
Key capabilities
The APM Investigator helps you:
- Investigate slow request clusters: Select problematic requests directly from the latency scatter plot.
- Identify the source of latency: Determine whether latency originates from your service, a downstream dependency, databases, or third-party APIs.
- Narrow the scope: Isolate issues to specific data centers, clusters, or user segments with Tag Analysis.
- Find root causes: Detect faulty deployments, database slowness, third-party service failures, infrastructure problems, and service-level issues.
Starting an investigation
Launch an investigation from an APM service page or a resource page.
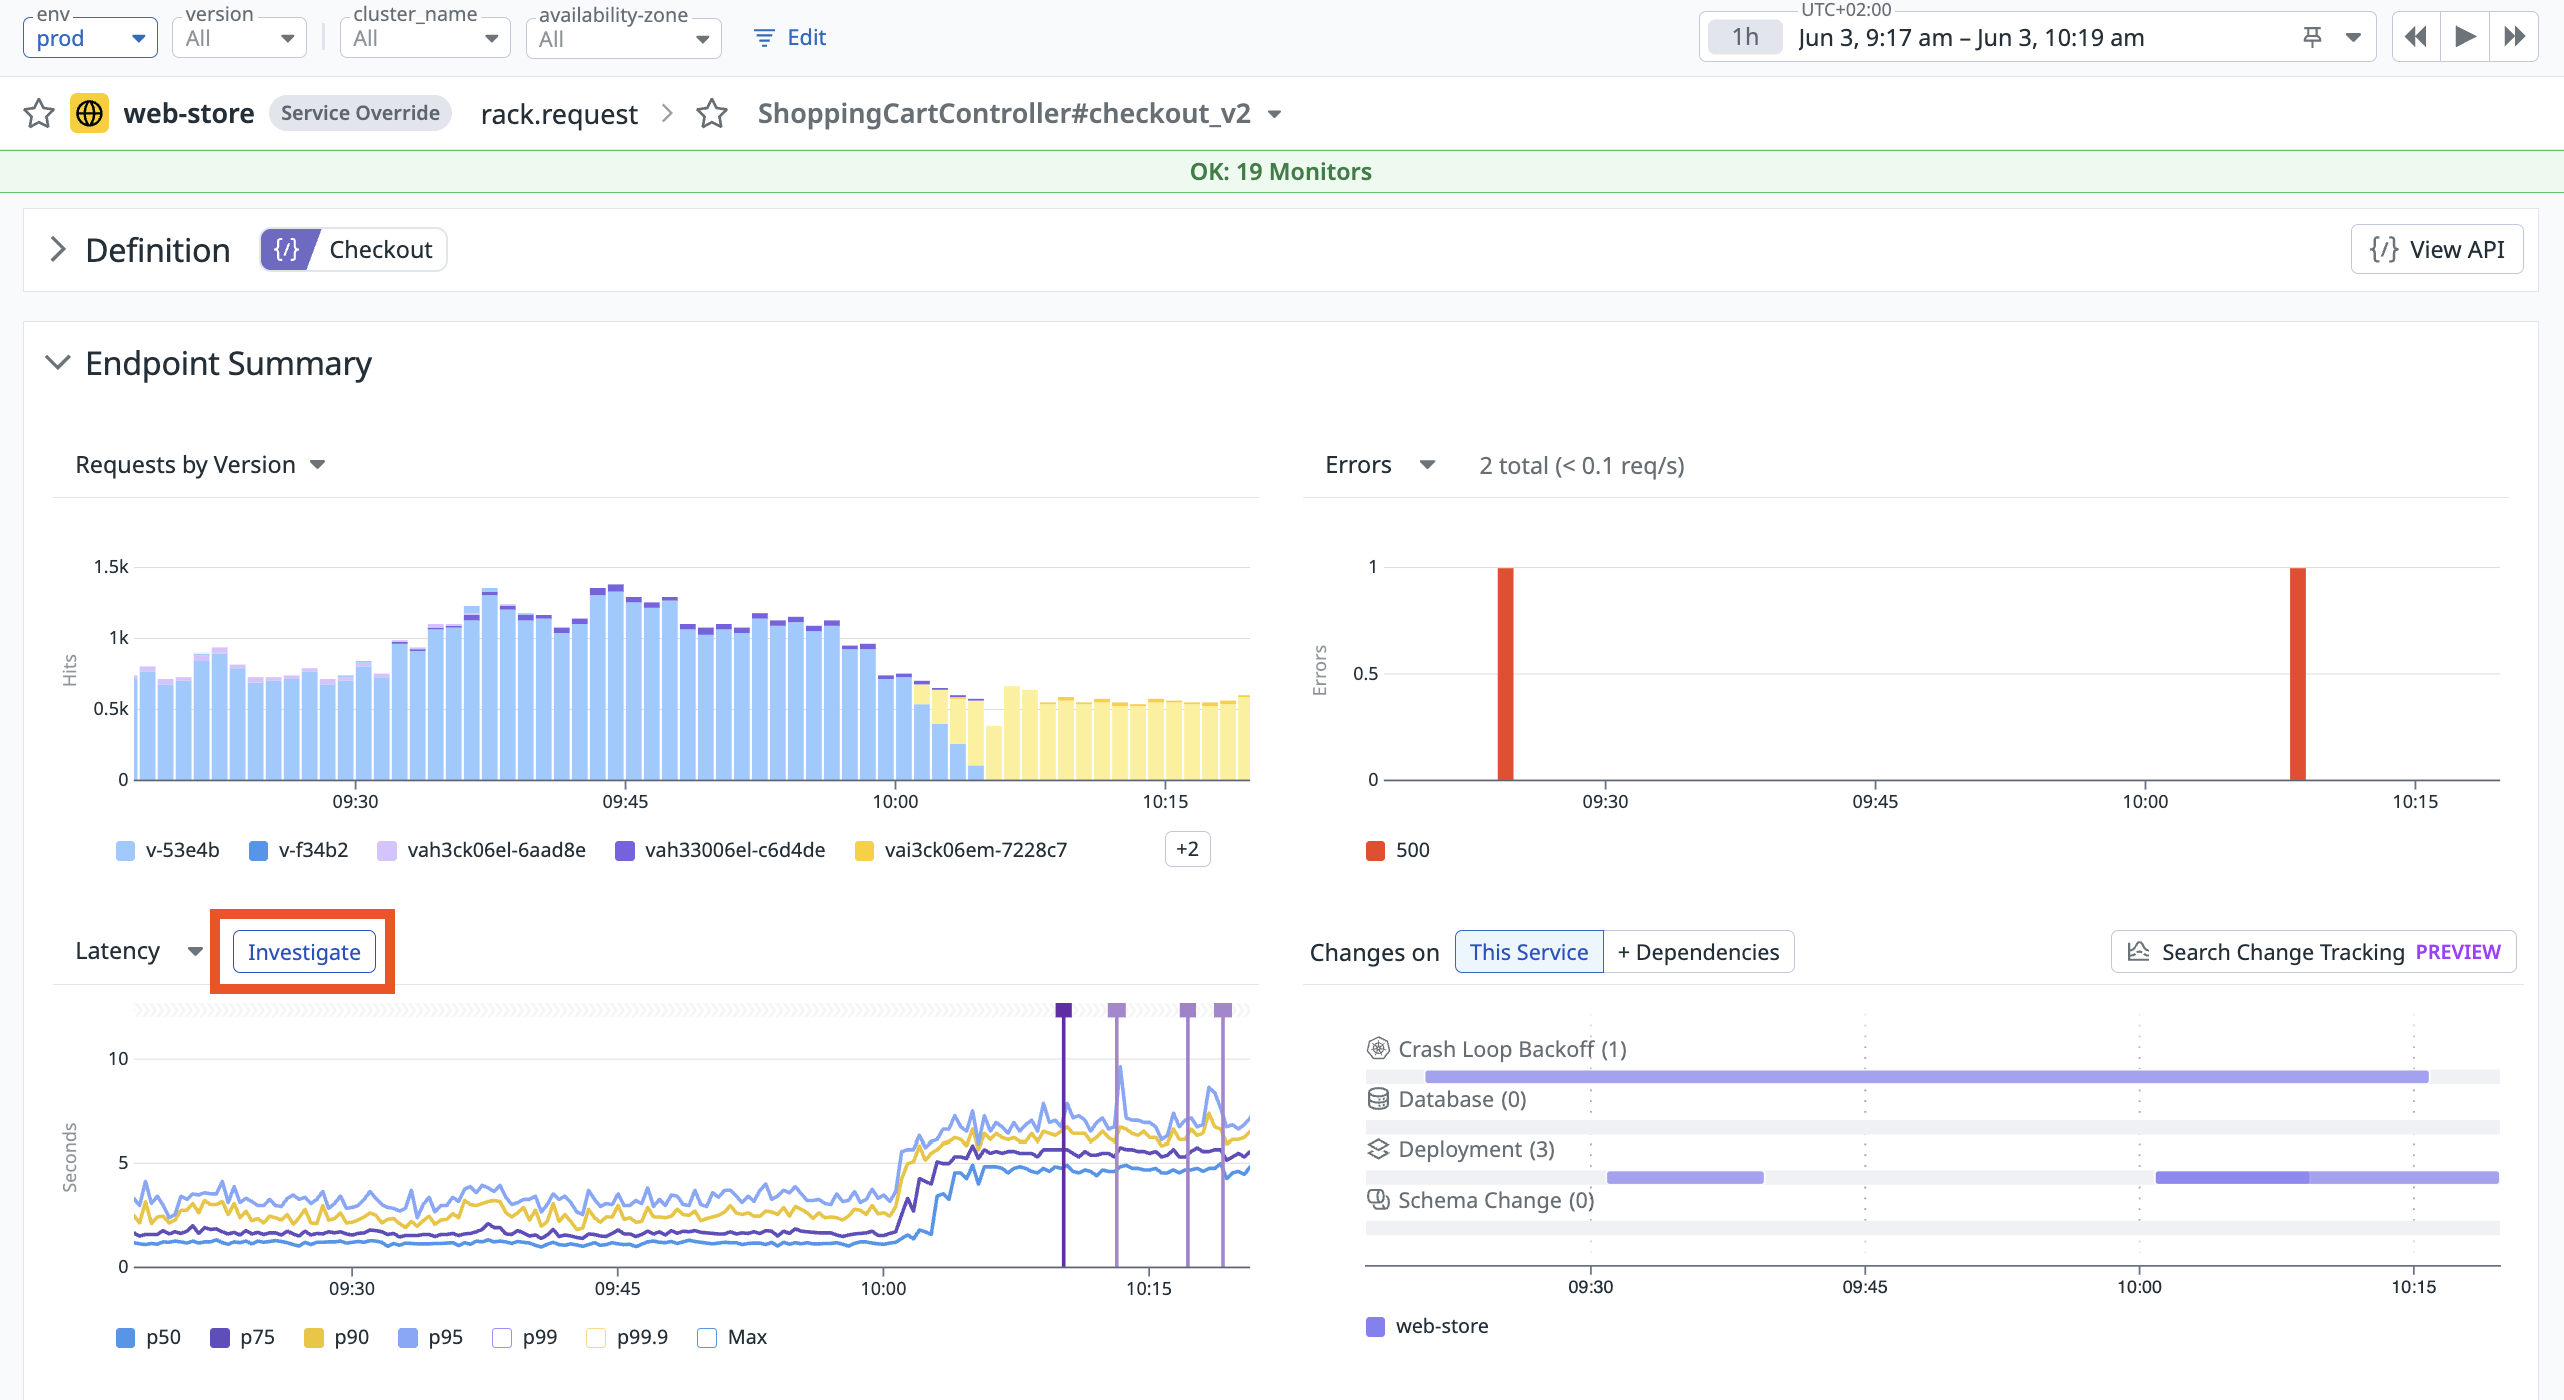
- Navigate to a service showing latency issues.
- Find the Latency graph showing the anomaly.
- Hover over the graph and click Investigate. This opens the investigation side panel.
Investigation workflow
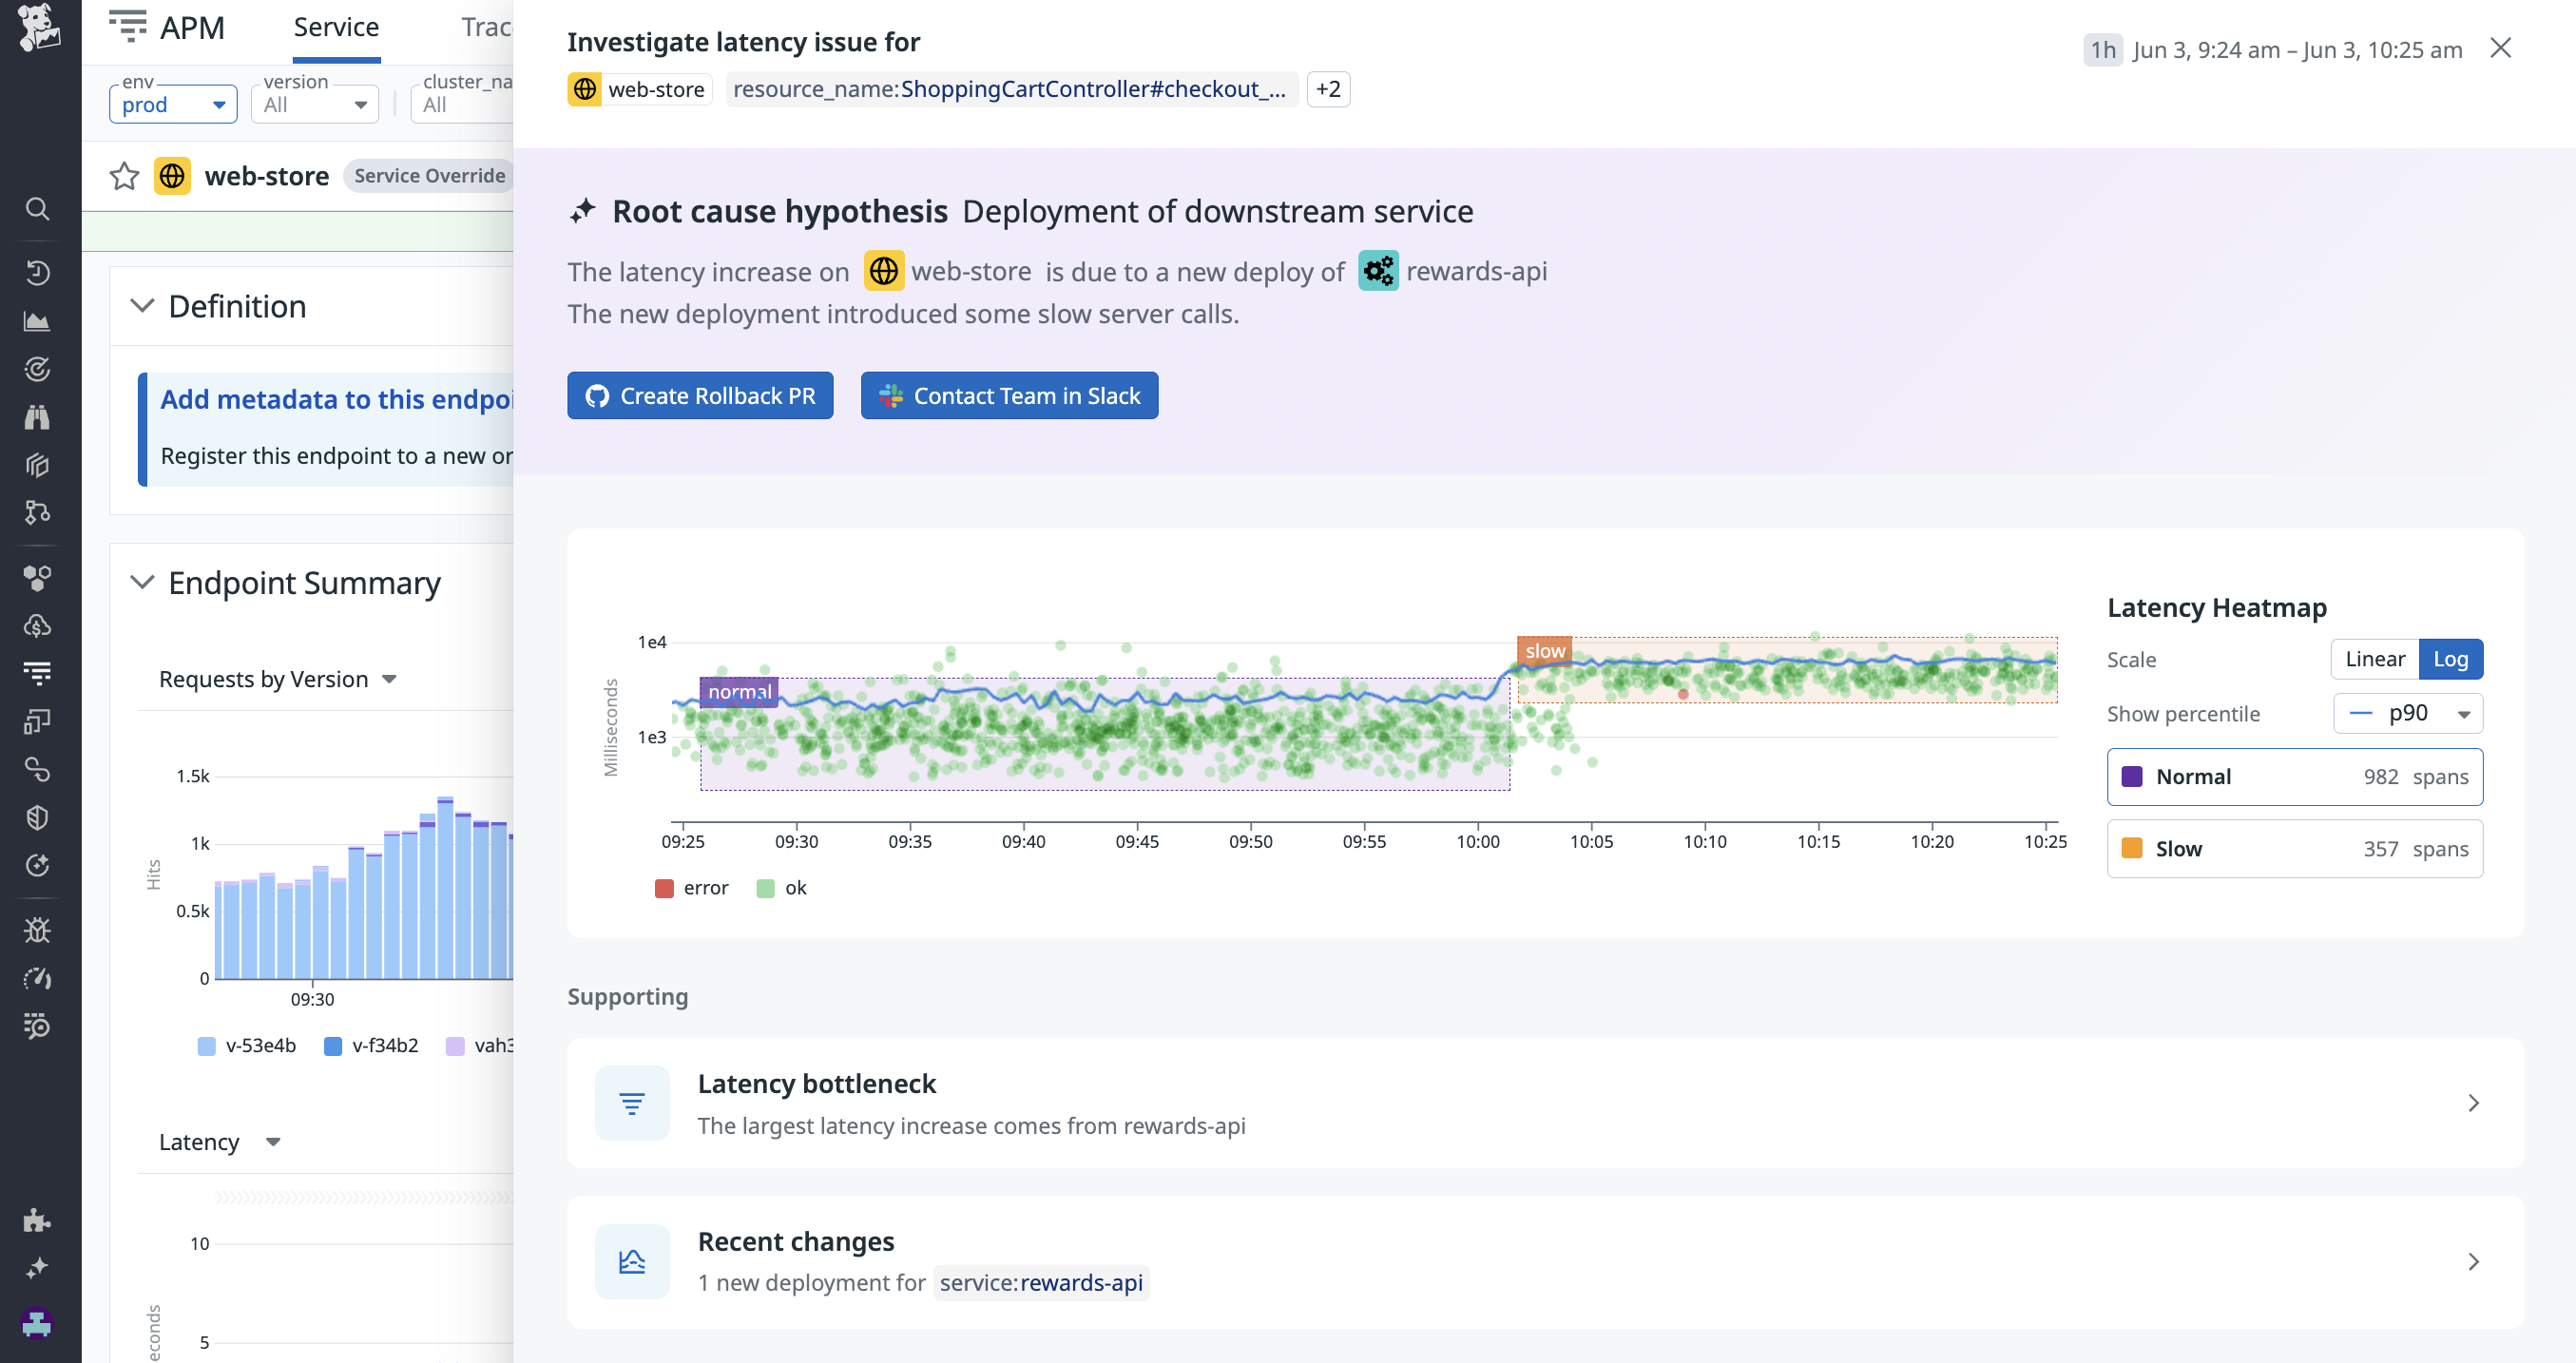
Define context: Select slow and normal spans
To trigger the latency analysis, select two zones on the point plot:
- Slow: Problematic, slow spans
- Normal: Baseline, healthy spans
Latency anomalies detected by Watchdog are pre-selected.
This comparison between the slow and normal spans drives all subsequent analysis.
Step 1: Identify the latency bottleneck
The investigator identifies whether latency originates from your service or its downstream dependencies (services, databases, third-party APIs).
Analysis approach: The investigator compares trace data from both your selected slow and normal periods. To find the service responsible for the latency increase, it compares:
Execution Time: Compares each service’s “self-time”, defined as the time spent on its own processing, excluding waits for downstream dependencies, across the two datasets. The service with the largest absolute latency increase is the primary focus.
- Call Patterns Between Services: Analyzes changes in the number of requests between services. For example, if service Y significantly increases its calls to downstream service X, the investigator might identify Y as the bottleneck.
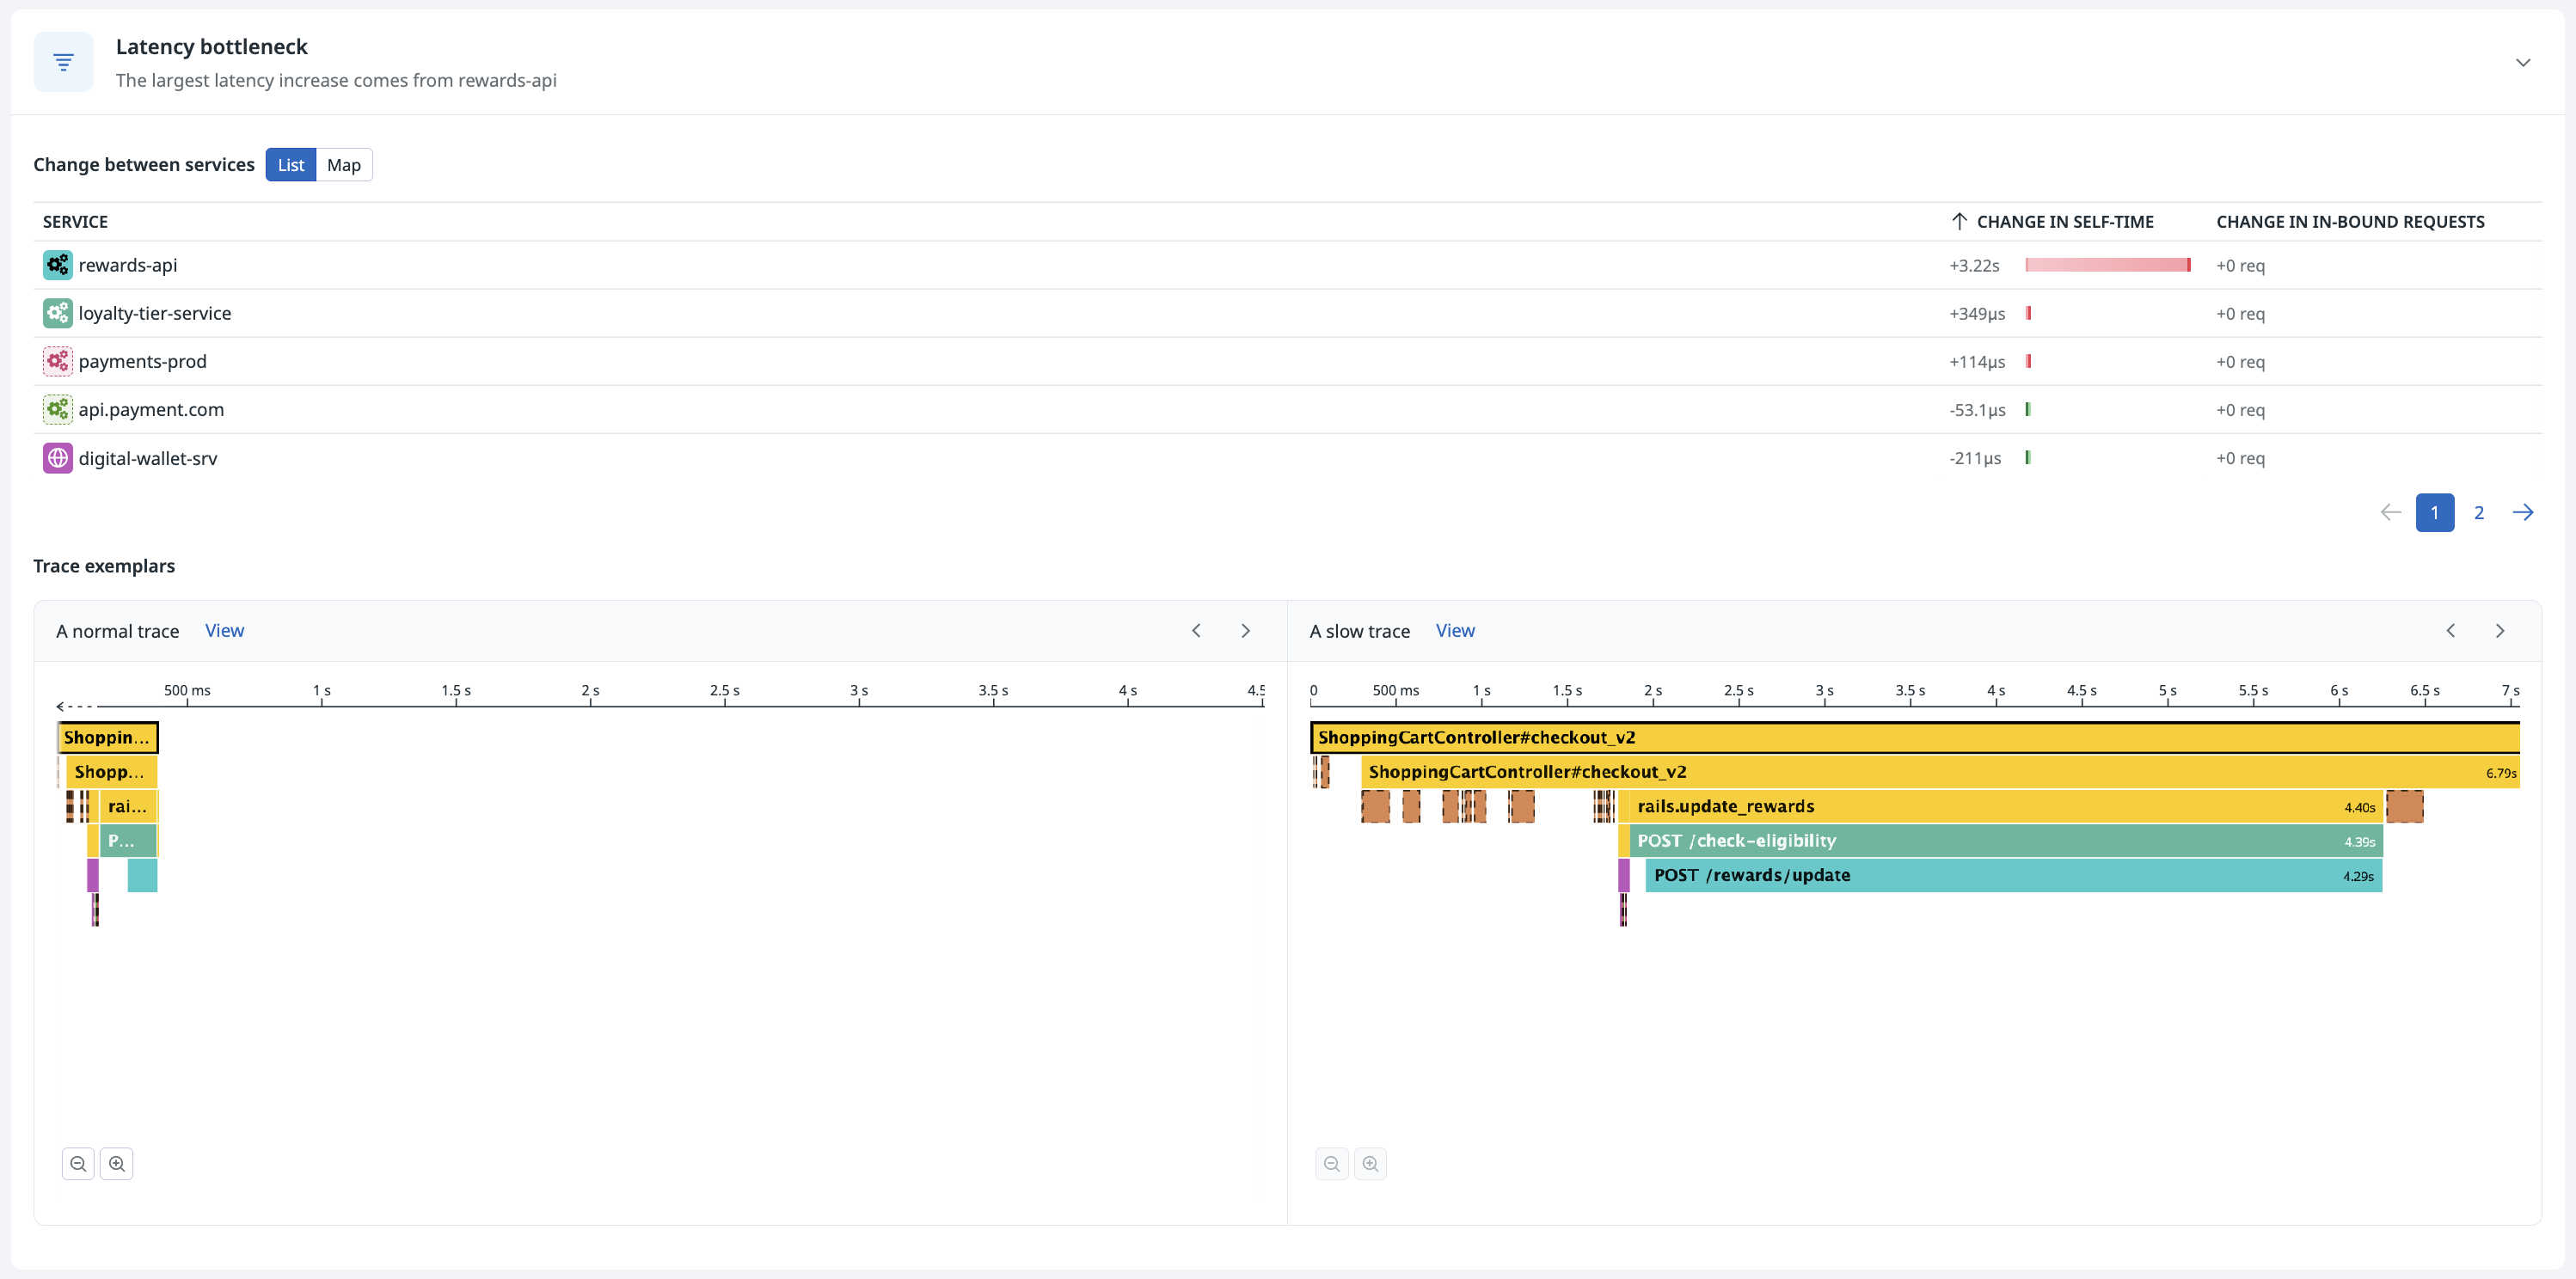
Based on this comprehensive analysis, the investigator recommends a service as the likely latency bottleneck. Expand the latency bottleneck section to see details about the comparison between slow and normal traces. A table surfaces the changes in self-time and in the number of inbound requests by service.
The following example shows two side-by-side flame graphs that compare slow traces against healthy traces in more detail. Use the arrows to cycle through example traces and click View to open the trace in a full pageview.
To investigate recent changes to a service, click the + icon that appears when you hover over a row to add it as context for your investigation.
Step 2: Correlate to recent changes
The investigator then helps you determine if recent deployments on the service or the latency bottleneck service caused the latency increase.
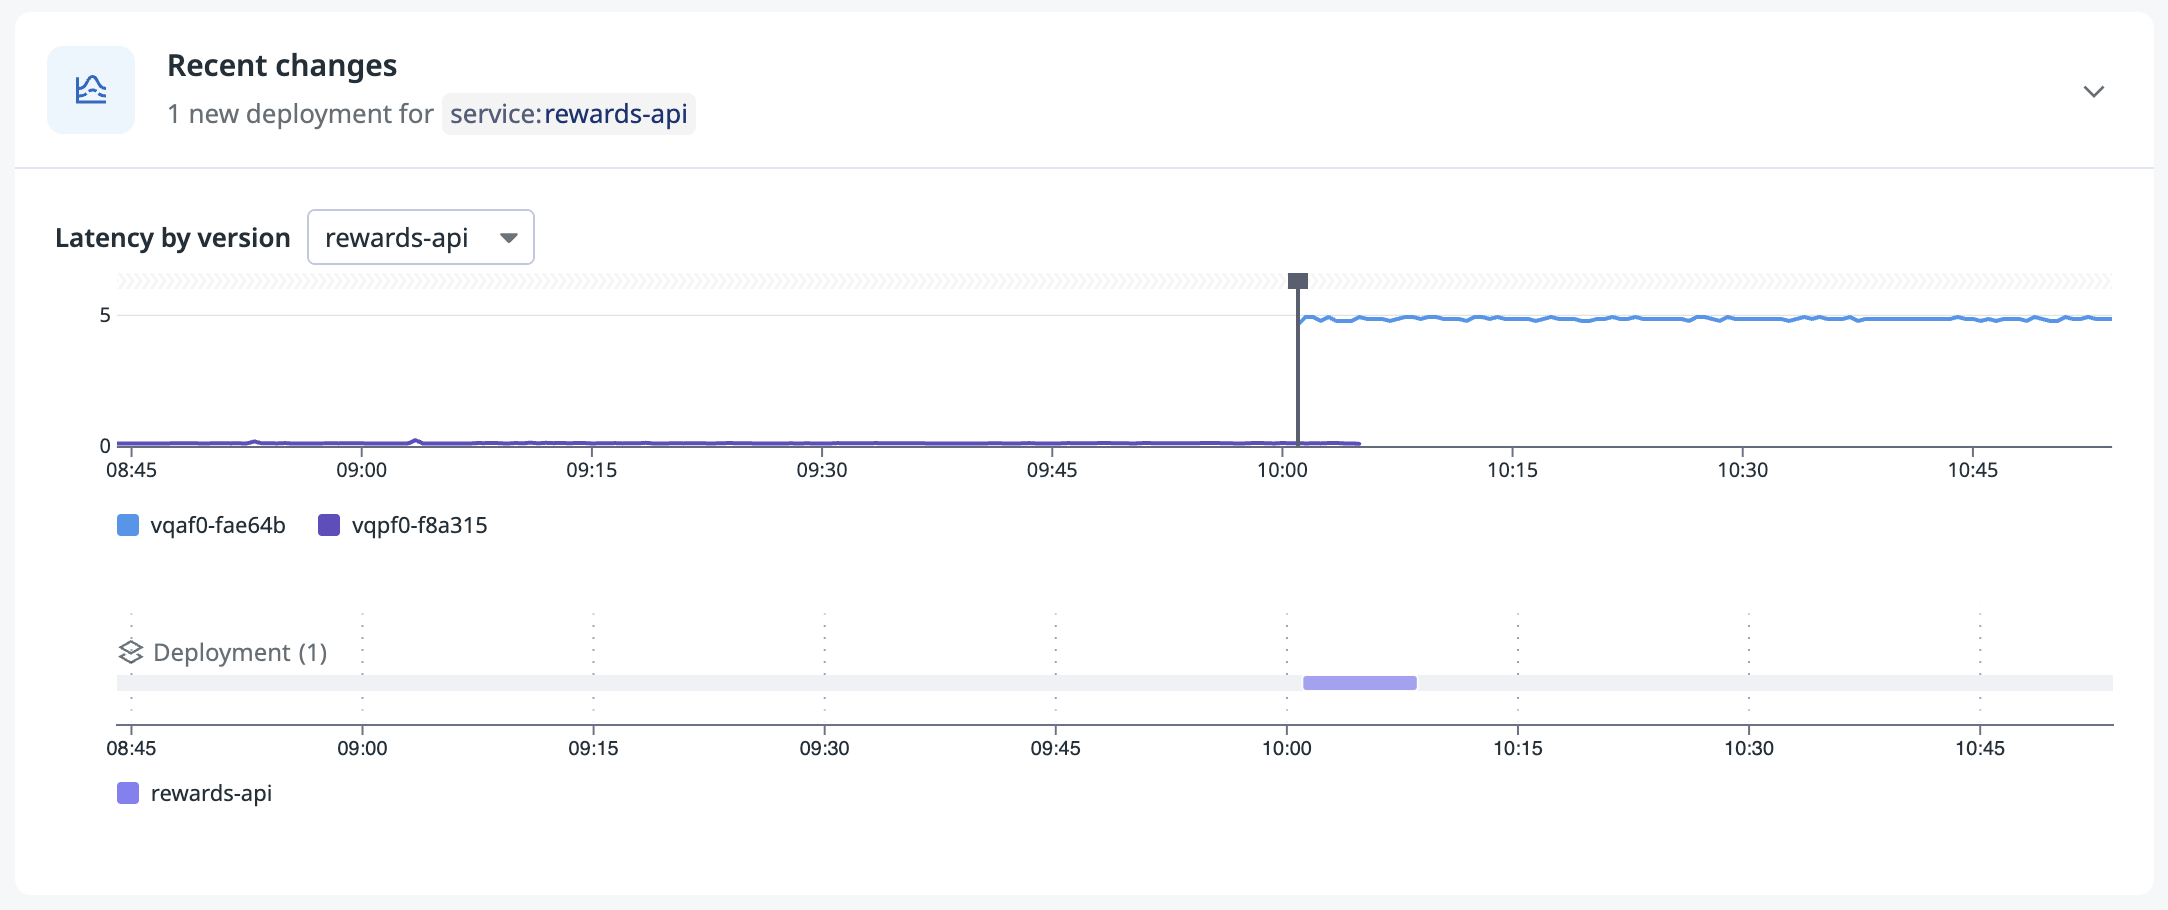
The Recent changes section surfaces:
- Deployments that occurred near the latency spike timeline on a change tracking widget
- A latency graph broken down by version
Analysis approach: The APM Investigator analyzes this data in the background to flag if this section is relevant to examine (if a deployment occurred around the time of the latency increase you are investigating).
Step 3: Find common patterns with Tag Analysis
The investigator also uses Tag Analysis to help you discover shared attributes that distinguish slow traces from healthy traces. Tag Analysis highlights dimensions with significant distribution differences between slow and normal datasets.
The section surfaces:
- Tag distributions comparing the slow and normal datasets across all span dimensions.
- Highlights of the most discriminating dimensions that might help you understand the latency issue, such as
org_id,kubernetes_cluster, ordatacenter.name.
The APM Investigator only surfaces this section when dimensions show significant differentiation that is worth examining.
End user impact
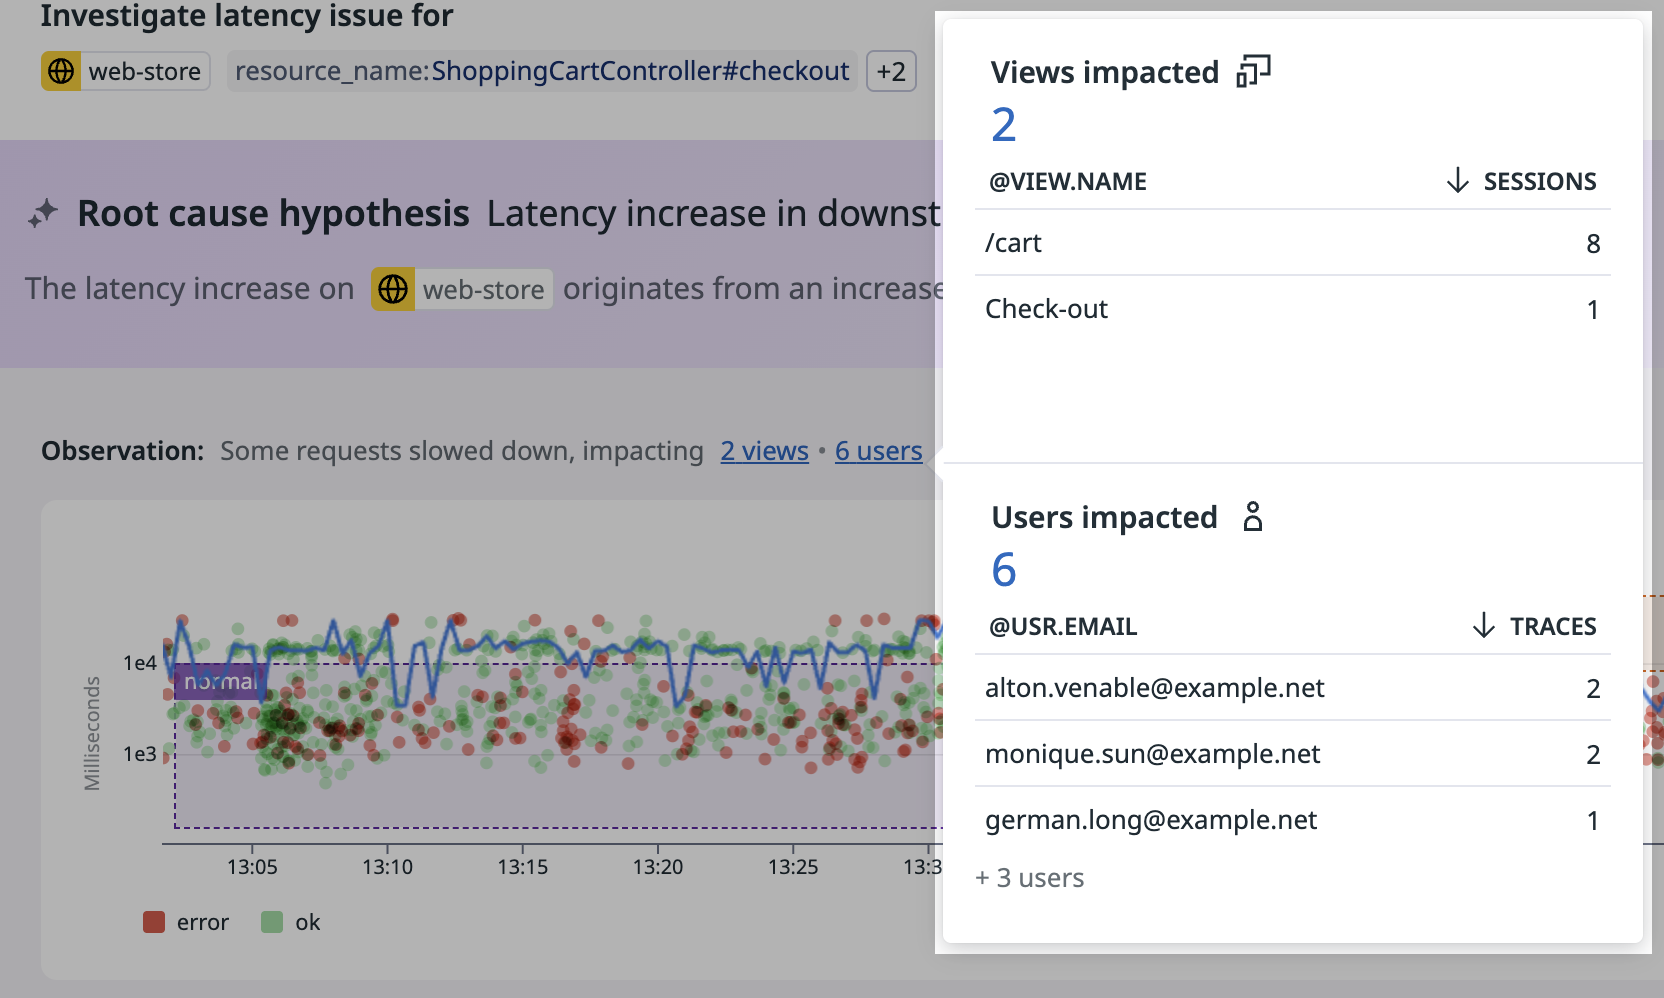
Above the point plot, you can find a preview of how many end-users, account and application pages (for example, /checkout) are affected by the problem. This information is collected if you enabled the connection between RUM and traces.
Root cause
The investigator consolidates findings from all analysis steps (latency bottleneck, recent changes, and tag analysis) to generate a root cause hypothesis. For example, “a deployment of this downstream service introduced the latency increase”.
The APM Investigator helps reduce Mean Time to Resolution (MTTR) by accelerating issue diagnosis and response through automated trace and change data analysis.
Further reading
Additional helpful documentation, links, and articles:
