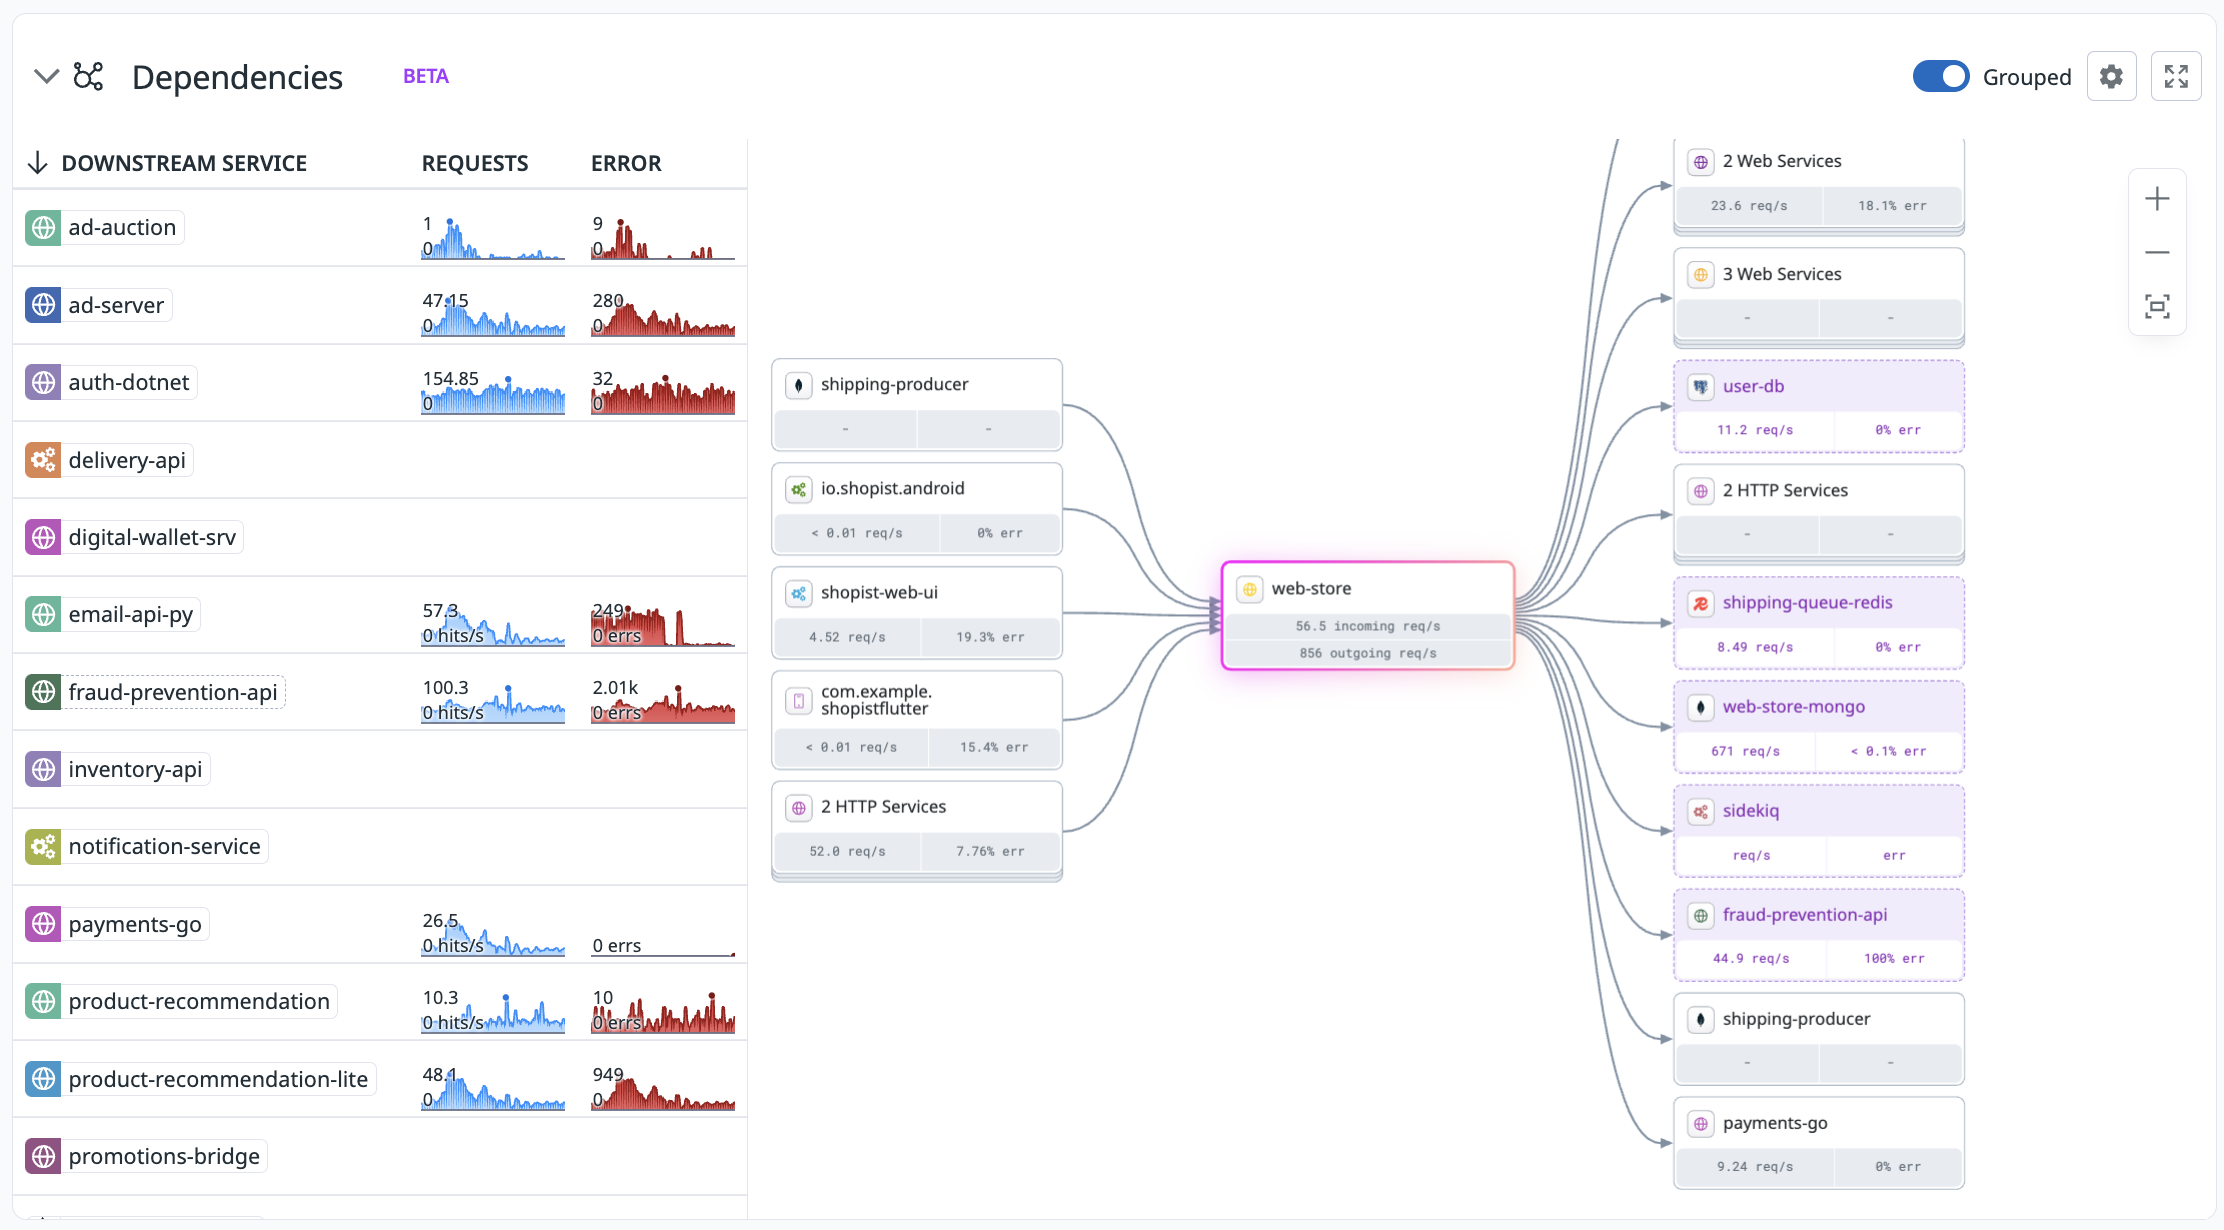
Datadog automatically discovers the dependencies for an instrumented service, such as databases, queues, or third-party APIs, even if that dependency hasn’t been directly instrumented. By analyzing outbound requests from your instrumented services, Datadog infers the presence of these dependencies and collects associated performance metrics.
Explore inferred services in the Software Catalog by filtering entries by entity type, such as database, queue, or third-party API. Each service page is tailored to the type of service you are investigating. For instance, database service pages show database-specific insights and include database monitoring data if you are using Database Monitoring.
Set up inferred services
Starting from Datadog Agent version 7.60.0, no manual configuration is needed to see inferred services. The required configurations—apm_config.compute_stats_by_span_kind and apm_config.peer_tags_aggregation—are enabled by default.
For Datadog Agent versions 7.55.1 through 7.59.1, add the following to your datadog.yaml configuration file:
If you are using Helm, include these environment variables in your values.yamlfile.
For the OpenTelemetry Collector, the minimum recommended version is opentelemetry-collector-contribv0.95.0 or later. In that case, update this configuration:
To determine the names and types of the inferred service dependencies, Datadog uses standard span attributes and maps them to peer.* attributes. For example, inferred external APIs use the default naming scheme net.peer.name like api.stripe.com, api.twilio.com, and us6.api.mailchimp.com. Inferred databases use the default naming scheme db.instance. You can rename inferred entities by creating renaming rules.
Note: Peer attribute values that match IP address formats (for example, 127.0.0.1) are modified and redacted with blocked-ip-address to prevent unnecessary noise and tagging metrics with high-cardinality dimensions. As a result, you may encounter some blocked-ip-address services appearing as downstream dependencies of your instrumented services.
Precedence of peer tags
To assign the name to inferred entities, Datadog uses a specific order of precedence between peer tags, when entities are defined by a combination of multiple tags.
If the highest priority tag, such as peer.db.name, is not captured as part of the instrumentation, Datadog uses the second highest priority tag, like peer.hostname, and continue in that order.
Note: Datadog never sets the peer.service for inferred databases and queues. peer.service is the highest priority peer attribute. If set, it takes precedence over all other attributes.
Migrate to global default service naming
With inferred services, service dependencies are automatically detected from existing span attributes. As a result, changing service names (using the service tag) is not required to identify these dependencies.
Enable DD_TRACE_REMOVE_INTEGRATION_SERVICE_NAMES_ENABLED to ensure no Datadog integration sets service names that are different from the default global service name. This also improves how service-to-service connections and inferred services are represented in Datadog visualizations, across all supported tracing library languages and integrations.
Enabling this option may impact existing APM metrics, custom span metrics, trace analytics, retention filters, sensitive data scans, monitors, dashboards, or notebooks that reference the old service names. Update these assets to use the global default service tag (service:<DD_SERVICE>).
For instructions on how to remove service overrides and migrate to inferred services, see the Service Overrides guide.
The Inferred Services feature is not available by default in your datacenter. Fill out this form to request access.
Further Reading
Additional helpful documentation, links, and articles: