- Agents
- Essentials
- Getting Started
- Agent
- API
- APM Tracing
- Containers
- Dashboards
- Database Monitoring
- Datadog
- Datadog Site
- DevSecOps
- Incident Management
- Integrations
- Internal Developer Portal
- Logs
- Monitors
- Notebooks
- OpenTelemetry
- Profiler
- Search
- Session Replay
- Security
- Serverless for AWS Lambda
- Software Delivery
- Synthetic Monitoring and Testing
- Tags
- Workflow Automation
- Learning Center
- Support
- Glossary
- Standard Attributes
- Guides
- Agent
- Integrations
- Extend Datadog
- Authorization
- DogStatsD
- Custom Checks
- Integrations
- Build an Integration with Datadog
- Create an Agent-based Integration
- Create an API-based Integration
- Create a Log Pipeline
- Integration Assets Reference
- Build a Marketplace Offering
- Create an Integration Dashboard
- Create a Monitor Template
- Create a Cloud SIEM Detection Rule
- Install Agent Integration Developer Tool
- Service Checks
- Community
- Guides
- OpenTelemetry
- Administrator's Guide
- API
- Partners
- Datadog Mobile App
- DDSQL Reference
- CoScreen
- CoTerm
- Remote Configuration
- Cloudcraft (Standalone)
- In The App
- Dashboards
- Notebooks
- DDSQL Editor
- Reference Tables
- Sheets
- Monitors and Alerting
- Service Level Objectives
- Metrics
- Watchdog
- Bits AI
- Internal Developer Portal
- Error Tracking
- Change Tracking
- Event Management
- Incident Response
- Actions & Remediations
- Infrastructure
- Cloudcraft
- Resource Catalog
- Universal Service Monitoring
- End User Device Monitoring
- Hosts
- Containers
- Processes
- Serverless
- Network Monitoring
- Storage Management
- Cloud Cost
- Application Performance
- APM
- Continuous Profiler
- Database Monitoring
- Agent Integration Overhead
- Setup Architectures
- Setting Up Postgres
- Setting Up MySQL
- Setting Up SQL Server
- Setting Up Oracle
- Setting Up Amazon DocumentDB
- Setting Up MongoDB
- Setting Up ClickHouse
- Connecting DBM and Traces
- Data Collected
- Exploring Database Hosts
- Exploring Query Metrics
- Exploring Query Samples
- Exploring Database Schemas
- Exploring Recommendations
- Troubleshooting
- Guides
- Data Streams Monitoring
- Data Observability
- Digital Experience
- Real User Monitoring
- Synthetic Testing and Monitoring
- Continuous Testing
- Experiments
- Product Analytics
- Session Replay
- Software Delivery
- CI Visibility
- CD Visibility
- Deployment Gates
- Test Optimization
- Code Coverage
- PR Gates
- DORA Metrics
- Feature Flags
- Developer Integrations
- Security
- Security Overview
- Cloud SIEM
- Code Security
- Cloud Security
- App and API Protection
- AI Guard
- Workload Protection
- Sensitive Data Scanner
- AI Observability
- Log Management
- Observability Pipelines
- Configuration
- Sources
- Processors
- Destinations
- Packs
- Akamai CDN
- Amazon CloudFront
- Amazon VPC Flow Logs
- AWS Application Load Balancer Logs
- AWS CloudTrail
- AWS Elastic Load Balancer Logs
- AWS Network Load Balancer Logs
- Cisco ASA
- Cloudflare
- F5
- Fastly
- Fortinet Firewall
- HAProxy Ingress
- Istio Proxy
- Juniper SRX Firewall Traffic Logs
- Netskope
- NGINX
- Okta
- Palo Alto Firewall
- Windows XML
- ZScaler ZIA DNS
- Zscaler ZIA Firewall
- Zscaler ZIA Tunnel
- Zscaler ZIA Web Logs
- Search Syntax
- Scaling and Performance
- Monitoring and Troubleshooting
- Guides and Resources
- Log Management
- CloudPrem
- Administration
- Account Management
- Data Security
- Help
Error Tracking for Backend Services
Overview
It is critical for your system’s health to consistently monitor the errors collected by Datadog. When there are many individual error events, it becomes hard to prioritize errors for troubleshooting.
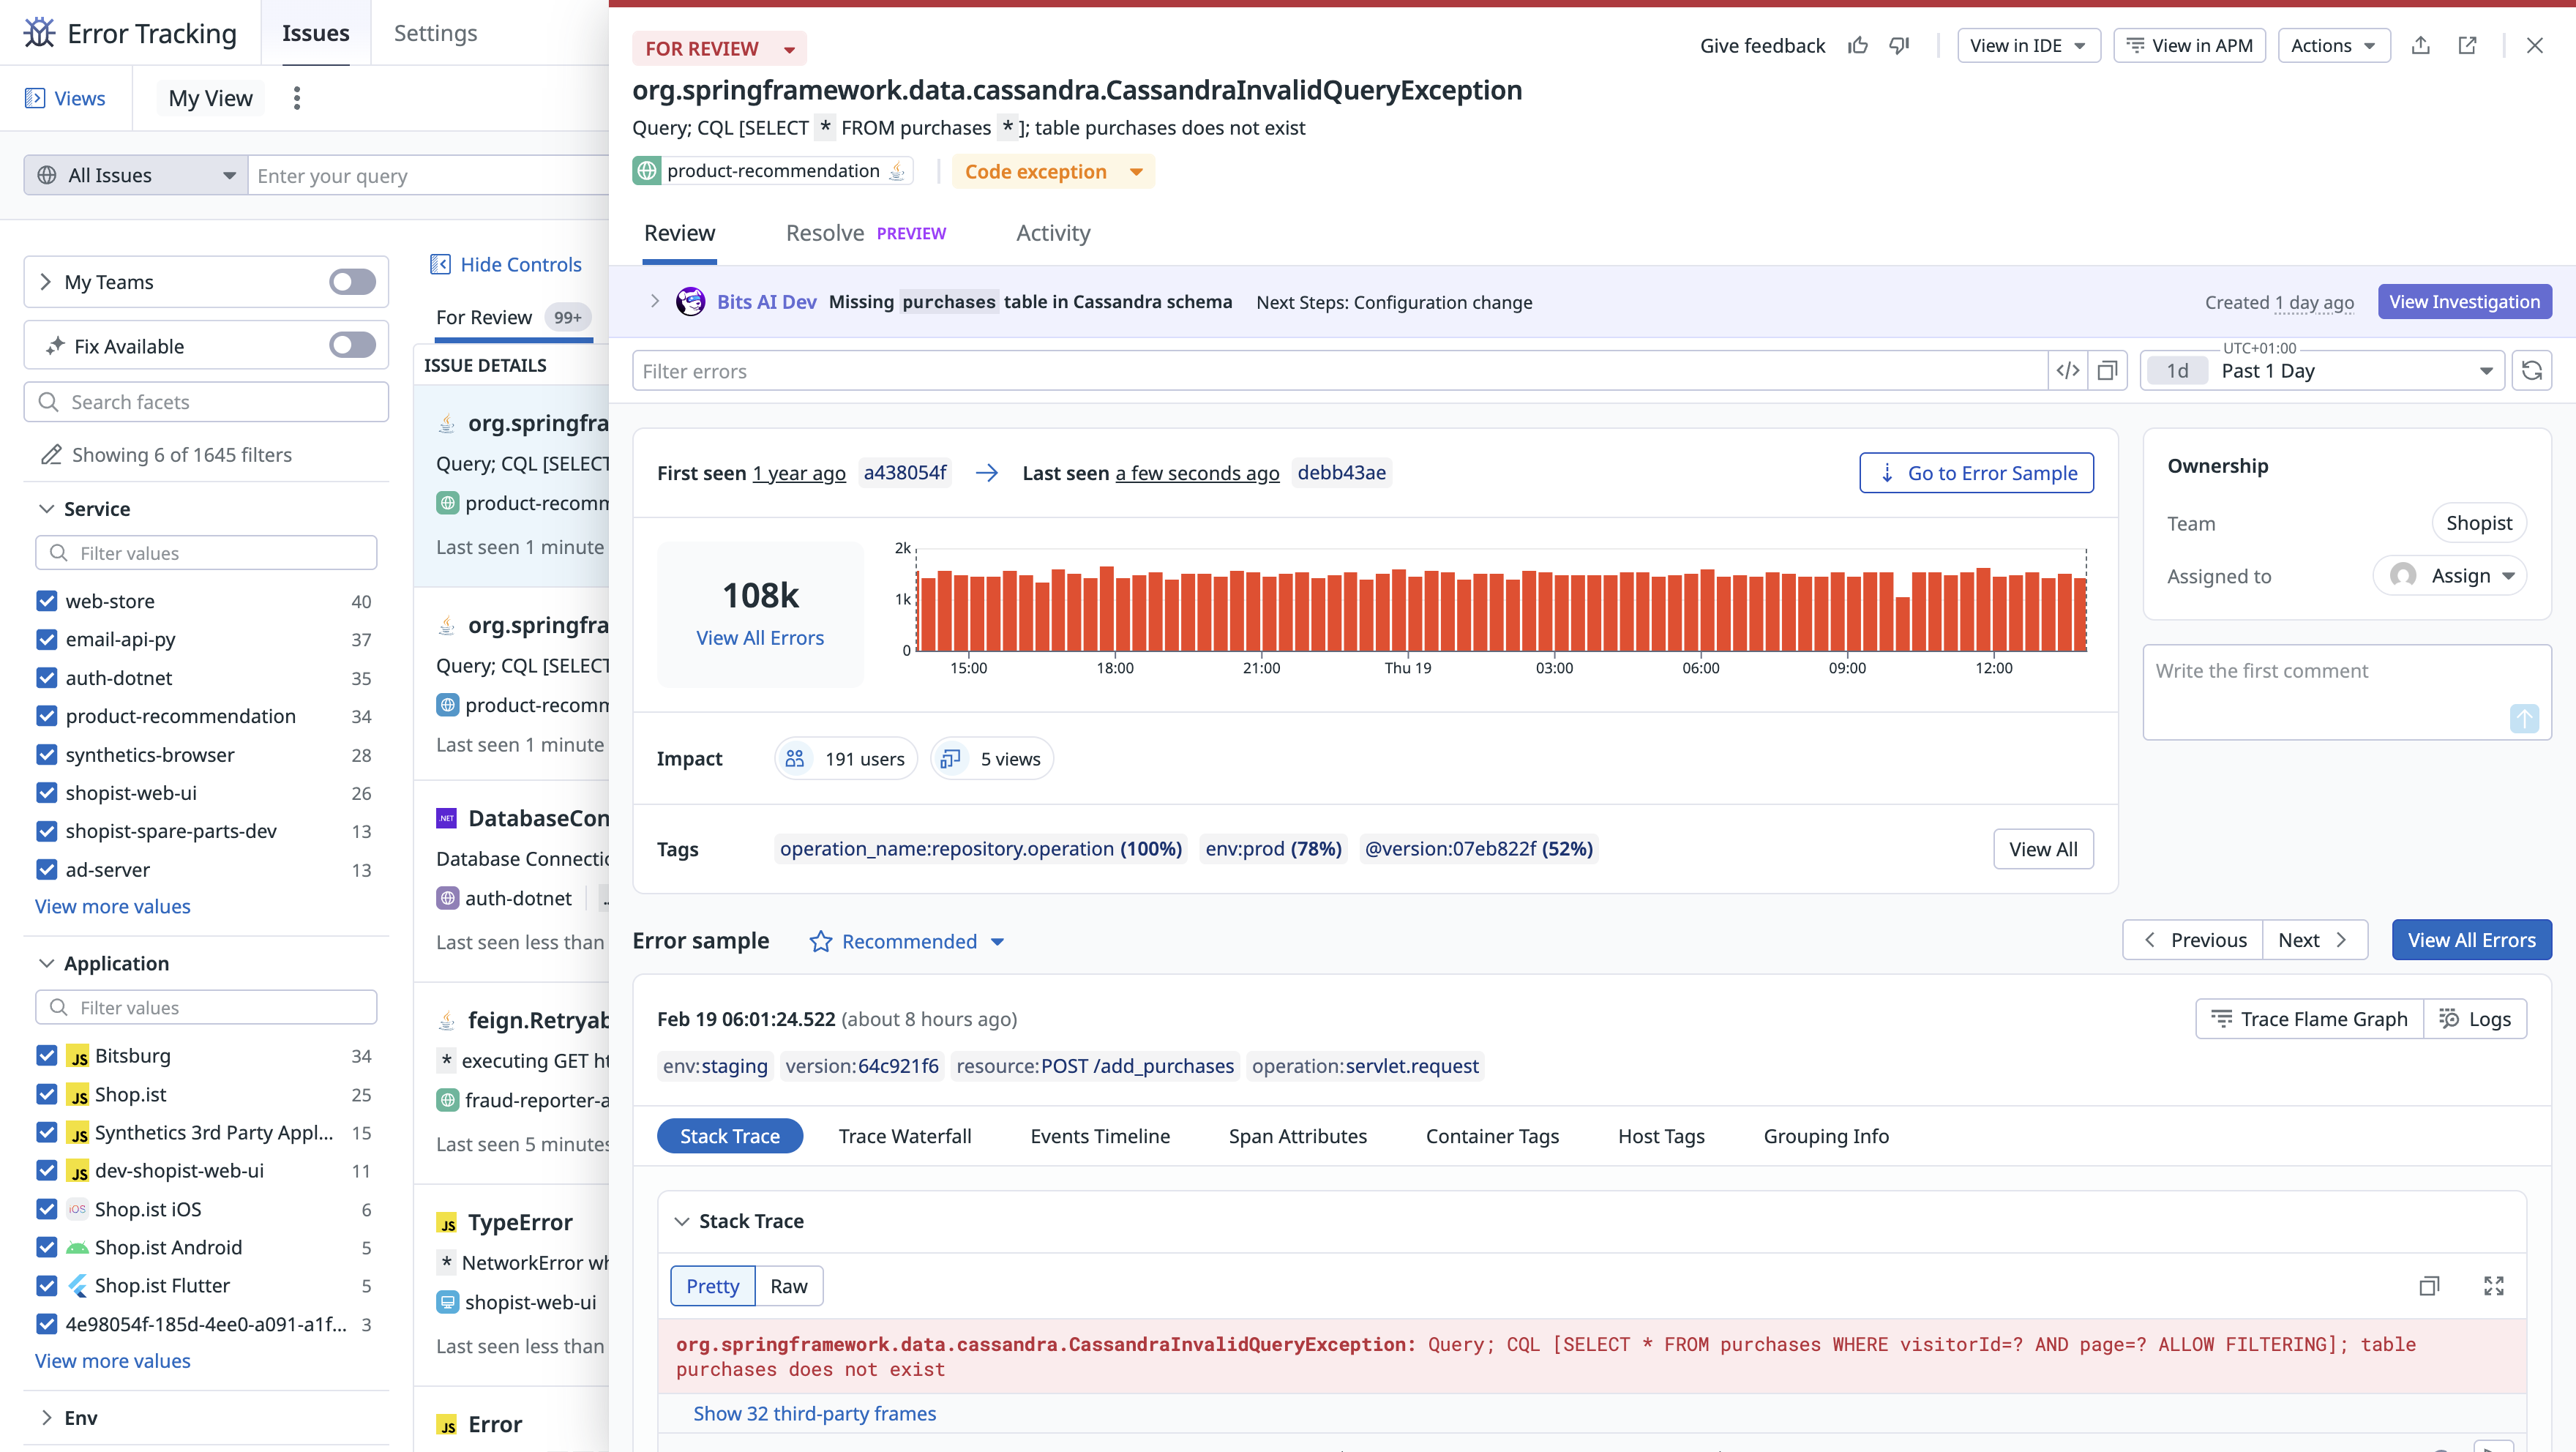
Error Tracking simplifies debugging by grouping thousands of similar errors into a single issue. An issue is an aggregation of error data that provides insights such as
- How many users have been impacted
- When the error first occurred
- Which commit probably caused the error
Error Tracking enables you to:
- Track, triage, and debug fatal errors
- Group similar errors into issues, so that you can more easily identify important errors and reduce noise
- Set monitors on error tracking events, such as high error volume or new issues
- Follow issues over time to know when they first started, if they are still ongoing, and how often they occur
Setup
Error Tracking is available for all languages supported by APM. It requires no additional SDK and no configuration changes.
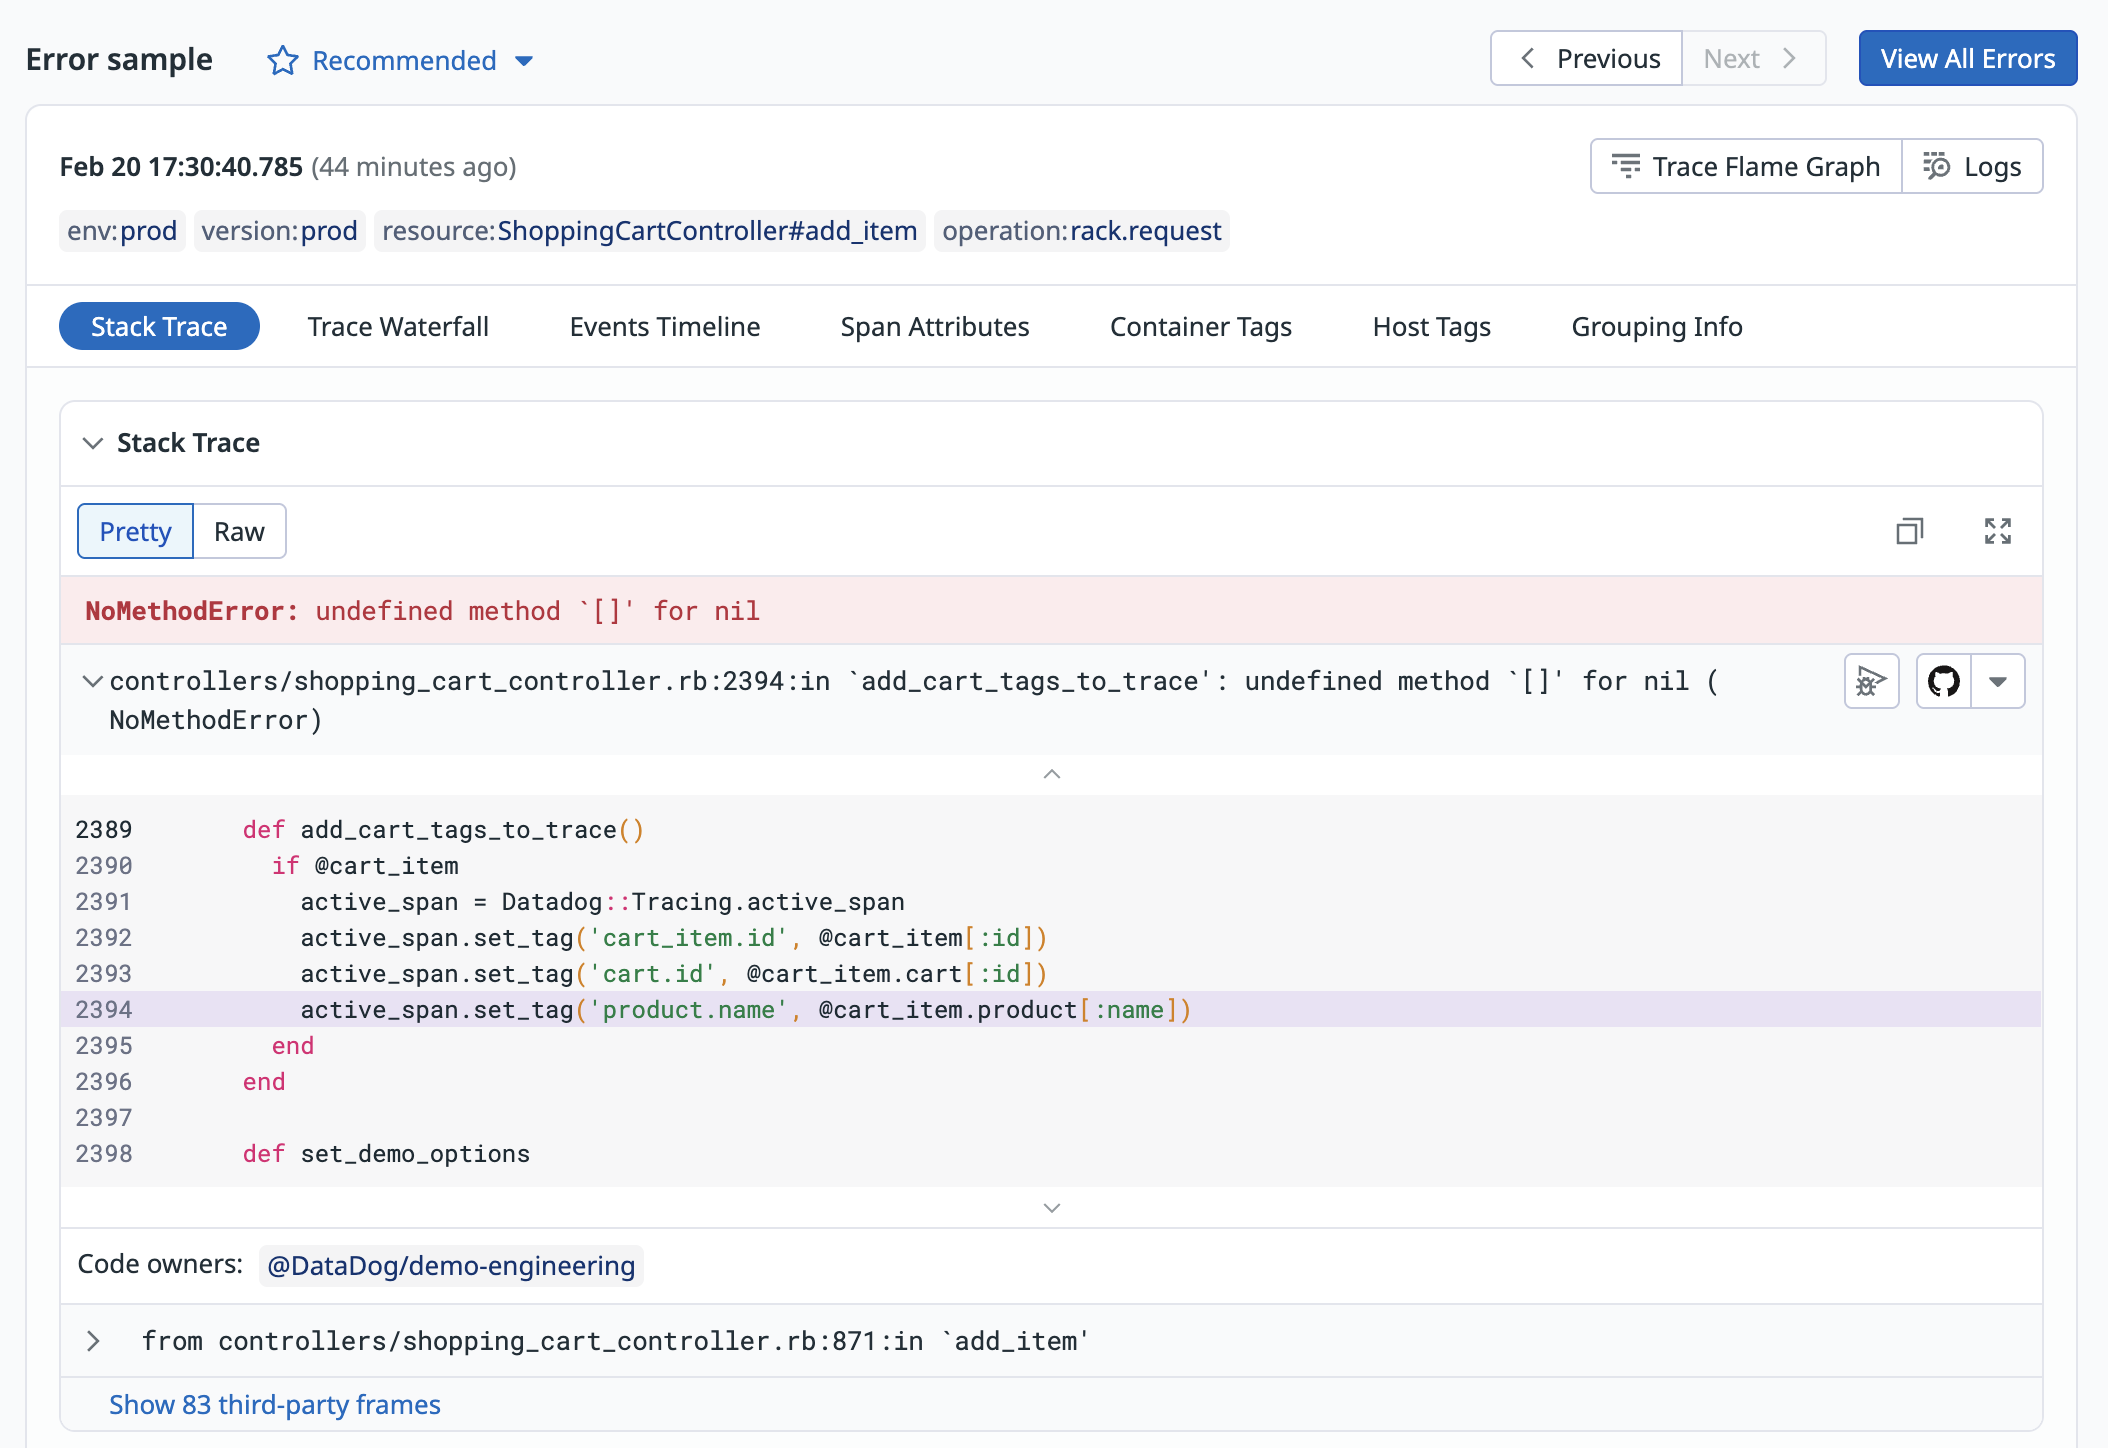
Optionally, to see code snippets in your stack traces, set up the GitHub integration.
To get started with configuring your repository, see the Source Code Integration documentation.
Use span attributes to track error spans
The Datadog tracers collect errors through integrations and the manual instrumentation of your backend services’ source code. An error span must contain the error.stack, error.message, and error.type span attributes and belong to a complete trace to be tracked. If an error is reported multiple times within a service, only the top-most error is kept.
Error Tracking computes a fingerprint for each error span it processes using the error type, the error message, and the frames that form the stack trace. Errors with the same fingerprint are grouped together and belong to the same issue. For more information, see the Trace Explorer documentation.
Control which errors are tracked
Error Tracking automatically processes all error spans, but you can control which errors are ingested and how they are managed:
- Filter errors with inclusion and exclusion rules: Define rules to include or exclude errors based on attributes such as service, environment, or error type. See Manage Data Collection.
- Set rate limits: Control the volume of errors ingested per day to manage costs. See Manage Data Collection.
- Exclude specific issues: Mark recurring non-actionable issues as
EXCLUDEDto stop collecting them. See Issue States. - Filter entire traces: Prevent traces from being sent to Datadog (rather than filtering errors). See Ignoring Unwanted Resources in APM.
Examine issues to start troubleshooting or debugging
Error Tracking automatically categorizes errors into issues collected from your backend services in the Error Tracking Explorer. See the Error Tracking Explorer documentation for a tour of key features.
Issues created from APM include the distribution of impacted spans, the latest most relevant stack trace, span attributes, host tags, container tags, and metrics.
Further Reading
Additional helpful documentation, links, and articles:


