- Essentials
- Getting Started
- Agent
- API
- APM Tracing
- Containers
- Dashboards
- Database Monitoring
- Datadog
- Datadog Site
- DevSecOps
- Incident Management
- Integrations
- Internal Developer Portal
- Logs
- Monitors
- Notebooks
- OpenTelemetry
- Profiler
- Search
- Session Replay
- Security
- Serverless for AWS Lambda
- Software Delivery
- Synthetic Monitoring and Testing
- Tags
- Workflow Automation
- Learning Center
- Support
- Glossary
- Standard Attributes
- Guides
- Agent
- Integrations
- Extend Datadog
- Authorization
- DogStatsD
- Custom Checks
- Integrations
- Build an Integration with Datadog
- Create an Agent-based Integration
- Create an API-based Integration
- Create a Log Pipeline
- Integration Assets Reference
- Build a Marketplace Offering
- Create an Integration Dashboard
- Create a Monitor Template
- Create a Cloud SIEM Detection Rule
- Install Agent Integration Developer Tool
- Service Checks
- Community
- Guides
- OpenTelemetry
- Administrator's Guide
- API
- Partners
- Datadog Mobile App
- DDSQL Reference
- CoScreen
- CoTerm
- Remote Configuration
- Cloudcraft (Standalone)
- In The App
- Dashboards
- Notebooks
- DDSQL Editor
- Reference Tables
- Sheets
- Monitors and Alerting
- Service Level Objectives
- Metrics
- Watchdog
- Bits AI
- Internal Developer Portal
- Error Tracking
- Change Tracking
- Event Management
- Incident Response
- Actions & Remediations
- Infrastructure
- Cloudcraft
- Resource Catalog
- Universal Service Monitoring
- End User Device Monitoring
- Hosts
- Containers
- Processes
- Serverless
- Network Monitoring
- Storage Management
- Cloud Cost
- Application Performance
- APM
- Continuous Profiler
- Database Monitoring
- Agent Integration Overhead
- Setup Architectures
- Setting Up Postgres
- Setting Up MySQL
- Setting Up SQL Server
- Setting Up Oracle
- Setting Up Amazon DocumentDB
- Setting Up MongoDB
- Setting Up ClickHouse
- Connecting DBM and Traces
- Data Collected
- Exploring Database Hosts
- Exploring Query Metrics
- Exploring Query Samples
- Exploring Database Schemas
- Exploring Recommendations
- Troubleshooting
- Guides
- Data Streams Monitoring
- Data Observability
- Digital Experience
- Real User Monitoring
- Synthetic Testing and Monitoring
- Continuous Testing
- Product Analytics
- Session Replay
- Software Delivery
- CI Visibility
- CD Visibility
- Deployment Gates
- Test Optimization
- Code Coverage
- PR Gates
- DORA Metrics
- Feature Flags
- Developer Integrations
- Security
- Security Overview
- Cloud SIEM
- Code Security
- Cloud Security
- App and API Protection
- AI Guard
- Workload Protection
- Sensitive Data Scanner
- AI Observability
- Log Management
- Observability Pipelines
- Configuration
- Sources
- Processors
- Destinations
- Packs
- Akamai CDN
- Amazon CloudFront
- Amazon VPC Flow Logs
- AWS Application Load Balancer Logs
- AWS CloudTrail
- AWS Elastic Load Balancer Logs
- AWS Network Load Balancer Logs
- Cisco ASA
- Cloudflare
- F5
- Fastly
- Fortinet Firewall
- HAProxy Ingress
- Istio Proxy
- Juniper SRX Firewall Traffic Logs
- Netskope
- NGINX
- Okta
- Palo Alto Firewall
- Windows XML
- ZScaler ZIA DNS
- Zscaler ZIA Firewall
- Zscaler ZIA Tunnel
- Zscaler ZIA Web Logs
- Search Syntax
- Scaling and Performance
- Monitoring and Troubleshooting
- Guides and Resources
- Log Management
- CloudPrem
- Administration
- Account Management
- Data Security
- Help
- feature_flags_client
GRPC Testing
Overview
gRPC tests allow you to proactively monitor your gRPC services and servers. You can choose from two types:
- Behavior Checks
- Send gRPC requests to your applications’ API endpoints to verify responses and defined conditions, such as overall response time, header, or body content.
- Health Checks
- gRPC health checks are a standard for reporting the health of gRPC services. Determine if your gRPC servers and services are responsive, running, and capable of handling remote procedure calls (RPCs).
By implementing gRPC health checks, you can run gRPC health checks tests without having to provide a.protofile to Datadog. For more information, see the example health checks.protofile shared by the gRPC community.
gRPC tests can run from both managed and private locations depending on your preference for running the test from outside or inside your network. gRPC tests can run on a schedule, on-demand, or directly within your CI/CD pipelines.
Configuration
You may create a test using one of the following options:
Create a test from a template:
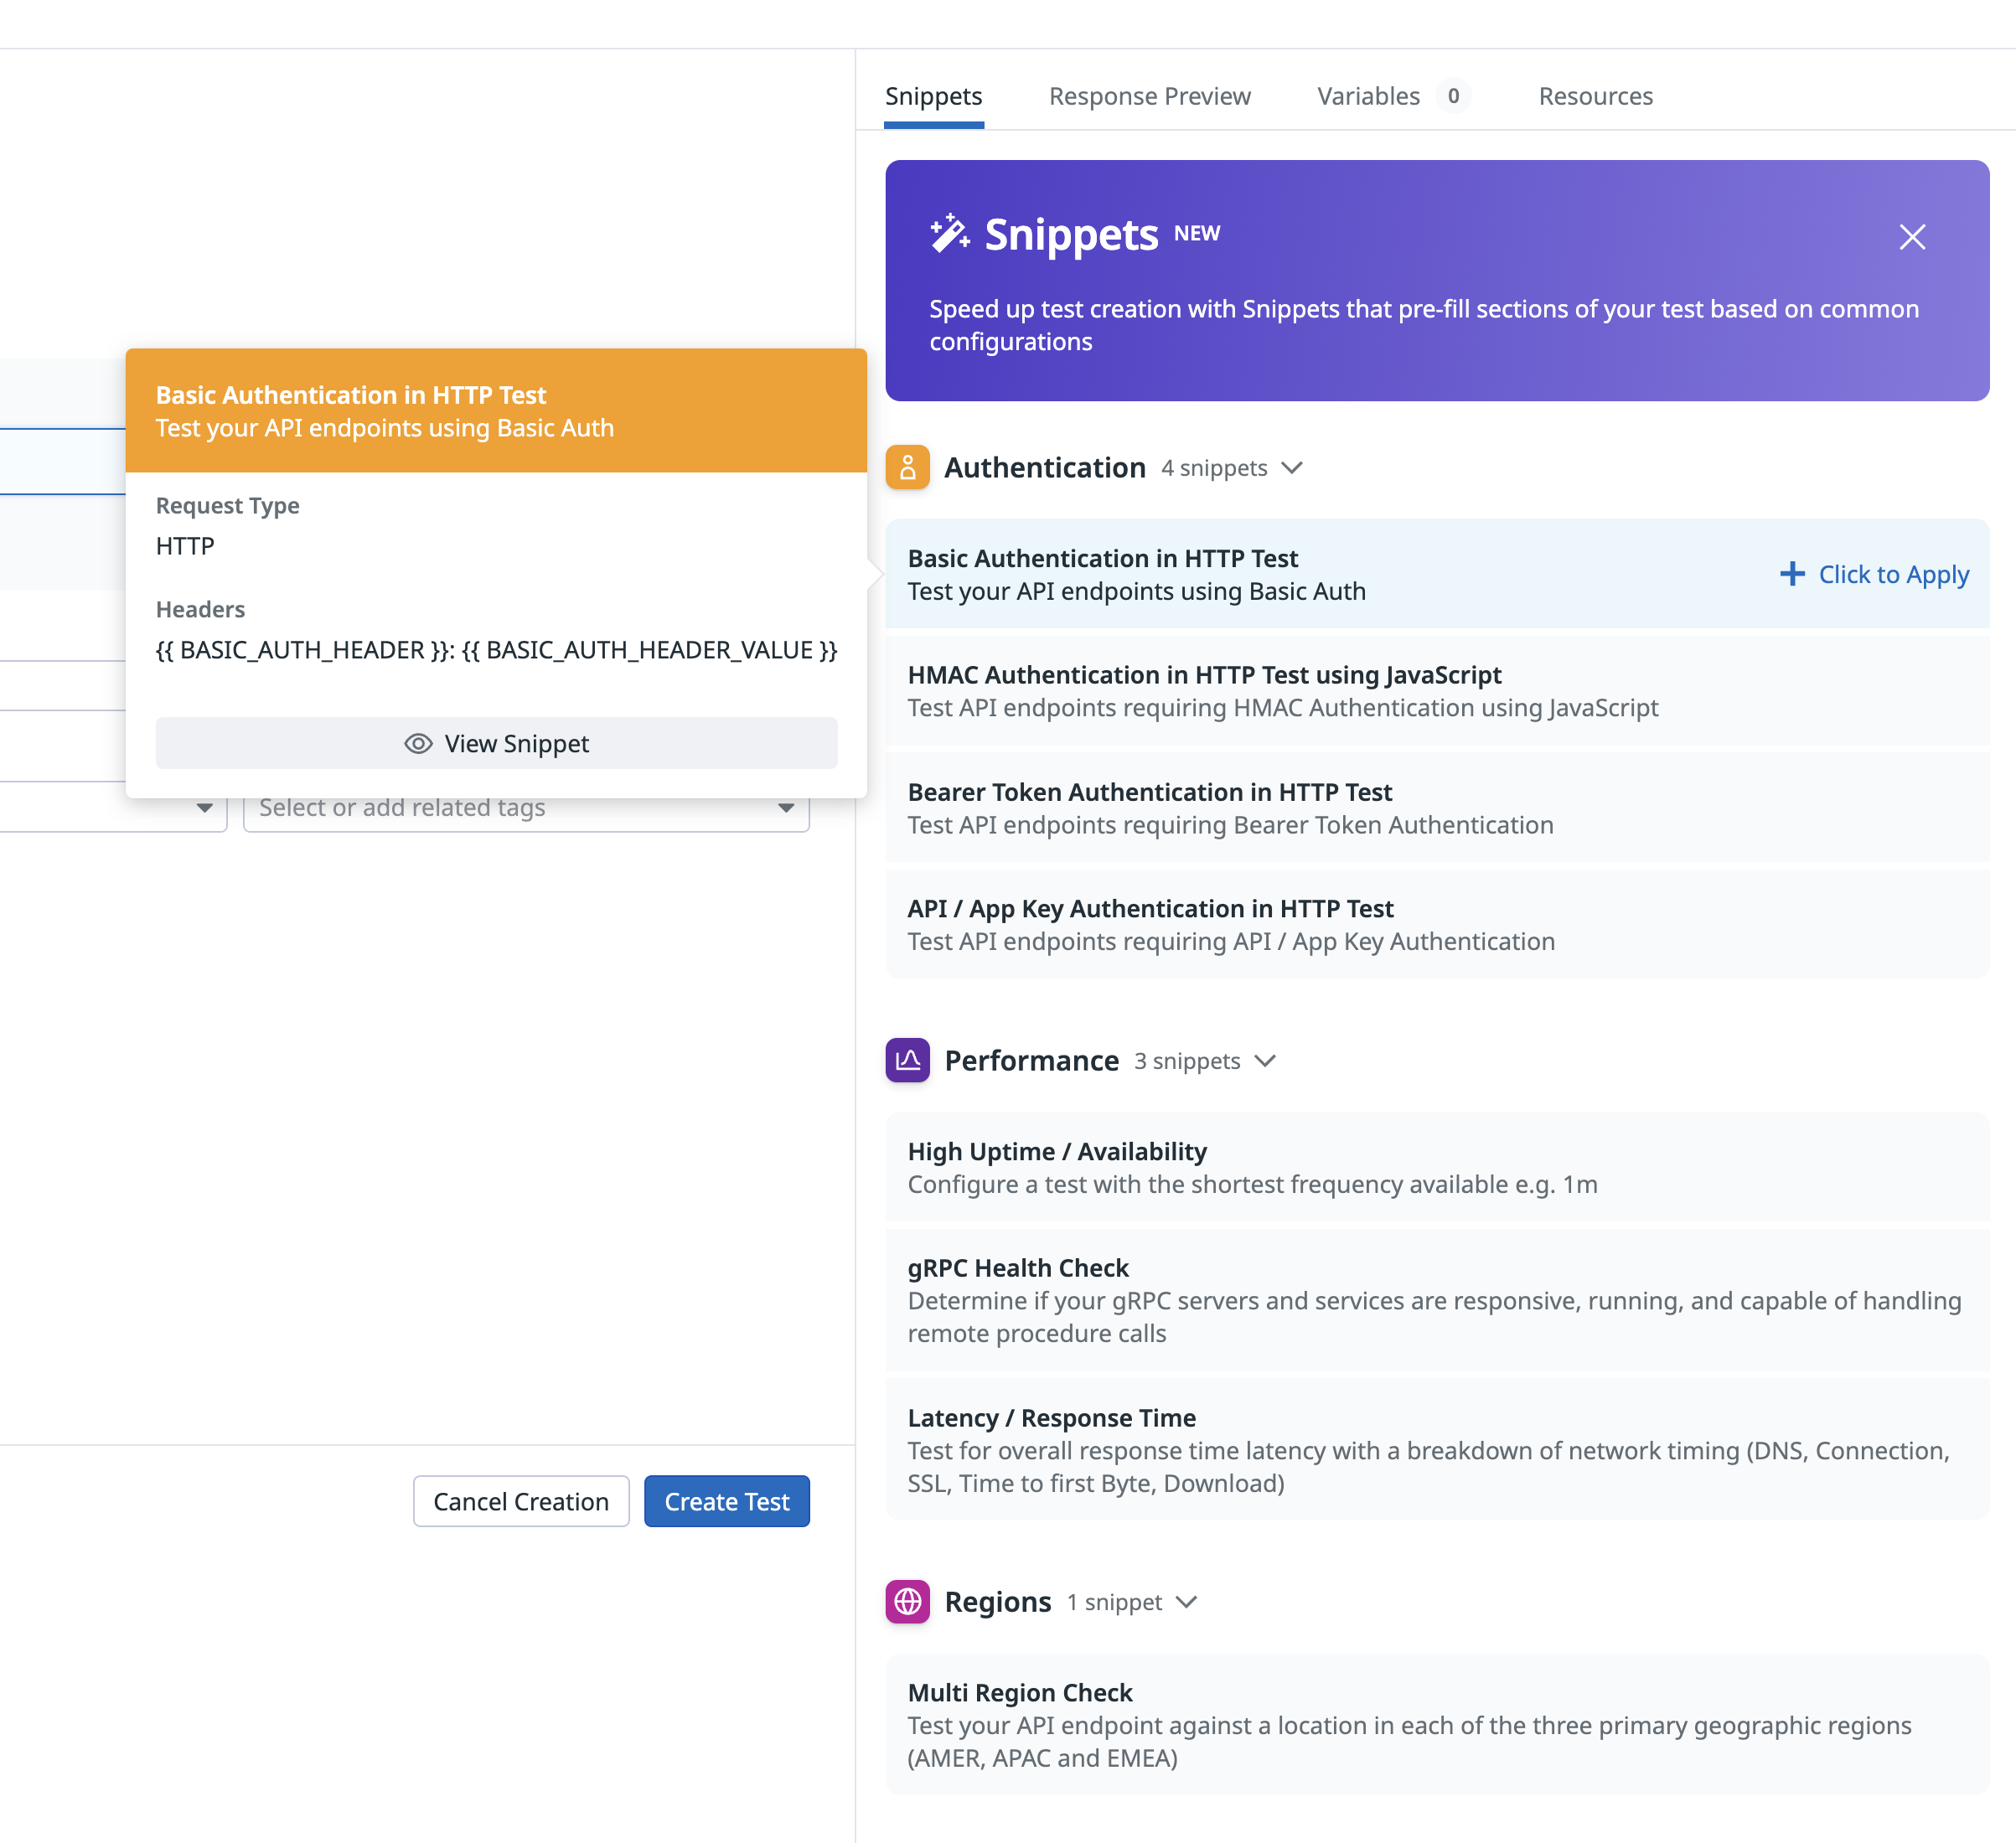
- Hover over one of the pre-populated templates and click View Template. This opens a side panel displaying pre-populated configuration information, including: Test Details, Request Details, Assertions, Alert Conditions, and Monitor Settings.
- Click +Create Test to open the Define Request page, where you can review and edit the pre-populated configuration options. The fields presented are identical to those available when creating a test from scratch.
- Click Save Details to submit your API test.
Build a test from scratch:
- To build a test from scratch, click the + Start from scratch template, then select the
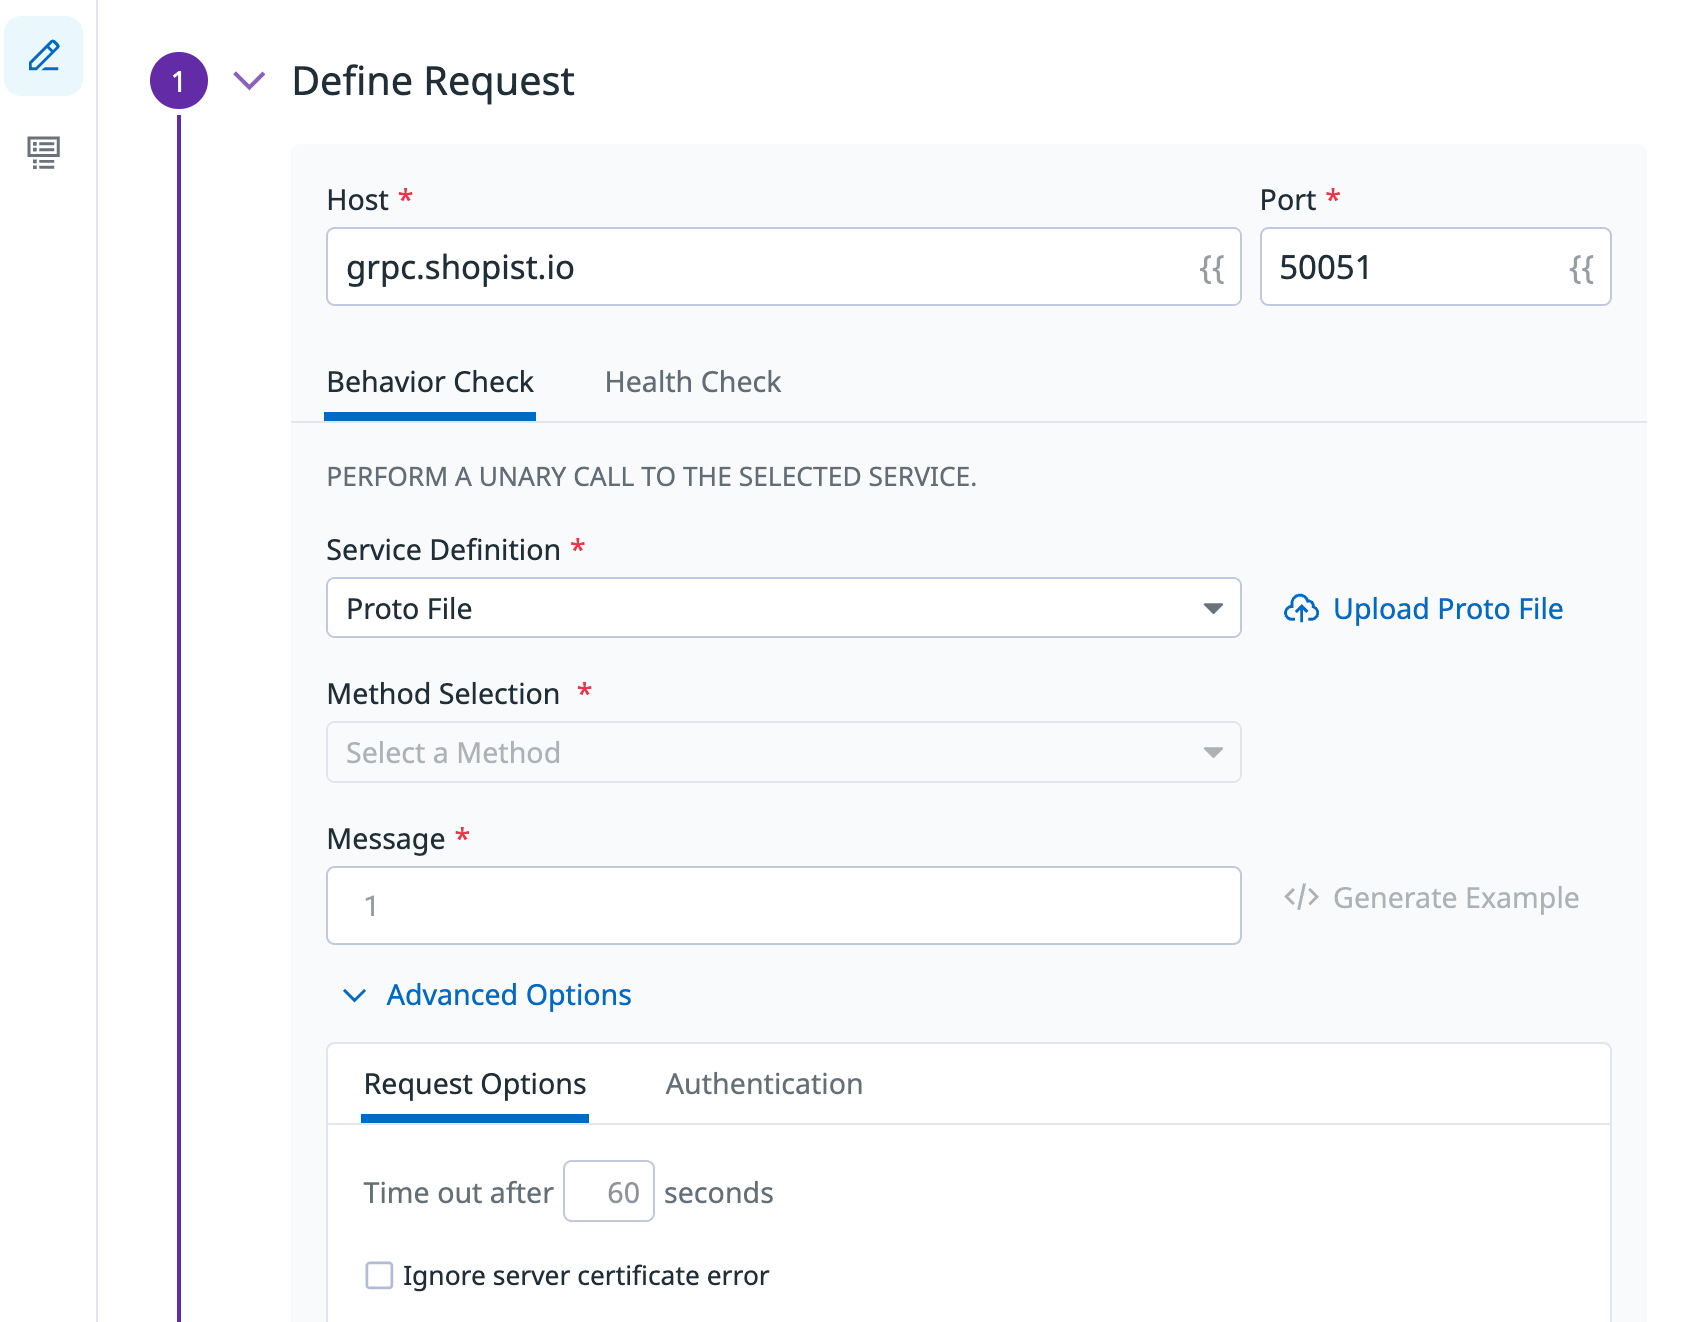
gRPCrequest type. - Specify the Host and Port to run your test on. The default gRPC port is
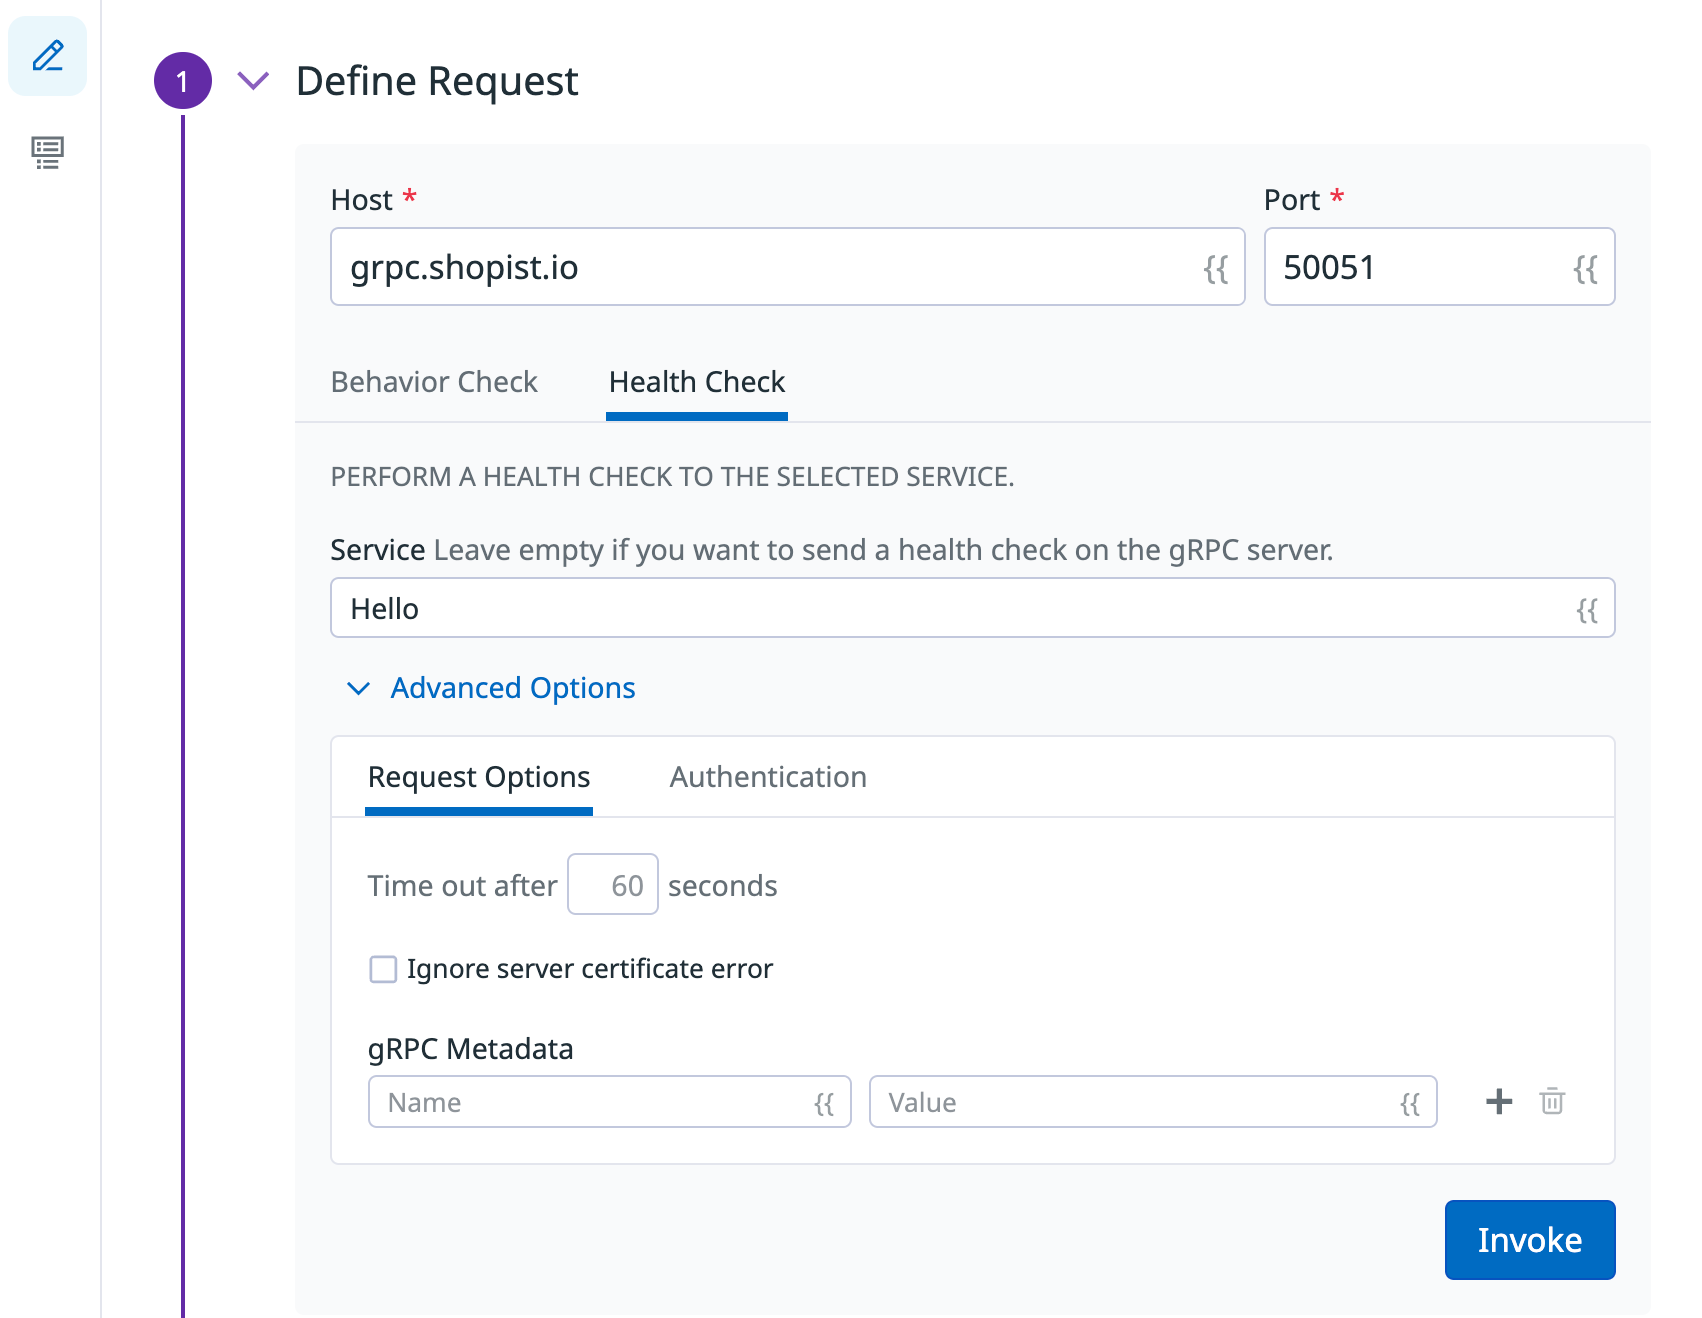
50051. - Select Behavior Check to perform a unary call or Health Check to perform a health check.
For a behavior check, specify the Server Reflection or upload a Proto File that defines your gRPC server. Select a method and include a request message. Datadog does not support streaming methods.
For a health check, enter the name of the service. Leave this field blank if you want to send a health check on the gRPC server.
- To build a test from scratch, click the + Start from scratch template, then select the
Add Advanced Options (optional) to your test:
- Time out: Specify the amount of time in seconds before the test times out.
- Ignore server certificate error: Select to have your gRPC test go on with connection even if there are errors when validating the SSL certificate.
- gRPC metadata: Add and define metadata to your gRPC request to pass metadata between services.
- Client certificate: Authenticate through mTLS by uploading your client certificate (
.crt) and the associated private key (.key) inPEMformat.
You can use the
openssllibrary to convert your certificates. For example, convert aPKCS12certificate toPEMformatted private keys and certificates.openssl pkcs12 -in <CERT>.p12 -out <CERT_KEY>.key -nodes -nocerts openssl pkcs12 -in <CERT>.p12 -out <CERT>.cert -nokeysName your gRPC test.
Add Environment Tags as well as any other tags to your gRPC test. You can then use these tags to filter through your Synthetic tests on the Synthetic Monitoring & Continuous Testing page.
Click Invoke to try out the request configuration. A response preview is displayed on the right side of your screen.
Click Create Test to submit your API test.
Snippets
When setting up a new Synthetic Monitoring API test, use snippets to automatically fill in basic auth, performance, and regions, rather than selecting these options manually. The following snippets are available:
Basic Auth: Automatically test your APIs using pre-populated basic auth headers, JavaScript, bearer token, and API/app key auth variables.
Performance: Automatically configure a test with the shortest frequency (one minute), perform a gRPC health check, and test for overall response time latency with a breakdown of network timing.
Regions: Automatically test your API endpoint against a location in each of the three primary geographic regions (AMER, APAC and EMEA).

Define assertions
Assertions define what an expected test result is. After you click Send, an assertion on the response time is added based on the response that was obtained. You must define at least one assertion for your test to monitor.
| Type | Operator | Value type |
|---|---|---|
| response time | is less than | Integer (ms) |
| gRPC response | contains, does not contain, is, is not,matches, does not match,jsonpath, xpath | String Regex |
| gRPC metadata | is, is not, contains, does not contain, matches regex, does not match regex, does not exist | Integer (ms) Regex |
You can create up to 20 assertions per API test by clicking New Assertion or by clicking directly on the response preview:
| Type | Operator | Value type |
|---|---|---|
| response time | is less than | Integer (ms) |
| healthcheck status | is, is not | Integer (ms) |
| gRPC metadata | is, is not, contains, does not contain, matches regex, does not match regex, does not exist | Integer (ms) |
You can create up to 20 assertions per API test by clicking New Assertion or by clicking directly on the response preview:
If a test does not contain an assertion on the response body, the body payload drops and returns an associated response time for the request within the timeout limit set by the Synthetics Worker.
If a test contains an assertion on the response body and the timeout limit is reached, an Assertions on the body/response cannot be run beyond this limit error appears.
Select locations
Select the Locations to run your gRPC test from. gRPC tests can run from both managed and private locations depending on your preference for running the test from outside or inside your network.
Datadog’s out-of-the-box managed locations allow you to test public-facing websites and endpoints from regions where your customers are located.
AWS:
| Americas | Asia Pacific | EMEA |
|---|---|---|
| Canada Central | Hong Kong | Bahrain |
| Northern California | Jakarta | Cape Town |
| Northern Virginia | Mumbai | Frankfurt |
| Ohio | Osaka | Ireland |
| Oregon | Seoul | London |
| São Paulo | Singapore | Milan |
| Sydney | Paris | |
| Tokyo | Stockholm |
GCP:
| Americas | Asia Pacific | EMEA |
|---|---|---|
| Dallas | Tokyo | Frankfurt |
| Los Angeles | ||
| Oregon | ||
| Virginia |
Azure:
| Region | Location |
|---|---|
| Americas | Virginia |
The Datadog for Government site (US1-FED) uses the following managed location:
| Region | Location |
|---|---|
| Americas | US-West |
Specify test frequency
gRPC tests can run:
- On a schedule to ensure your most important services are always accessible to your users. Select the frequency at which you want Datadog to run your gRPC test.
- Within your CI/CD pipelines to start shipping without fearing faulty code might impact your customers experience.
- On-demand to run your tests whenever makes the most sense for your team.
Define alert conditions
Set alert conditions to determine the circumstances under which you want a test to fail and trigger an alert.
Alerting rule
When you set the alert conditions to: An alert is triggered if any assertion fails for X minutes from any n of N locations, an alert is triggered only if these two conditions are true:
- At least one location was in failure (at least one assertion failed) during the last X minutes;
- At one moment during the last X minutes, at least n locations were in failure.
Fast retry
Your test can trigger retries X times after Y ms in case of a failed test result. Customize the retry interval to suit your alerting sensibility.
Location uptime is computed on a per-evaluation basis (whether the last test result before evaluation was up or down). The total uptime is computed based on the configured alert conditions. Notifications sent are based on the total uptime.
For more information on how Synthetic Monitoring notifications evaluate test results and trigger alerts, see Understanding Synthetic Monitor Alerting.
Configure the test monitor
A notification is sent by your test based on the alerting conditions previously defined. Use this section to define how and what to message your team.
Similar to how you configure monitors, select users and/or services that should receive notifications either by adding an
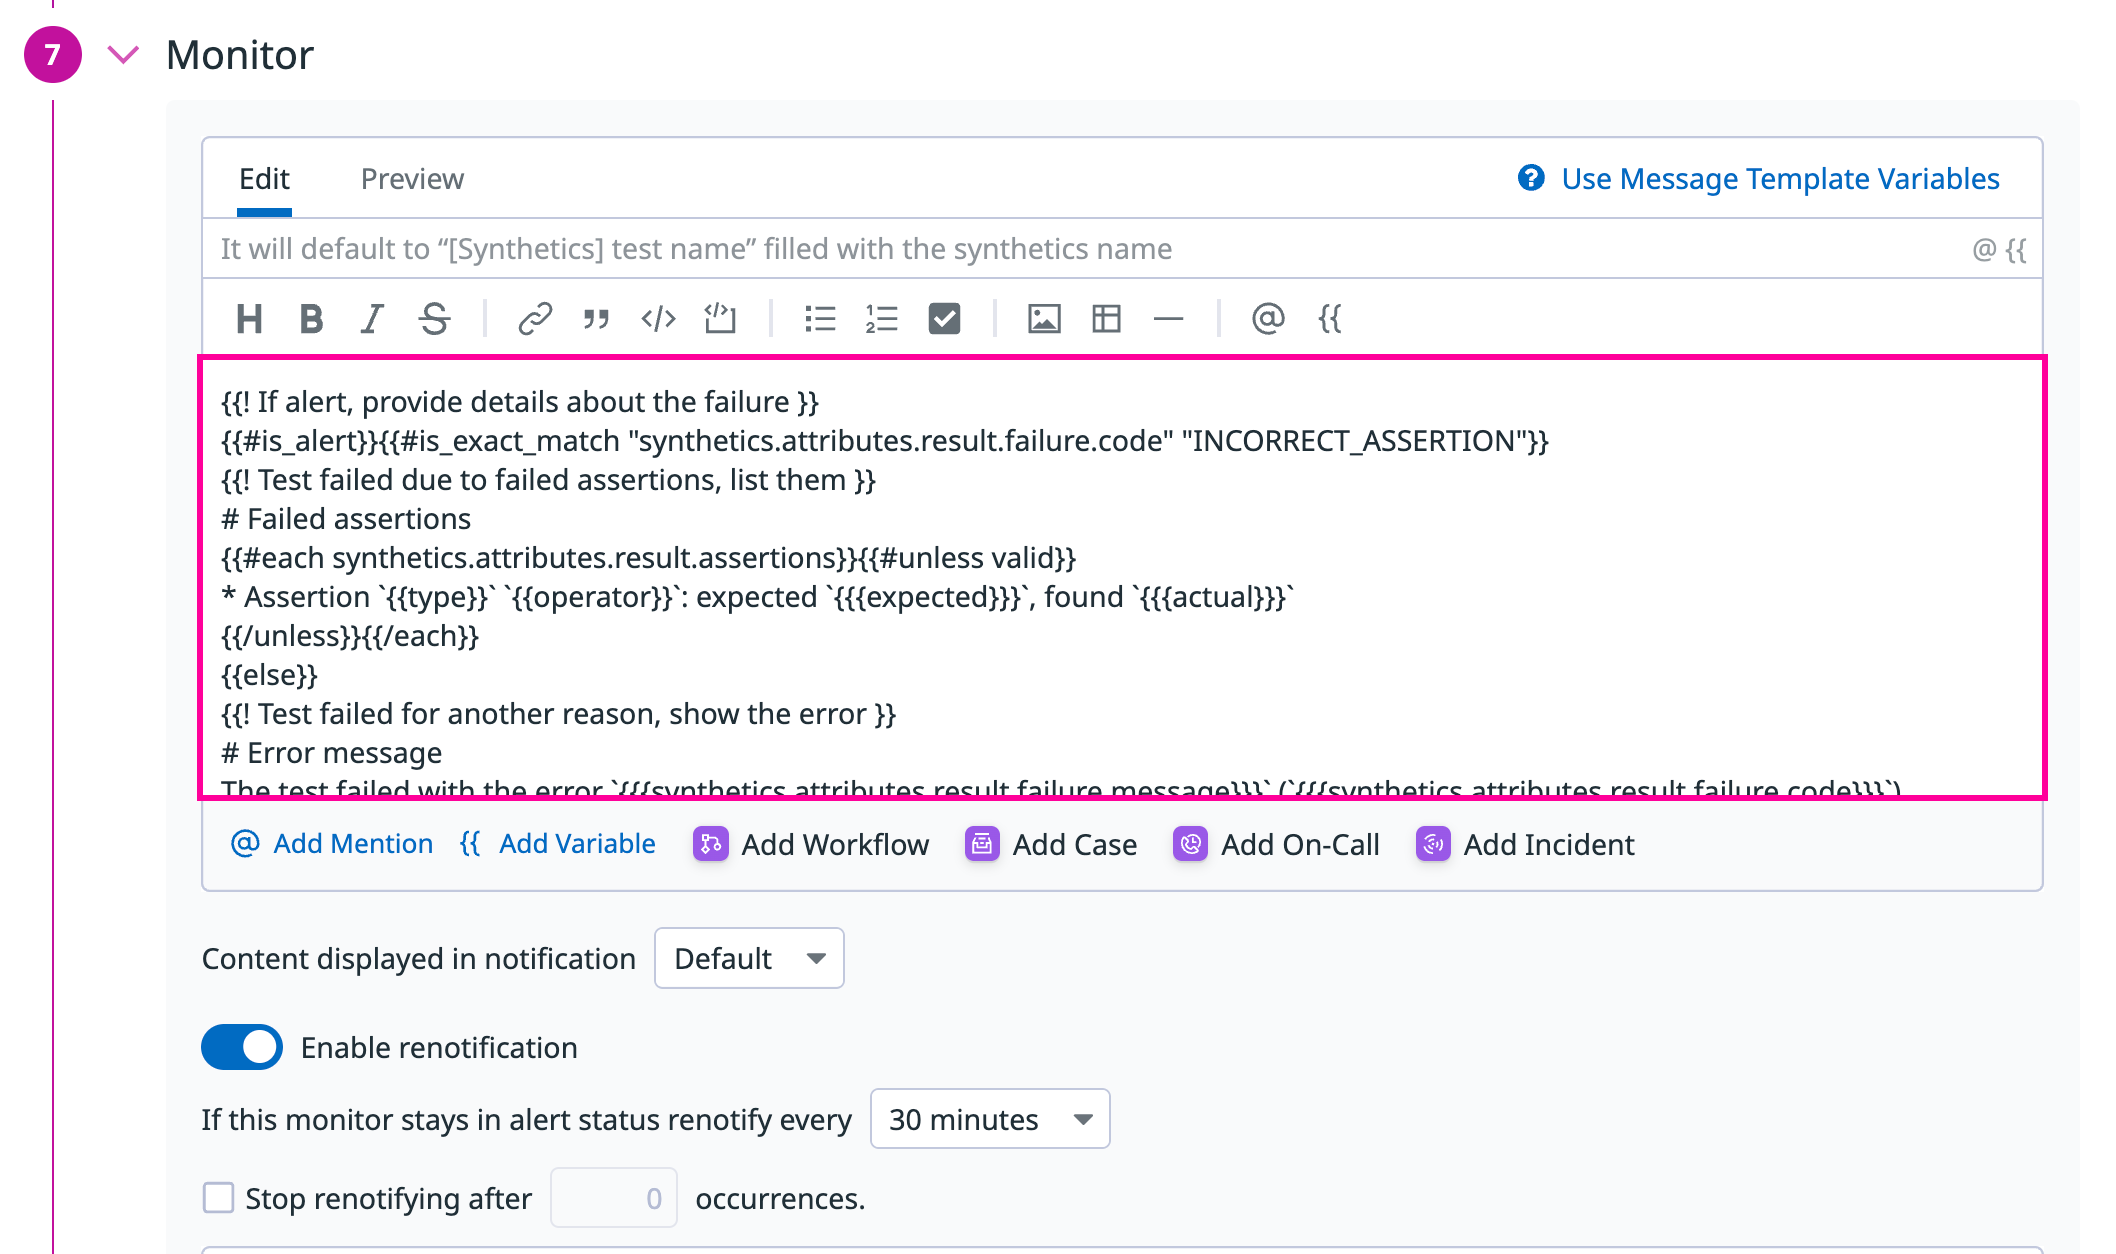
@notificationto the message or by searching for team members and connected integrations with the dropdown menu.Enter the notification message for your test or use pre-filled monitor messages. This field allows standard Markdown formatting and supports the following conditional variables:
| Conditional Variable | Description |
|---|---|
{{#is_alert}} | Show when the test alerts. |
{{^is_alert}} | Show unless the test alerts. |
{{#is_recovery}} | Show when the test recovers from alert. |
{{^is_recovery}} | Show unless the test recovers from alert. |
{{#is_renotify}} | Show when the monitor renotifies. |
{{^is_renotify}} | Show unless the monitor renotifies. |
{{#is_priority}} | Show when the monitor matches priority (P1 to P5). |
{{^is_priority}} | Show unless the monitor matches priority (P1 to P5). |
Notification messages include the message defined in this section and information about the failing locations. Pre-filled monitor messages are included in the message body section:

Specify how often you want your test to re-send the notification message in case of test failure. To prevent renotification on failing tests, check the option
Stop re-notifying on X occurrences.Click Save & Start Recording to save your test configuration and monitor.
For more information, see Synthetic Monitoring notifications.
Create local variables
To create a local variable, click + All steps > Variables. You can select one of the following available builtins to add to your variable string:
- {{ numeric(n) }}
- Generates a numeric string with
ndigits. - {{ alphabetic(n) }}
- Generates an alphabetic string with
nletters. - {{ alphanumeric(n) }}
- Generates an alphanumeric string with
ncharacters. - {{ date(n unit, format) }}
- Generates a date in one of Datadog’s accepted formats with a value corresponding to the UTC date the test is initiated at + or -
nunits. - {{ timestamp(n, unit) }}
- Generates a timestamp in one of Datadog’s accepted units with a value corresponding to the UTC timestamp the test is initiated at +/-
nunits. - {{ uuid }}
- Generates a version 4 universally unique identifier (UUID).
- {{ public-id }}
- Injects the Public ID of your test.
- {{ result-id }}
- Injects the Result ID of your test run.
To obfuscate local variable values in test results, select Hide and obfuscate variable value. Once you have defined the variable string, click Add Variable.
Use variables
You can use the global variables defined on the Settings page in the URL, advanced options, and assertions of your gRPC tests.
To display your list of variables, type {{ in your desired field.
Test failure
A test is considered FAILED if it does not satisfy one or more assertions or if the request prematurely failed. In some cases, the test can fail without testing the assertions against the endpoint.
For a complete list of gRPC error codes, see API Testing Errors.
Permissions
By default, only users with the Datadog Admin and Datadog Standard roles can create, edit, and delete Synthetic gRPC tests. To get create, edit, and delete access to Synthetic gRPC tests, upgrade your user to one of those two default roles.
If you are using the custom role feature, add your user to any custom role that includes synthetics_read and synthetics_write permissions.
Restrict access
Use granular access control to limit who has access to your test based on roles, teams, or individual users:
- Open the permissions section of the form.
- Click Edit Access.

- Click Restrict Access.
- Select teams, roles, or users.
- Click Add.
- Select the level of access you want to associate with each of them.
- Click Done.
You can view results from a Private Location even without Viewer access to that Private Location.
| Access level | View test configuration | Edit test configuration | View test results | Run test |
|---|---|---|---|---|
| No access | ||||
| Viewer | Yes | Yes | ||
| Editor | Yes | Yes | Yes | Yes |
Further Reading
Additional helpful documentation, links, and articles:


