- Essentials
- Getting Started
- Agent
- API
- APM Tracing
- Containers
- Dashboards
- Database Monitoring
- Datadog
- Datadog Site
- DevSecOps
- Incident Management
- Integrations
- Internal Developer Portal
- Logs
- Monitors
- OpenTelemetry
- Profiler
- Session Replay
- Security
- Serverless for AWS Lambda
- Software Delivery
- Synthetic Monitoring and Testing
- Tags
- Workflow Automation
- Learning Center
- Support
- Glossary
- Standard Attributes
- Guides
- Agent
- Integrations
- Developers
- Authorization
- DogStatsD
- Custom Checks
- Integrations
- Create an Agent-based Integration
- Create an API Integration
- Create a Log Pipeline
- Integration Assets Reference
- Build a Marketplace Offering
- Create a Tile
- Create an Integration Dashboard
- Create a Monitor Template
- Create a Cloud SIEM Detection Rule
- OAuth for Integrations
- Install Agent Integration Developer Tool
- Service Checks
- IDE Plugins
- Community
- Guides
- OpenTelemetry
- Administrator's Guide
- API
- Partners
- Datadog Mobile App
- DDSQL Reference
- CoScreen
- CoTerm
- Cloudcraft (Standalone)
- In The App
- Dashboards
- Notebooks
- DDSQL Editor
- Reference Tables
- Sheets
- Monitors and Alerting
- Metrics
- Watchdog
- Bits AI
- Internal Developer Portal
- Error Tracking
- Change Tracking
- Service Management
- Actions & Remediations
- Infrastructure
- Cloudcraft
- Resource Catalog
- Universal Service Monitoring
- Hosts
- Containers
- Processes
- Serverless
- Network Monitoring
- Cloud Cost
- Application Performance
- APM
- APM Terms and Concepts
- Application Instrumentation
- APM Metrics Collection
- Trace Pipeline Configuration
- Correlate Traces with Other Telemetry
- Trace Explorer
- Recommendations
- Code Origins for Spans
- Service Observability
- Endpoint Observability
- Dynamic Instrumentation
- Live Debugger
- Error Tracking
- Data Security
- Guides
- Troubleshooting
- Continuous Profiler
- Database Monitoring
- Agent Integration Overhead
- Setup Architectures
- Setting Up Postgres
- Setting Up MySQL
- Setting Up SQL Server
- Setting Up Oracle
- Setting Up Amazon DocumentDB
- Setting Up MongoDB
- Connecting DBM and Traces
- Data Collected
- Exploring Database Hosts
- Exploring Query Metrics
- Exploring Query Samples
- Exploring Database Schemas
- Exploring Recommendations
- Troubleshooting
- Guides
- Data Streams Monitoring
- Data Jobs Monitoring
- Data Observability
- Digital Experience
- Real User Monitoring
- Synthetic Testing and Monitoring
- Continuous Testing
- Product Analytics
- Software Delivery
- CI Visibility
- CD Visibility
- Deployment Gates
- Test Optimization
- Quality Gates
- DORA Metrics
- Security
- Security Overview
- Cloud SIEM
- Code Security
- Cloud Security
- App and API Protection
- Workload Protection
- Sensitive Data Scanner
- AI Observability
- Log Management
- Observability Pipelines
- Log Management
- Administration
Declare an Incident
Overview
In the Datadog paradigm, any of the following are appropriate situations for declaring an incident:
- An issue is or may be impacting customers.
- You believe an issue (including an internal one) needs to be addressed as an emergency.
- You don’t know if you should call an incident - notify other people and increase severity appropriately.
You can declare an incident from multiple places within the Datadog platform, such as a graph widget on a dashboard, the Incidents UI, or any alert reporting into Datadog.
From the Incident page
In the Datadog UI, click Declare Incident to create an incident.
The Declare Incident modal displays a collapsible side panel that contains helper text and descriptions for the severities and statuses used by your organization. The helper text and descriptions are customizable in Incident Settings.
From a monitor
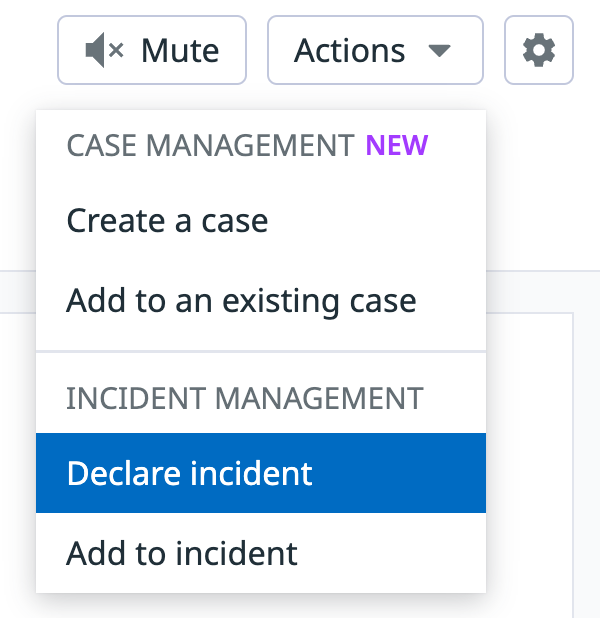
You can declare an incident directly from a monitor from the Actions dropdown. Select Declare incident to open an incident creation modal, and the monitor is added into the incident as a signal. You can also add a monitor to an existing incident.
Alternatively, you can have a monitor automatically create an incident when it transitions to a warn, alert, or no data status. To enable this, click Add Incident in the Configure notifications and automations section of a monitor and select an @incident- option. Admins can create @incident- options in Incident Settings.
Incidents created from a monitor will inherit field values from the monitor’s tags. To send automated notifications from incidents, add tags to a monitor so that created incidents match the criteria of notification rules.
From a Security Signal
Declare an incident directly from a Cloud SIEM or Workload Protection signal side panel, by clicking Declare incident or Escalate Investigation. For more information, see Investigate Security Signals.
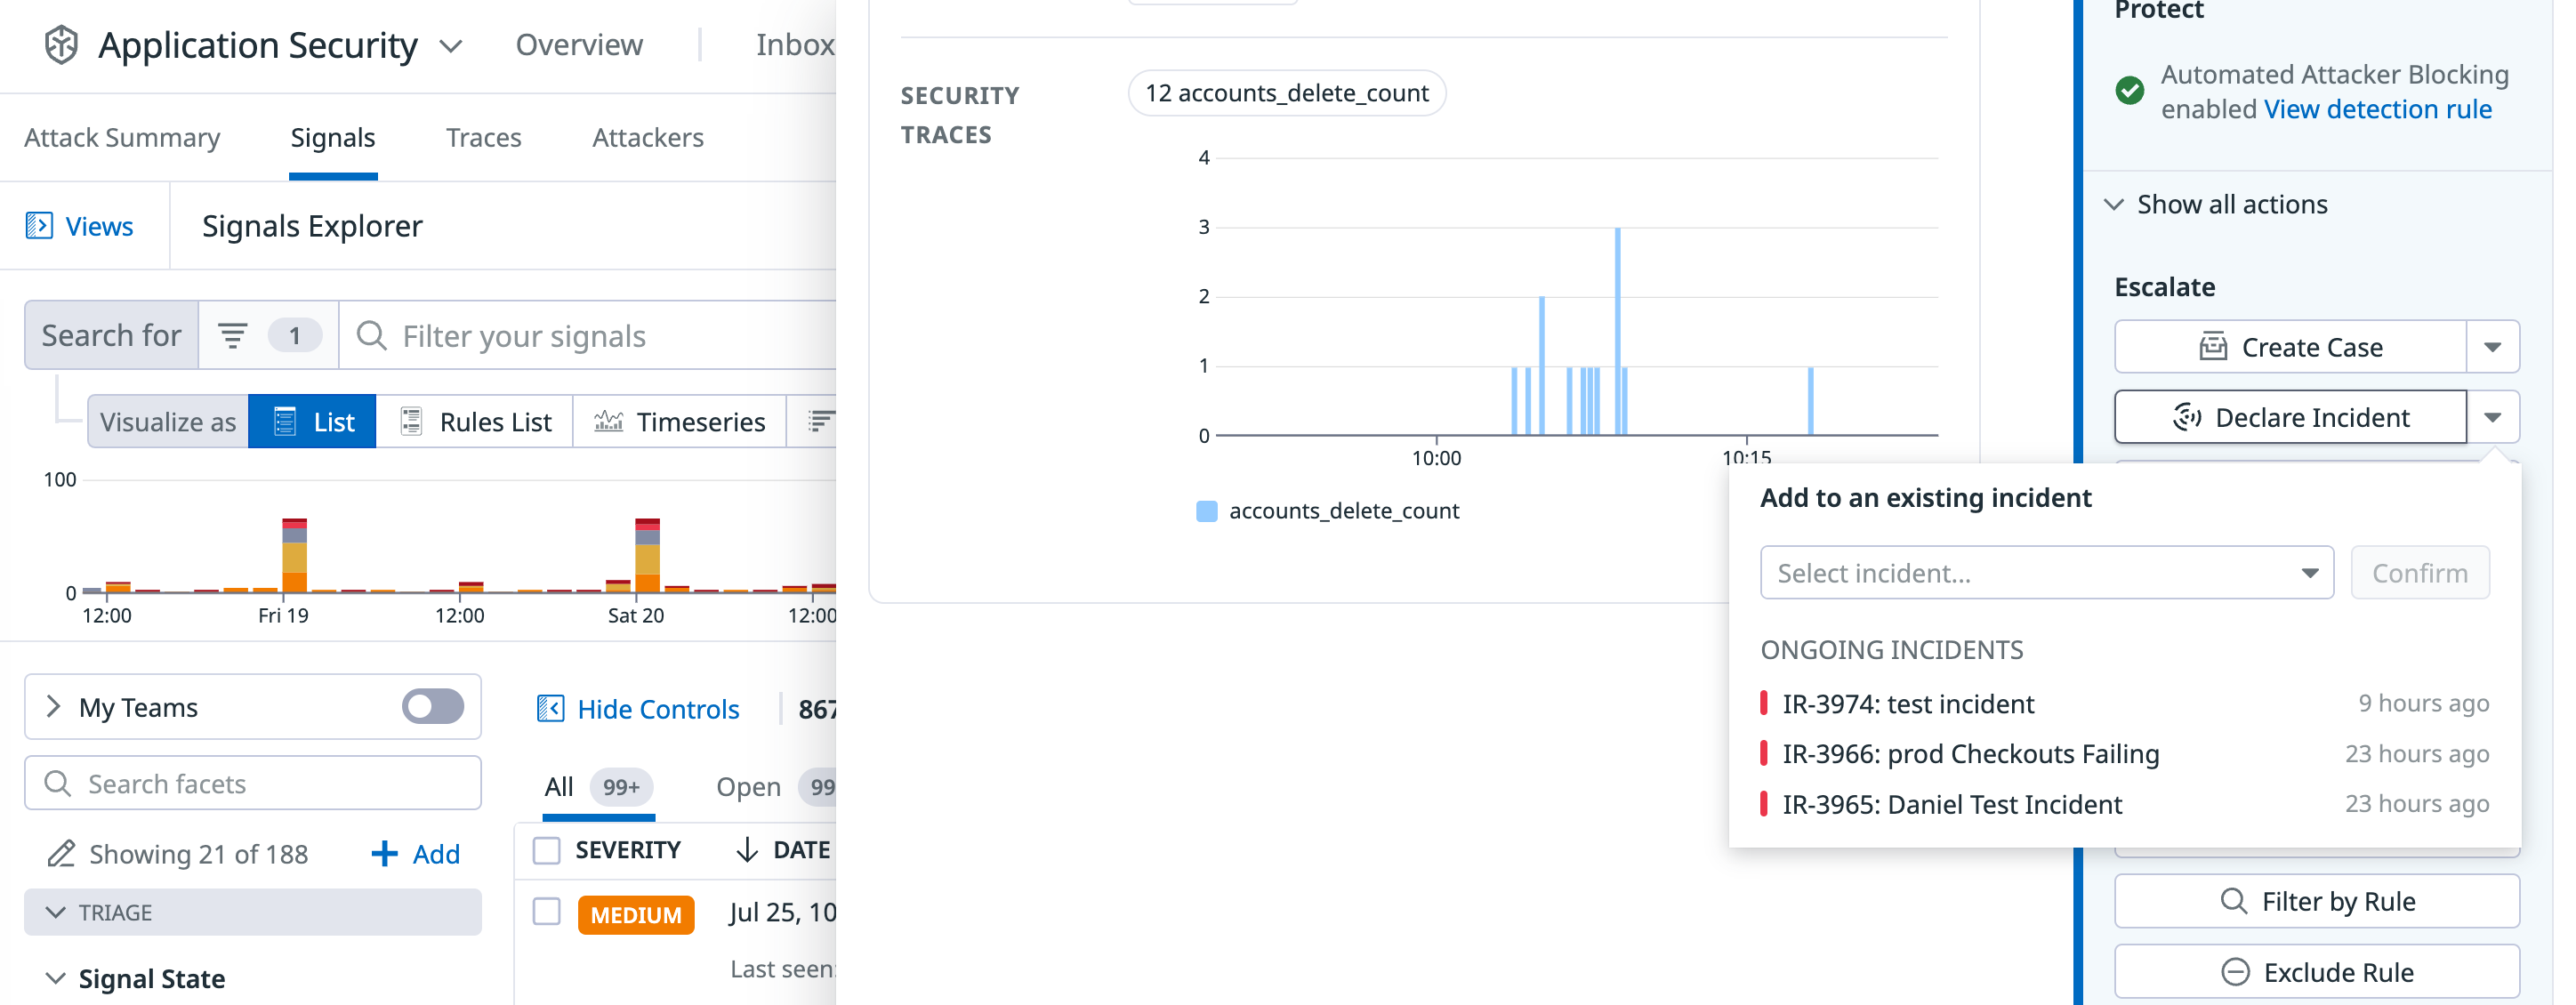
Declare an incident from an App and API Protection signal through the actions listed in the signal side panel. Click Show all actions and click Declare Incident. For more information, see Investigate Security Signals for App and API Protection.
From a case
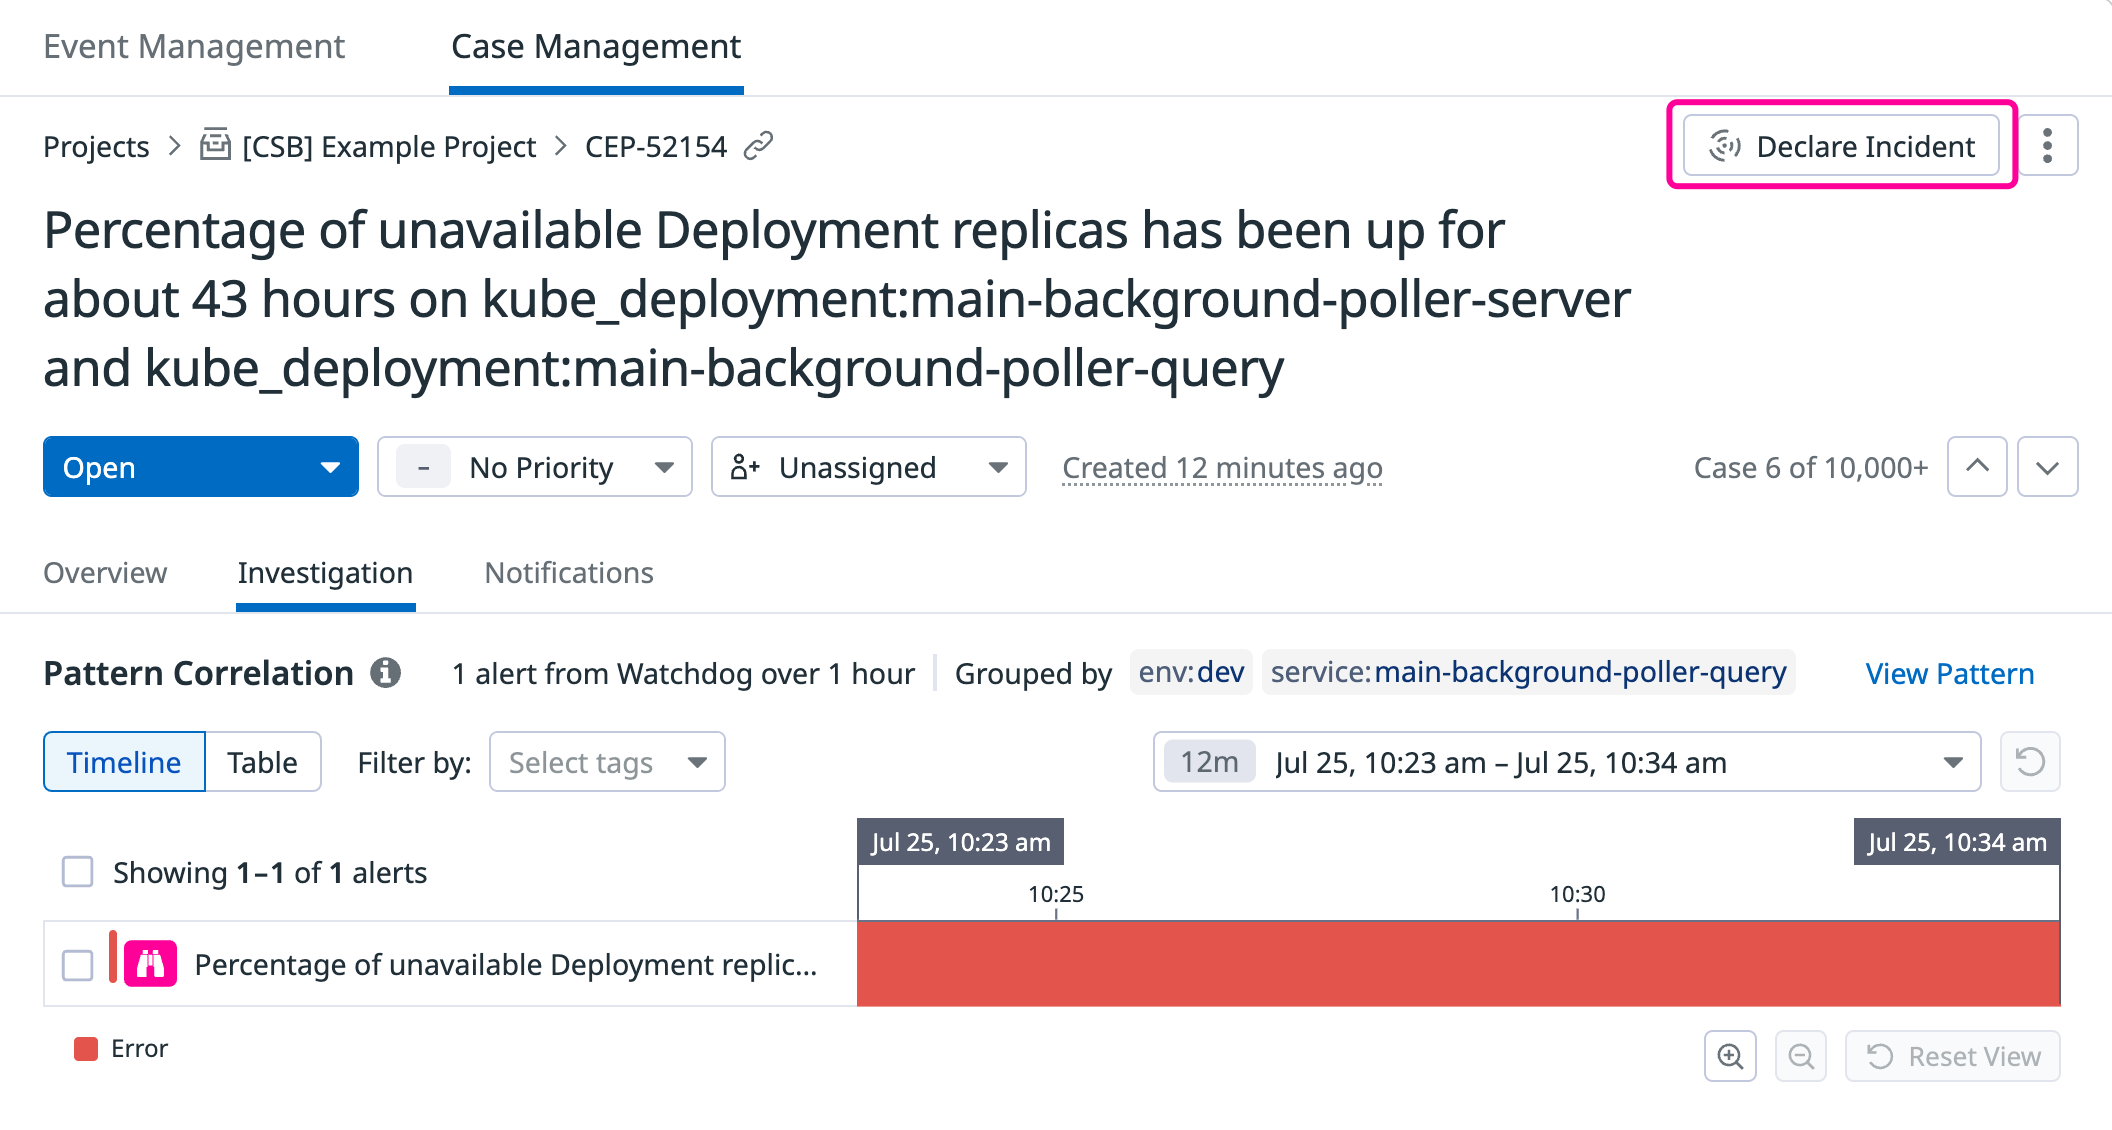
Declare an incident from Case Management. From the individual case detail page, click Declare incident to escalate a case to an incident.
From a graph
You can declare an incident directly from a graph by clicking the export button on the graph and then clicking Declare incident. The incident creation modal appears, and the graph is added to the incident as a signal.
From a Synthetic test
Create incidents directly from a Synthetic test through the Actions dropdown. Select Declare incident to open an incident creation modal, where a summary of the test is added to your incident timeline, allowing you to pursue the investigation from there.
From the Datadog Clipboard
Use the Datadog Clipboard to gather multiple monitors and graphs and to generate an incident. To declare an incident from the Clipboard, copy a graph you want to investigate and open the Clipboard with the command Cmd/Ctrl + Shift + K. Click Declare Incident or the export icon to add to the incident as a signal.
From Slack
If you have the Datadog integration enabled on Slack, you can declare a new incident with the slash command /datadog incident from any Slack channel.
If the user declaring the incident connected their Slack to their Datadog account, by default, that user is listed as the Incident Commander. The Incident Commander (IC) can be changed later in-app if necessary. If the user declaring an incident is not a member of a Datadog account, then the IC is assigned to a generic Slack app user and can be assigned to another IC in-app.
After you declare an incident from Slack, it generates an incident channel.
From Handoff Notifications
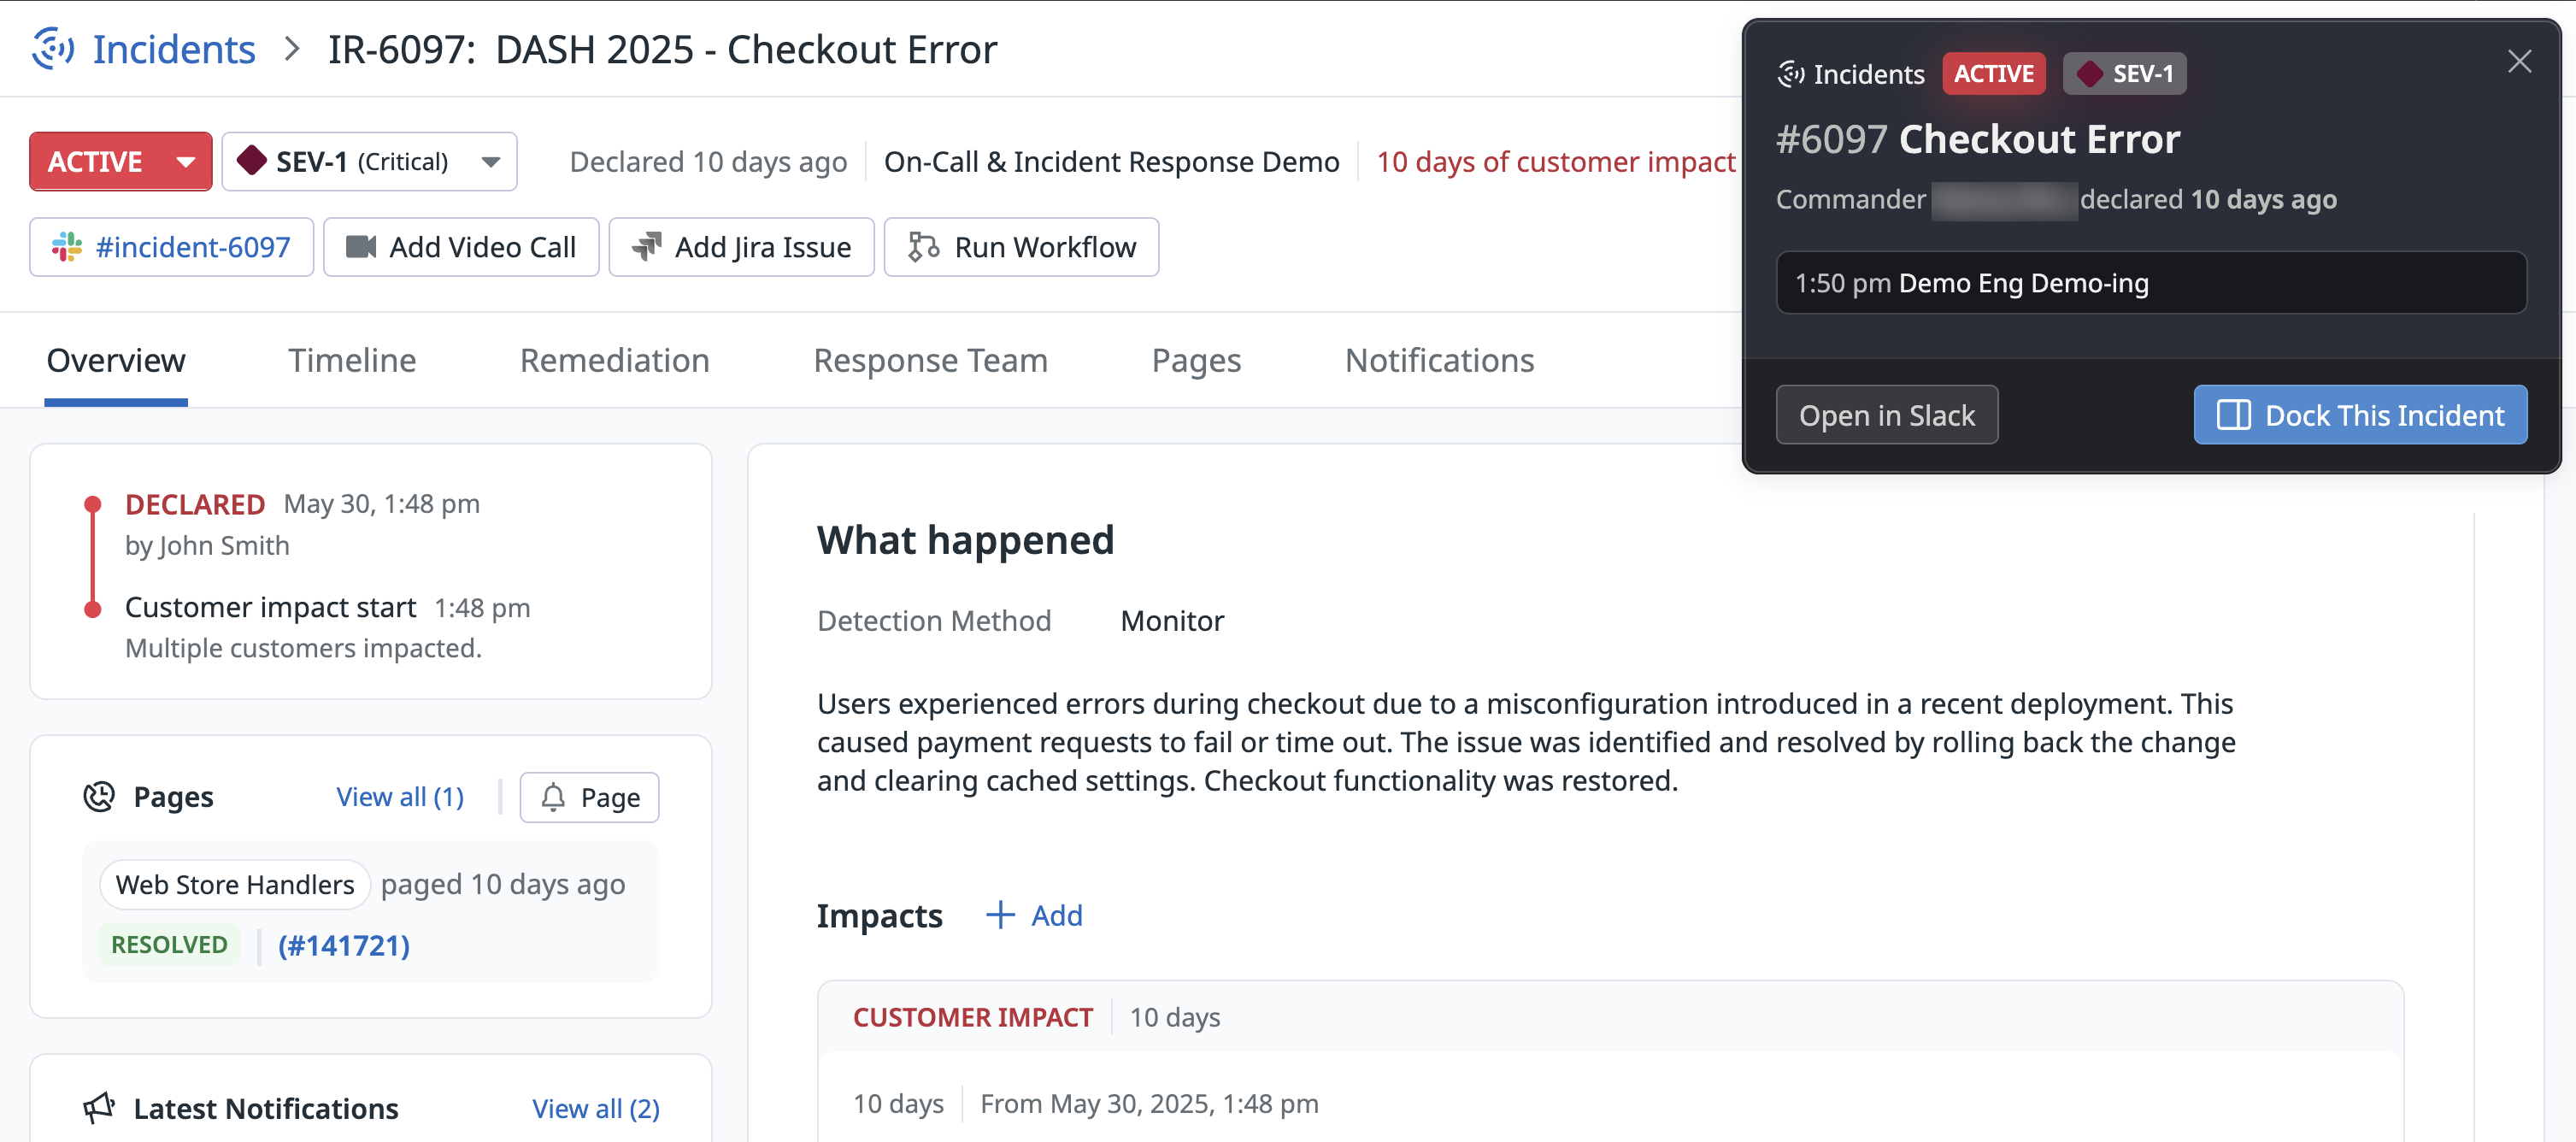
The Handoff Notification displays callout cards when you are paged or added to active incidents. These cards allow you to:
- View and acknowledge On-Call pages
- Navigate to relevant incident resources
- Preview Slack messages from incident channels
- Take direct actions on incidents
Handoff Notificiation cards remain visible until dismissed or until the incident status changes. You can expand, collapse, or dismiss the entire handoff container rather than individual cards.
You can declare an incident from individual Handoff Notification cards.
What’s next
Add helpful information to your incident and give context to everyone that is involved in the investigation.


