- Essentials
- Getting Started
- Agent
- API
- APM Tracing
- Containers
- Dashboards
- Database Monitoring
- Datadog
- Datadog Site
- DevSecOps
- Incident Management
- Integrations
- Internal Developer Portal
- Logs
- Monitors
- OpenTelemetry
- Profiler
- Session Replay
- Security
- Serverless for AWS Lambda
- Software Delivery
- Synthetic Monitoring and Testing
- Tags
- Workflow Automation
- Learning Center
- Support
- Glossary
- Standard Attributes
- Guides
- Agent
- Integrations
- Developers
- Authorization
- DogStatsD
- Custom Checks
- Integrations
- Create an Agent-based Integration
- Create an API Integration
- Create a Log Pipeline
- Integration Assets Reference
- Build a Marketplace Offering
- Create a Tile
- Create an Integration Dashboard
- Create a Monitor Template
- Create a Cloud SIEM Detection Rule
- OAuth for Integrations
- Install Agent Integration Developer Tool
- Service Checks
- IDE Plugins
- Community
- Guides
- OpenTelemetry
- Administrator's Guide
- API
- Partners
- Datadog Mobile App
- DDSQL Reference
- CoScreen
- CoTerm
- Cloudcraft (Standalone)
- In The App
- Dashboards
- Notebooks
- DDSQL Editor
- Reference Tables
- Sheets
- Monitors and Alerting
- Metrics
- Watchdog
- Bits AI
- Internal Developer Portal
- Error Tracking
- Change Tracking
- Service Management
- Actions & Remediations
- Infrastructure
- Cloudcraft
- Resource Catalog
- Universal Service Monitoring
- Hosts
- Containers
- Processes
- Serverless
- Network Monitoring
- Cloud Cost
- Application Performance
- APM
- APM Terms and Concepts
- Application Instrumentation
- APM Metrics Collection
- Trace Pipeline Configuration
- Correlate Traces with Other Telemetry
- Trace Explorer
- Recommendations
- Code Origins for Spans
- Service Observability
- Endpoint Observability
- Dynamic Instrumentation
- Live Debugger
- Error Tracking
- Data Security
- Guides
- Troubleshooting
- Continuous Profiler
- Database Monitoring
- Agent Integration Overhead
- Setup Architectures
- Setting Up Postgres
- Setting Up MySQL
- Setting Up SQL Server
- Setting Up Oracle
- Setting Up Amazon DocumentDB
- Setting Up MongoDB
- Connecting DBM and Traces
- Data Collected
- Exploring Database Hosts
- Exploring Query Metrics
- Exploring Query Samples
- Exploring Database Schemas
- Exploring Recommendations
- Troubleshooting
- Guides
- Data Streams Monitoring
- Data Jobs Monitoring
- Data Observability
- Digital Experience
- Real User Monitoring
- Synthetic Testing and Monitoring
- Continuous Testing
- Product Analytics
- Software Delivery
- CI Visibility
- CD Visibility
- Deployment Gates
- Test Optimization
- Quality Gates
- DORA Metrics
- Security
- Security Overview
- Cloud SIEM
- Code Security
- Cloud Security
- App and API Protection
- Workload Protection
- Sensitive Data Scanner
- AI Observability
- Log Management
- Observability Pipelines
- Log Management
- Administration
Incident Management Analytics
Overview
Use Incident Analytics to learn from past incidents and understand the efficiency and performance of your incident response process. Incident analytics allows you to pull aggregated statistics on your incidents over time. You can use these statistics to create reports that help you to:
- Analyze whether your incident response process is improving over time
- Assess your mean time to resolutions
- Identify areas of improvement that you should invest in
Data collected
Incident Management Analytics is a queryable data source for aggregated incident statistics. You can query these analytics in a variety of graph widgets in both Dashboards and Notebooks to analyze the history of your incident response over time. To give you a starting point, Datadog provides the following out-of-the-box resources that you can clone and customize:
Measures
Incident Management collects the following analytic measures to form analytic queries:
- Incident Count
- Customer Impact Duration
- Status Active Duration
- Status Stable Duration
- Time to Detect (detected time – customer impact start time)
- Time to Repair (customer impact end time – detected time)
- Time to Resolve (resolved time – declared time)
- Number of Users Impacted
- Acknowledge
In addition to these defaults, you can create new measures by adding custom Number property fields in your Incident Settings.
Note: If you override a timestamp, the override value will be used to calculate Time to Detect, Time to Repair, and Time to Resolve.
Visualize incident data in dashboards
To configure your graph using Incident Management Analytics data, follow these steps:
- Select your visualization.
- Select
Incidentsfrom the data source dropdown menu. - Select a measure from the yellow dropdown menu.
- Default Statistic: Counts the number of incidents.
- Select an aggregation for the measure.
- (Optional) Select a rollup for the measure.
- (Optional) Use the search bar to filter the statistic down to a specific subset of incidents.
- (Optional) Select a facet in the pink dropdown menu to break the measure up by group and select a limited number of groups to display.
- Title the graph.
- Save your widget.
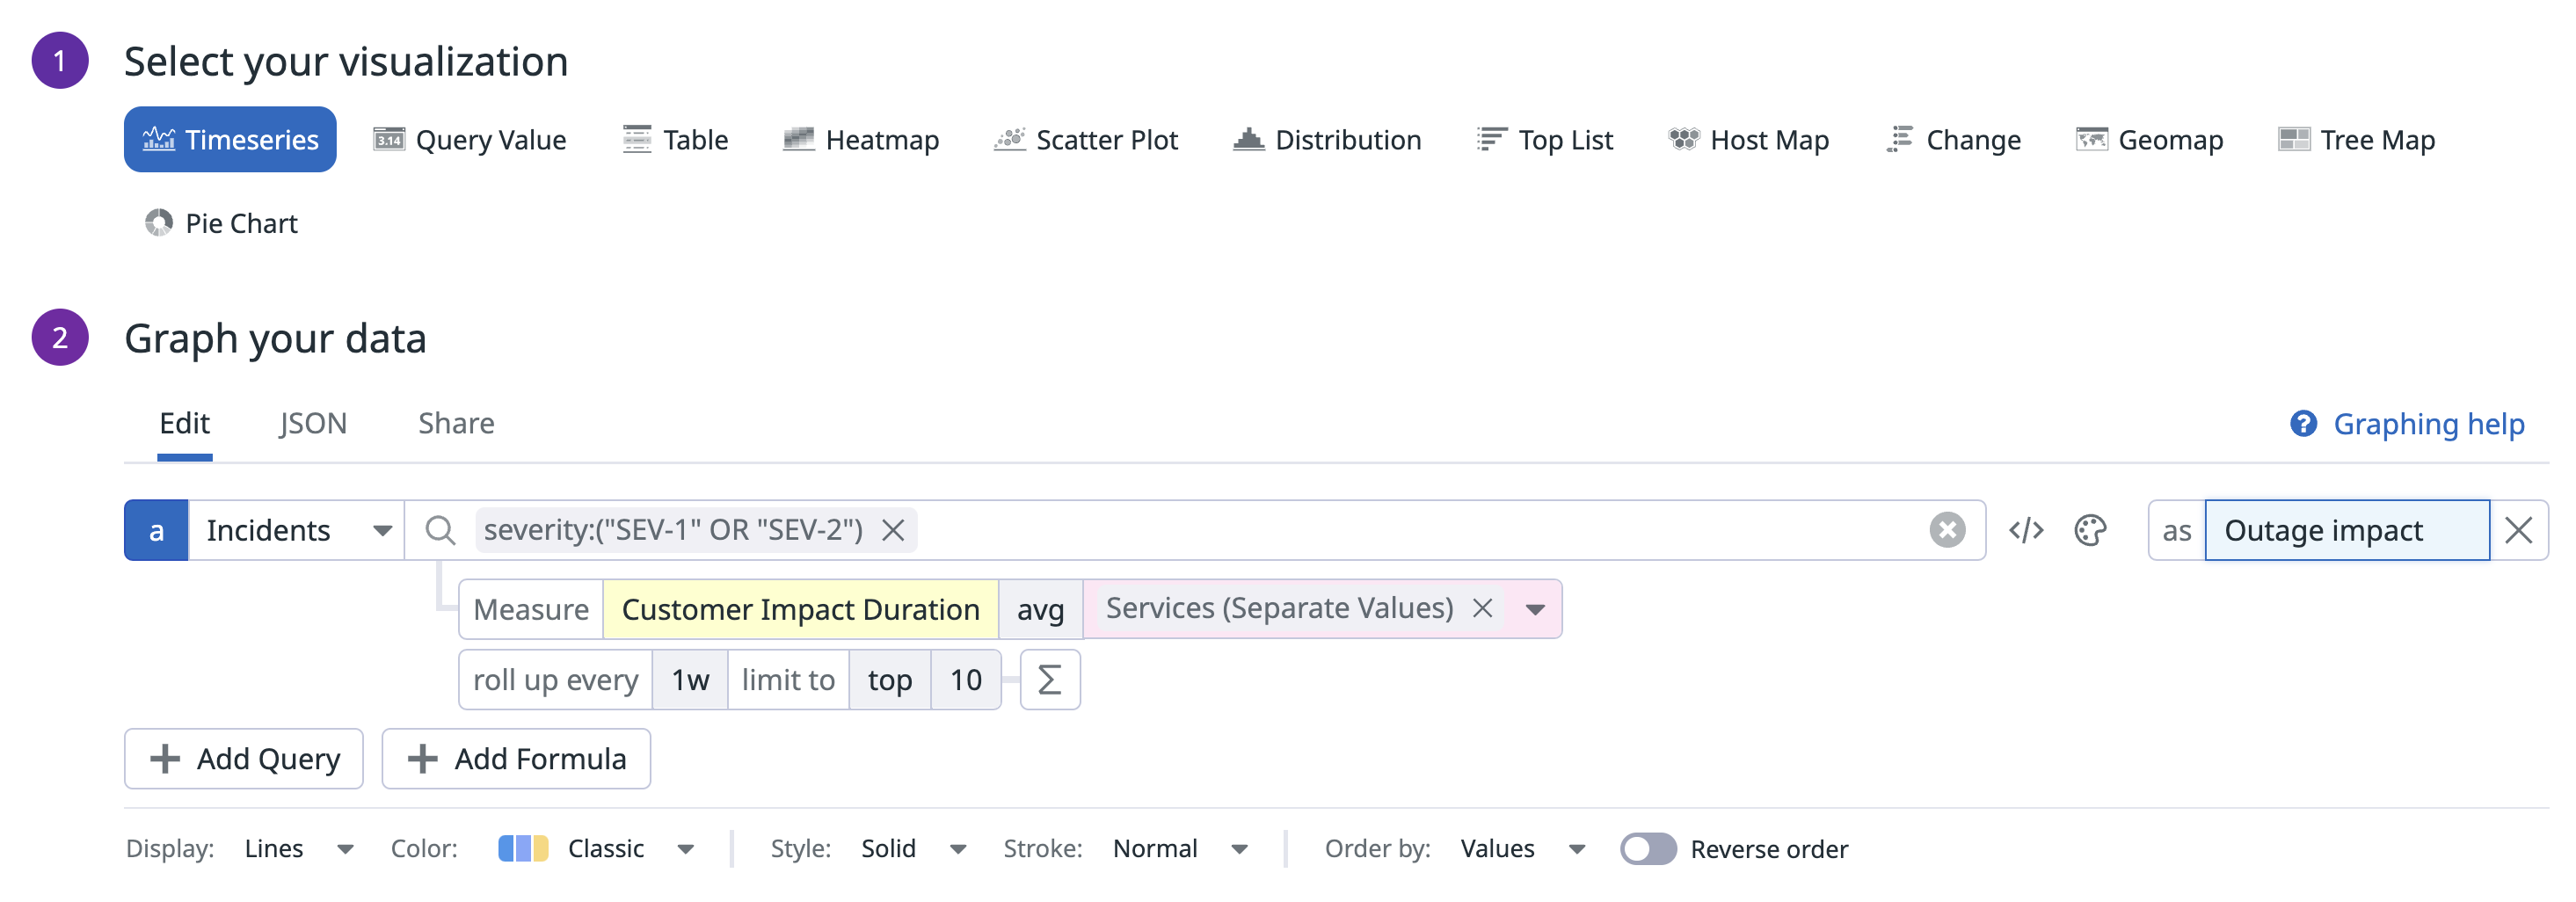
Example: Weekly outage customer impact duration grouped by service
This example configuration shows you an aggregation of your incidents that are SEV-1 or SEV-2. The graph displays the Customer Impact Duration of those incidents grouped by service.
- Widget: Timeseries Line Graph
- Datasource:
Incidents - Measure:
Customer Impact Duration - Aggregation:
avg - Rollup:
1w - Filter:
severity:("SEV-1" OR "SEV-2") - Group:
Services, limit to top 5
Incident report
Use the out-of-the-box Notebook template to create the Incident Report or build one from scratch to get a summary report of incidents in your team or service.
- Open the Incident Report template.
- Click Use Template to edit and customize.
- You can use the existing Incident cells or customize the query to display values for each measure.
- Update the summary cells with the relevant values and share the report with the rest of your team.
Further reading
Additional helpful documentation, links, and articles:

