- Agents
- Essentials
- Getting Started
- Agent
- API
- APM Tracing
- Containers
- Dashboards
- Database Monitoring
- Datadog
- Datadog Site
- DevSecOps
- Incident Management
- Integrations
- Internal Developer Portal
- Logs
- Monitors
- Notebooks
- OpenTelemetry
- Profiler
- Search
- Session Replay
- Security
- Serverless for AWS Lambda
- Software Delivery
- Synthetic Monitoring and Testing
- Tags
- Workflow Automation
- Learning Center
- Support
- Glossary
- Standard Attributes
- Guides
- Agent
- Integrations
- Extend Datadog
- Authorization
- DogStatsD
- Custom Checks
- Integrations
- Build an Integration with Datadog
- Create an Agent-based Integration
- Create an API-based Integration
- Create a Log Pipeline
- Integration Assets Reference
- Build a Marketplace Offering
- Create an Integration Dashboard
- Create a Monitor Template
- Create a Cloud SIEM Detection Rule
- Install Agent Integration Developer Tool
- Service Checks
- Community
- Guides
- OpenTelemetry
- Administrator's Guide
- API
- Partners
- Datadog Mobile App
- DDSQL Reference
- CoScreen
- CoTerm
- Remote Configuration
- Cloudcraft (Standalone)
- In The App
- Dashboards
- Notebooks
- DDSQL Editor
- Reference Tables
- Sheets
- Monitors and Alerting
- Service Level Objectives
- Metrics
- Watchdog
- Bits AI
- Internal Developer Portal
- Error Tracking
- Change Tracking
- Event Management
- Incident Response
- Actions & Remediations
- Infrastructure
- Cloudcraft
- Resource Catalog
- Universal Service Monitoring
- End User Device Monitoring
- Hosts
- Containers
- Processes
- Serverless
- Network Monitoring
- Storage Management
- Cloud Cost
- Application Performance
- APM
- Continuous Profiler
- Database Monitoring
- Agent Integration Overhead
- Setup Architectures
- Setting Up Postgres
- Setting Up MySQL
- Setting Up SQL Server
- Setting Up Oracle
- Setting Up Amazon DocumentDB
- Setting Up MongoDB
- Setting Up ClickHouse
- Connecting DBM and Traces
- Data Collected
- Exploring Database Hosts
- Exploring Query Metrics
- Exploring Query Samples
- Exploring Database Schemas
- Exploring Recommendations
- Troubleshooting
- Guides
- Data Streams Monitoring
- Data Observability
- Digital Experience
- Real User Monitoring
- Synthetic Testing and Monitoring
- Continuous Testing
- Experiments
- Product Analytics
- Session Replay
- Software Delivery
- CI Visibility
- CD Visibility
- Deployment Gates
- Test Optimization
- Code Coverage
- PR Gates
- DORA Metrics
- Feature Flags
- Developer Integrations
- Security
- Security Overview
- Cloud SIEM
- Code Security
- Cloud Security
- App and API Protection
- AI Guard
- Workload Protection
- Sensitive Data Scanner
- AI Observability
- Log Management
- Observability Pipelines
- Configuration
- Sources
- Processors
- Destinations
- Amazon OpenSearch
- Amazon S3
- Amazon Security Lake
- Azure Storage
- CrowdStrike NG-SIEM
- Datadog Archives
- Datadog CloudPrem
- Datadog Logs
- Datadog Metrics
- Elasticsearch
- Google Cloud Storage
- Google Pub/Sub
- Google SecOps
- HTTP Client
- Kafka
- Microsoft Sentinel
- New Relic
- OpenSearch
- SentinelOne
- Socket
- Splunk HEC
- Sumo Logic Hosted Collector
- Syslog
- Packs
- Akamai CDN
- Amazon CloudFront
- Amazon VPC Flow Logs
- AWS Application Load Balancer Logs
- AWS CloudTrail
- AWS Elastic Load Balancer Logs
- AWS Network Load Balancer Logs
- Cisco ASA
- Cloudflare
- F5
- Fastly
- Fortinet Firewall
- HAProxy Ingress
- Istio Proxy
- Juniper SRX Firewall Traffic Logs
- Netskope
- NGINX
- Okta
- Palo Alto Firewall
- Windows XML
- ZScaler ZIA DNS
- Zscaler ZIA Firewall
- Zscaler ZIA Tunnel
- Zscaler ZIA Web Logs
- Search Syntax
- Scaling and Performance
- Monitoring and Troubleshooting
- Guides and Resources
- Log Management
- CloudPrem
- Administration
Heatmaps
A heatmap (or heat map) is a visualization of your user’s interactions overlaid on Session Replay data. There are three different types of heatmaps:
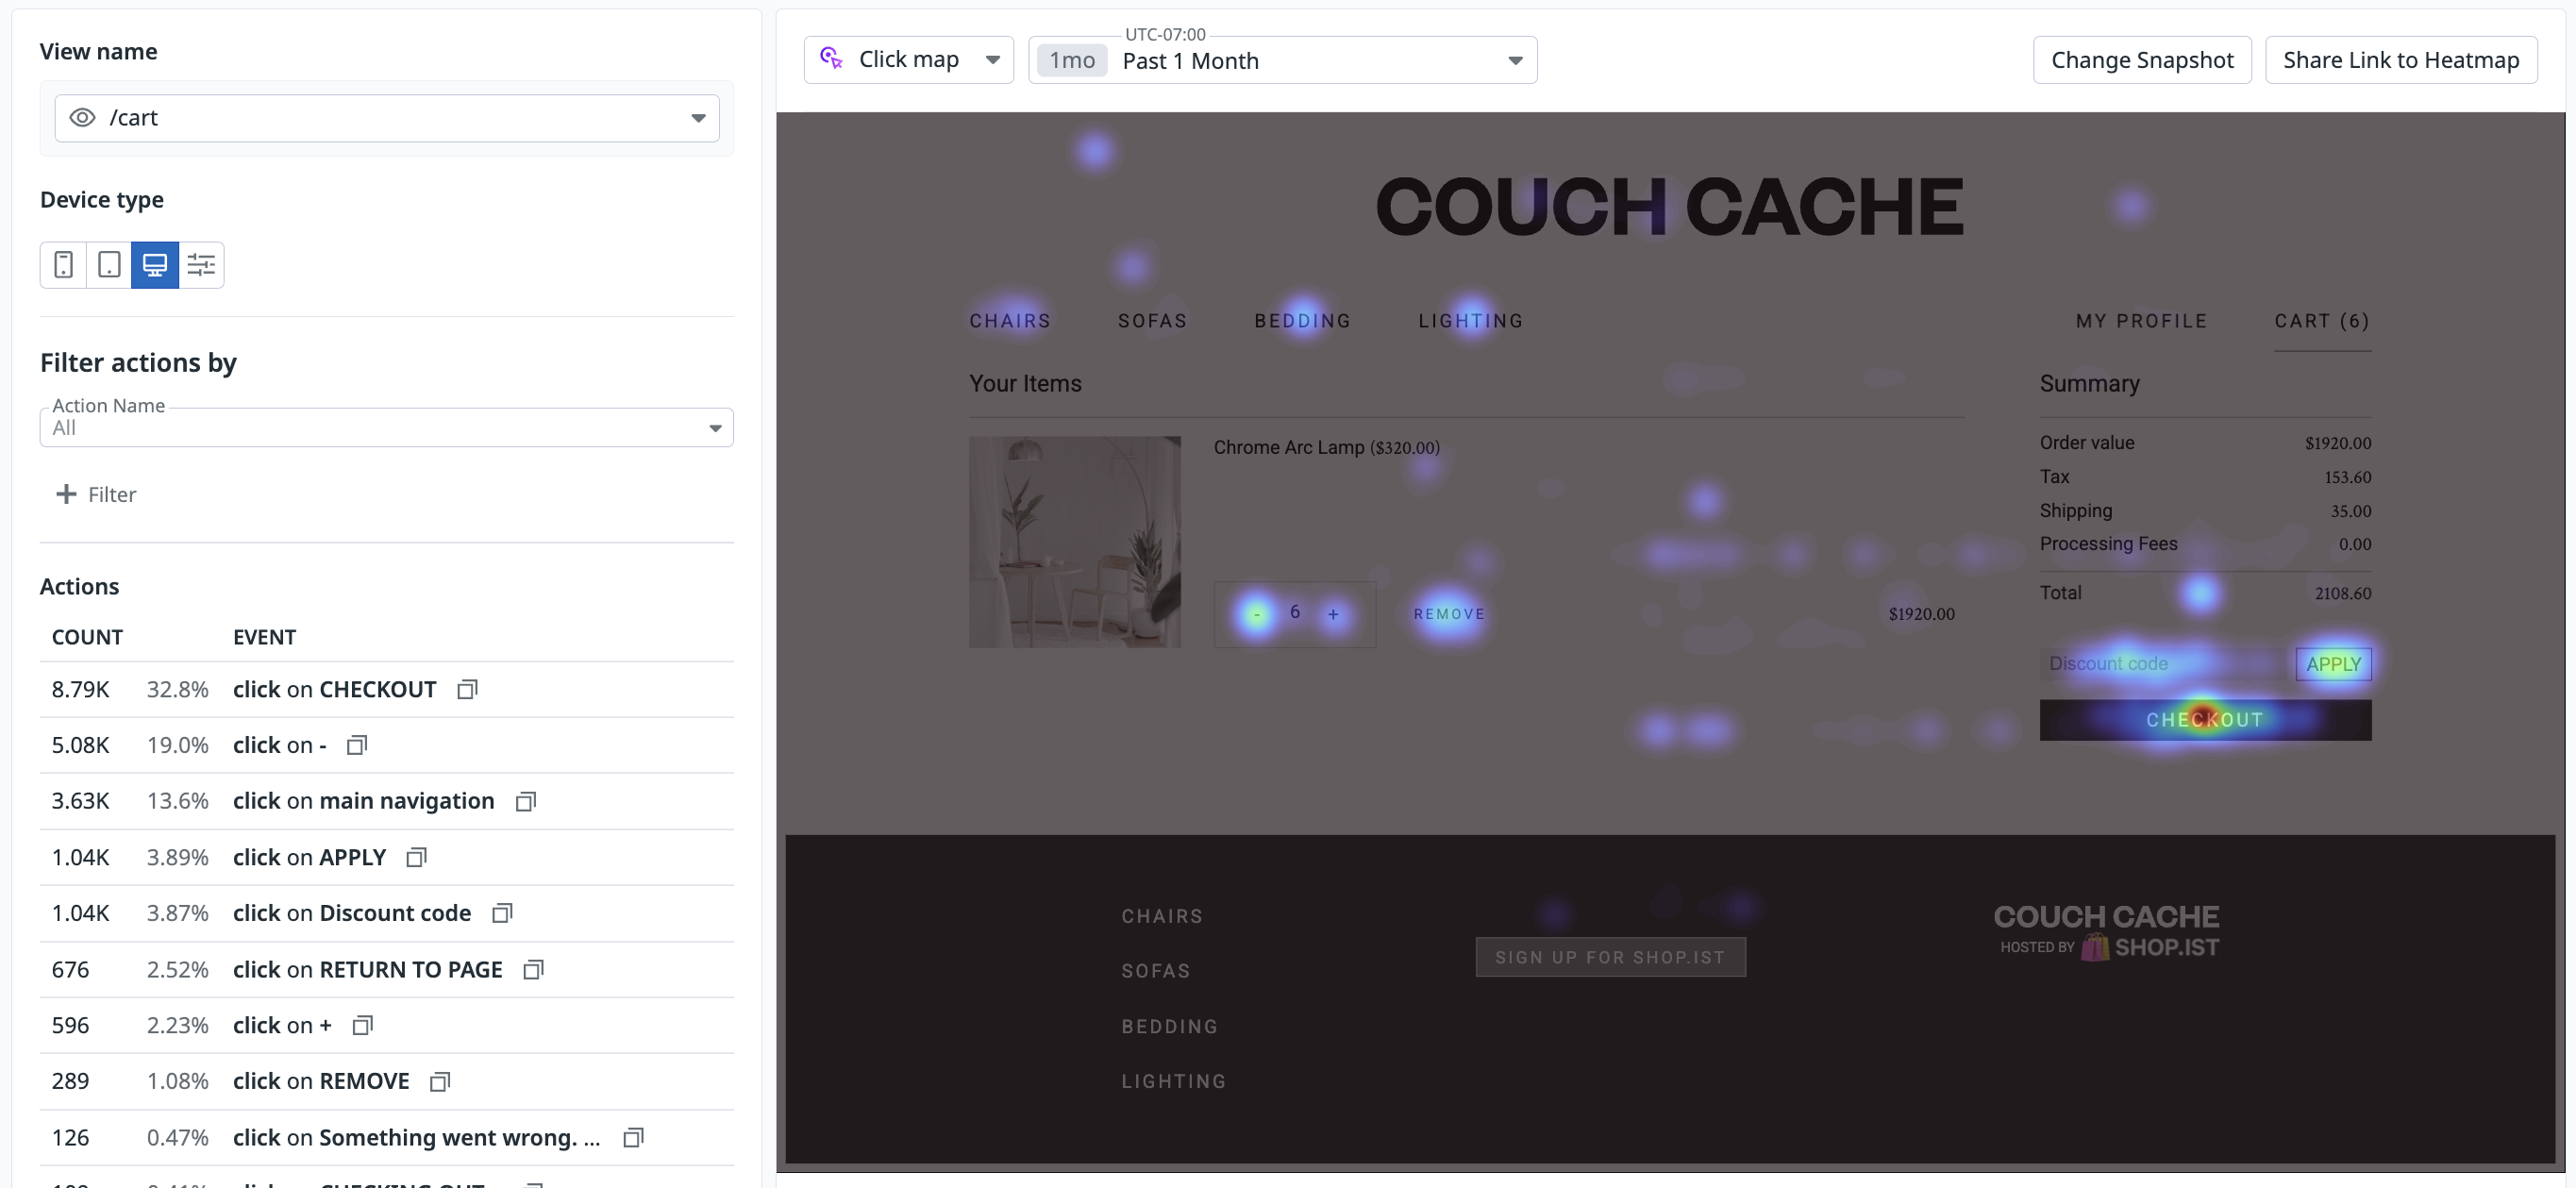
- Click maps: View user interactions (clicks) to understand how users engage with your page.
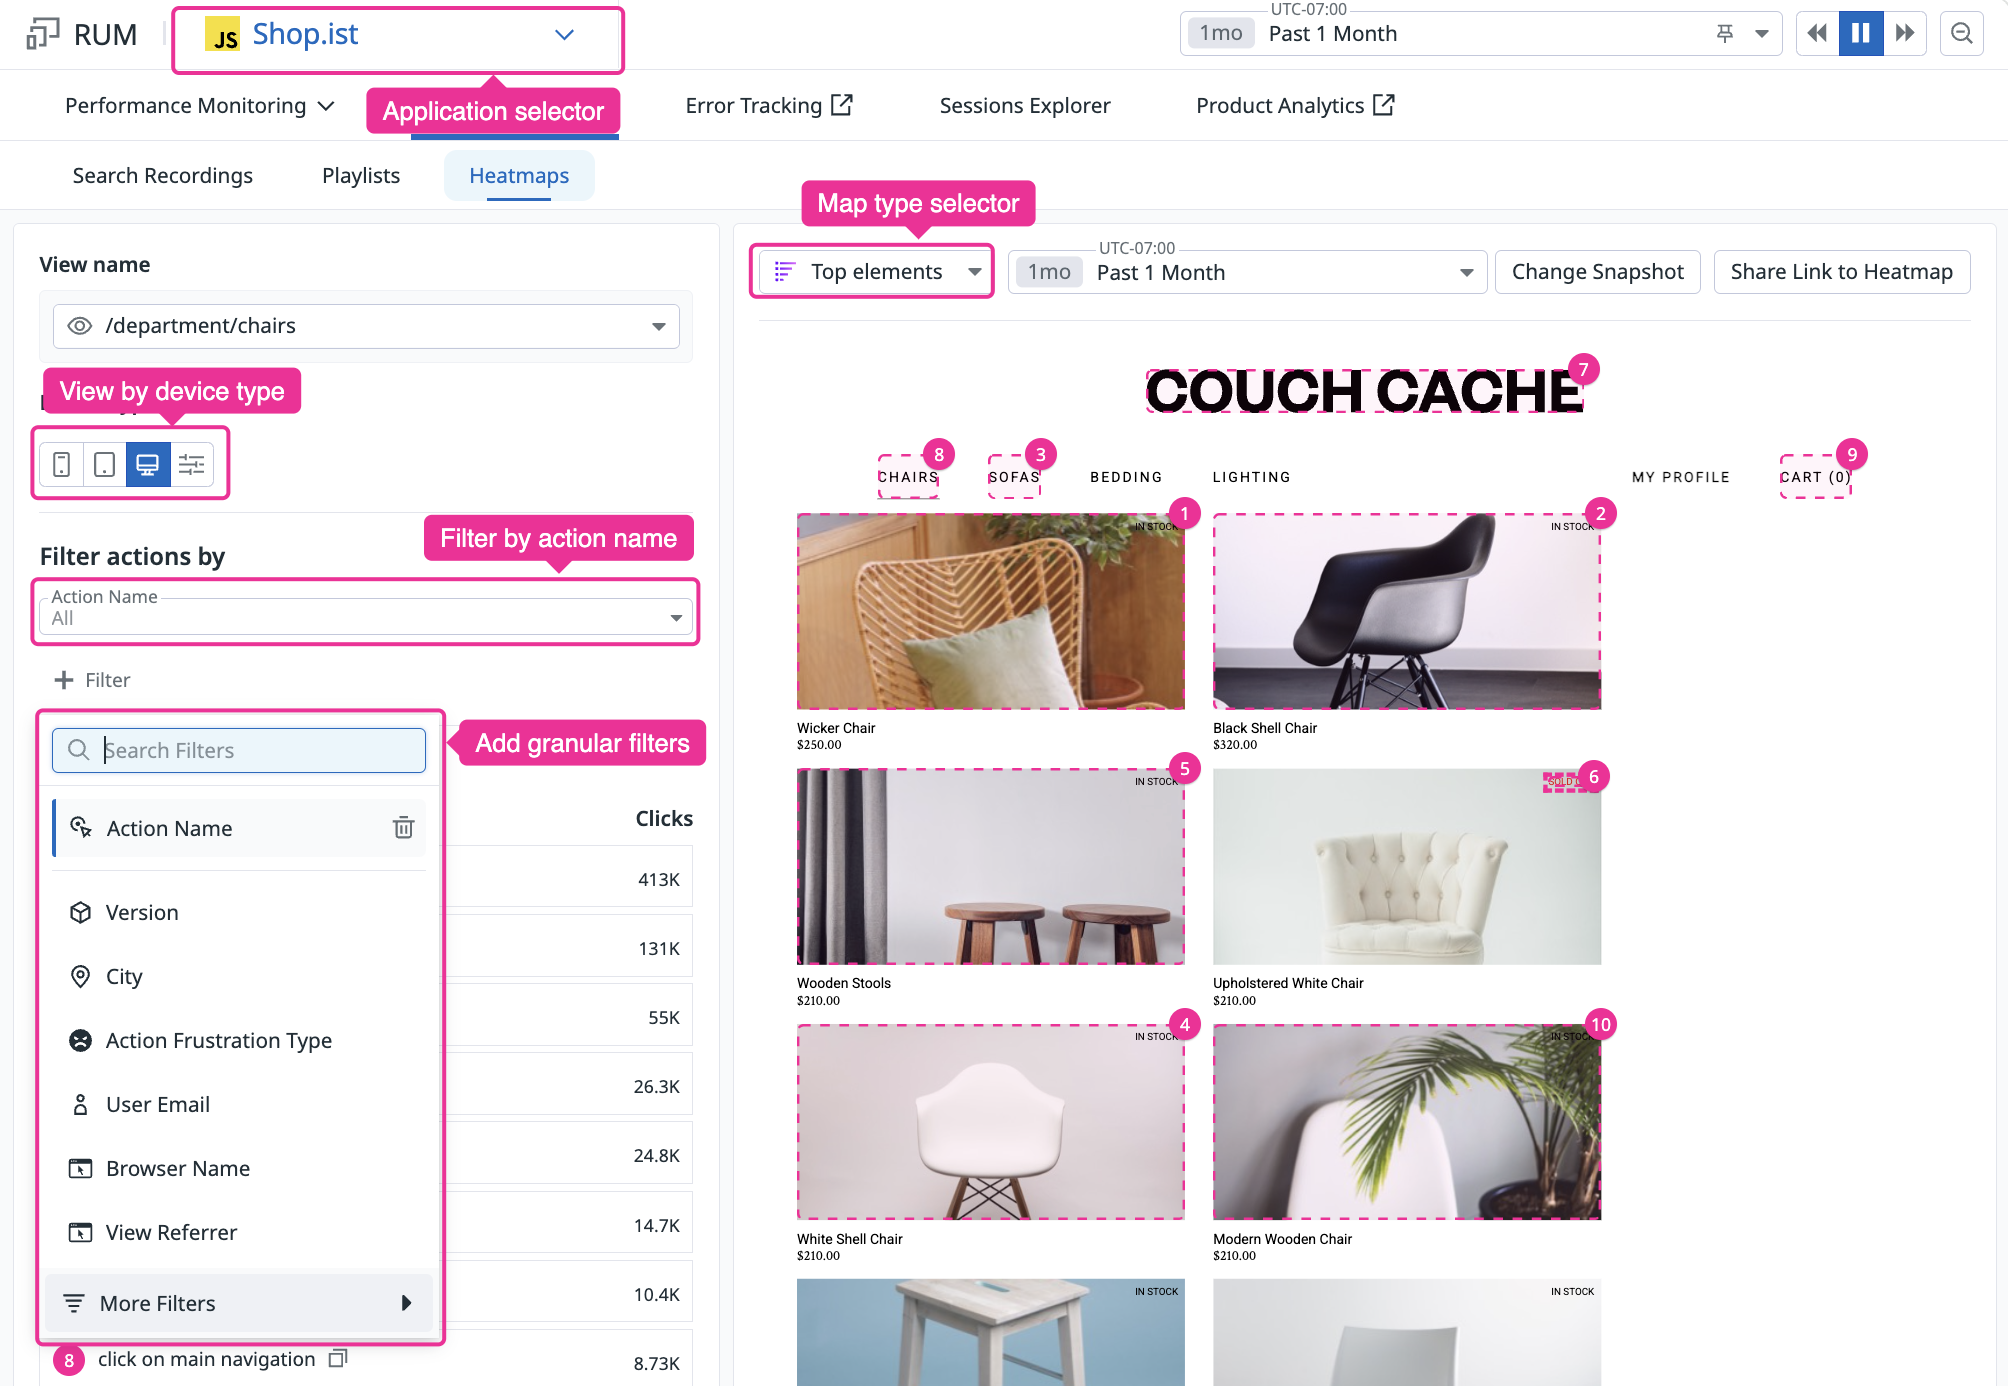
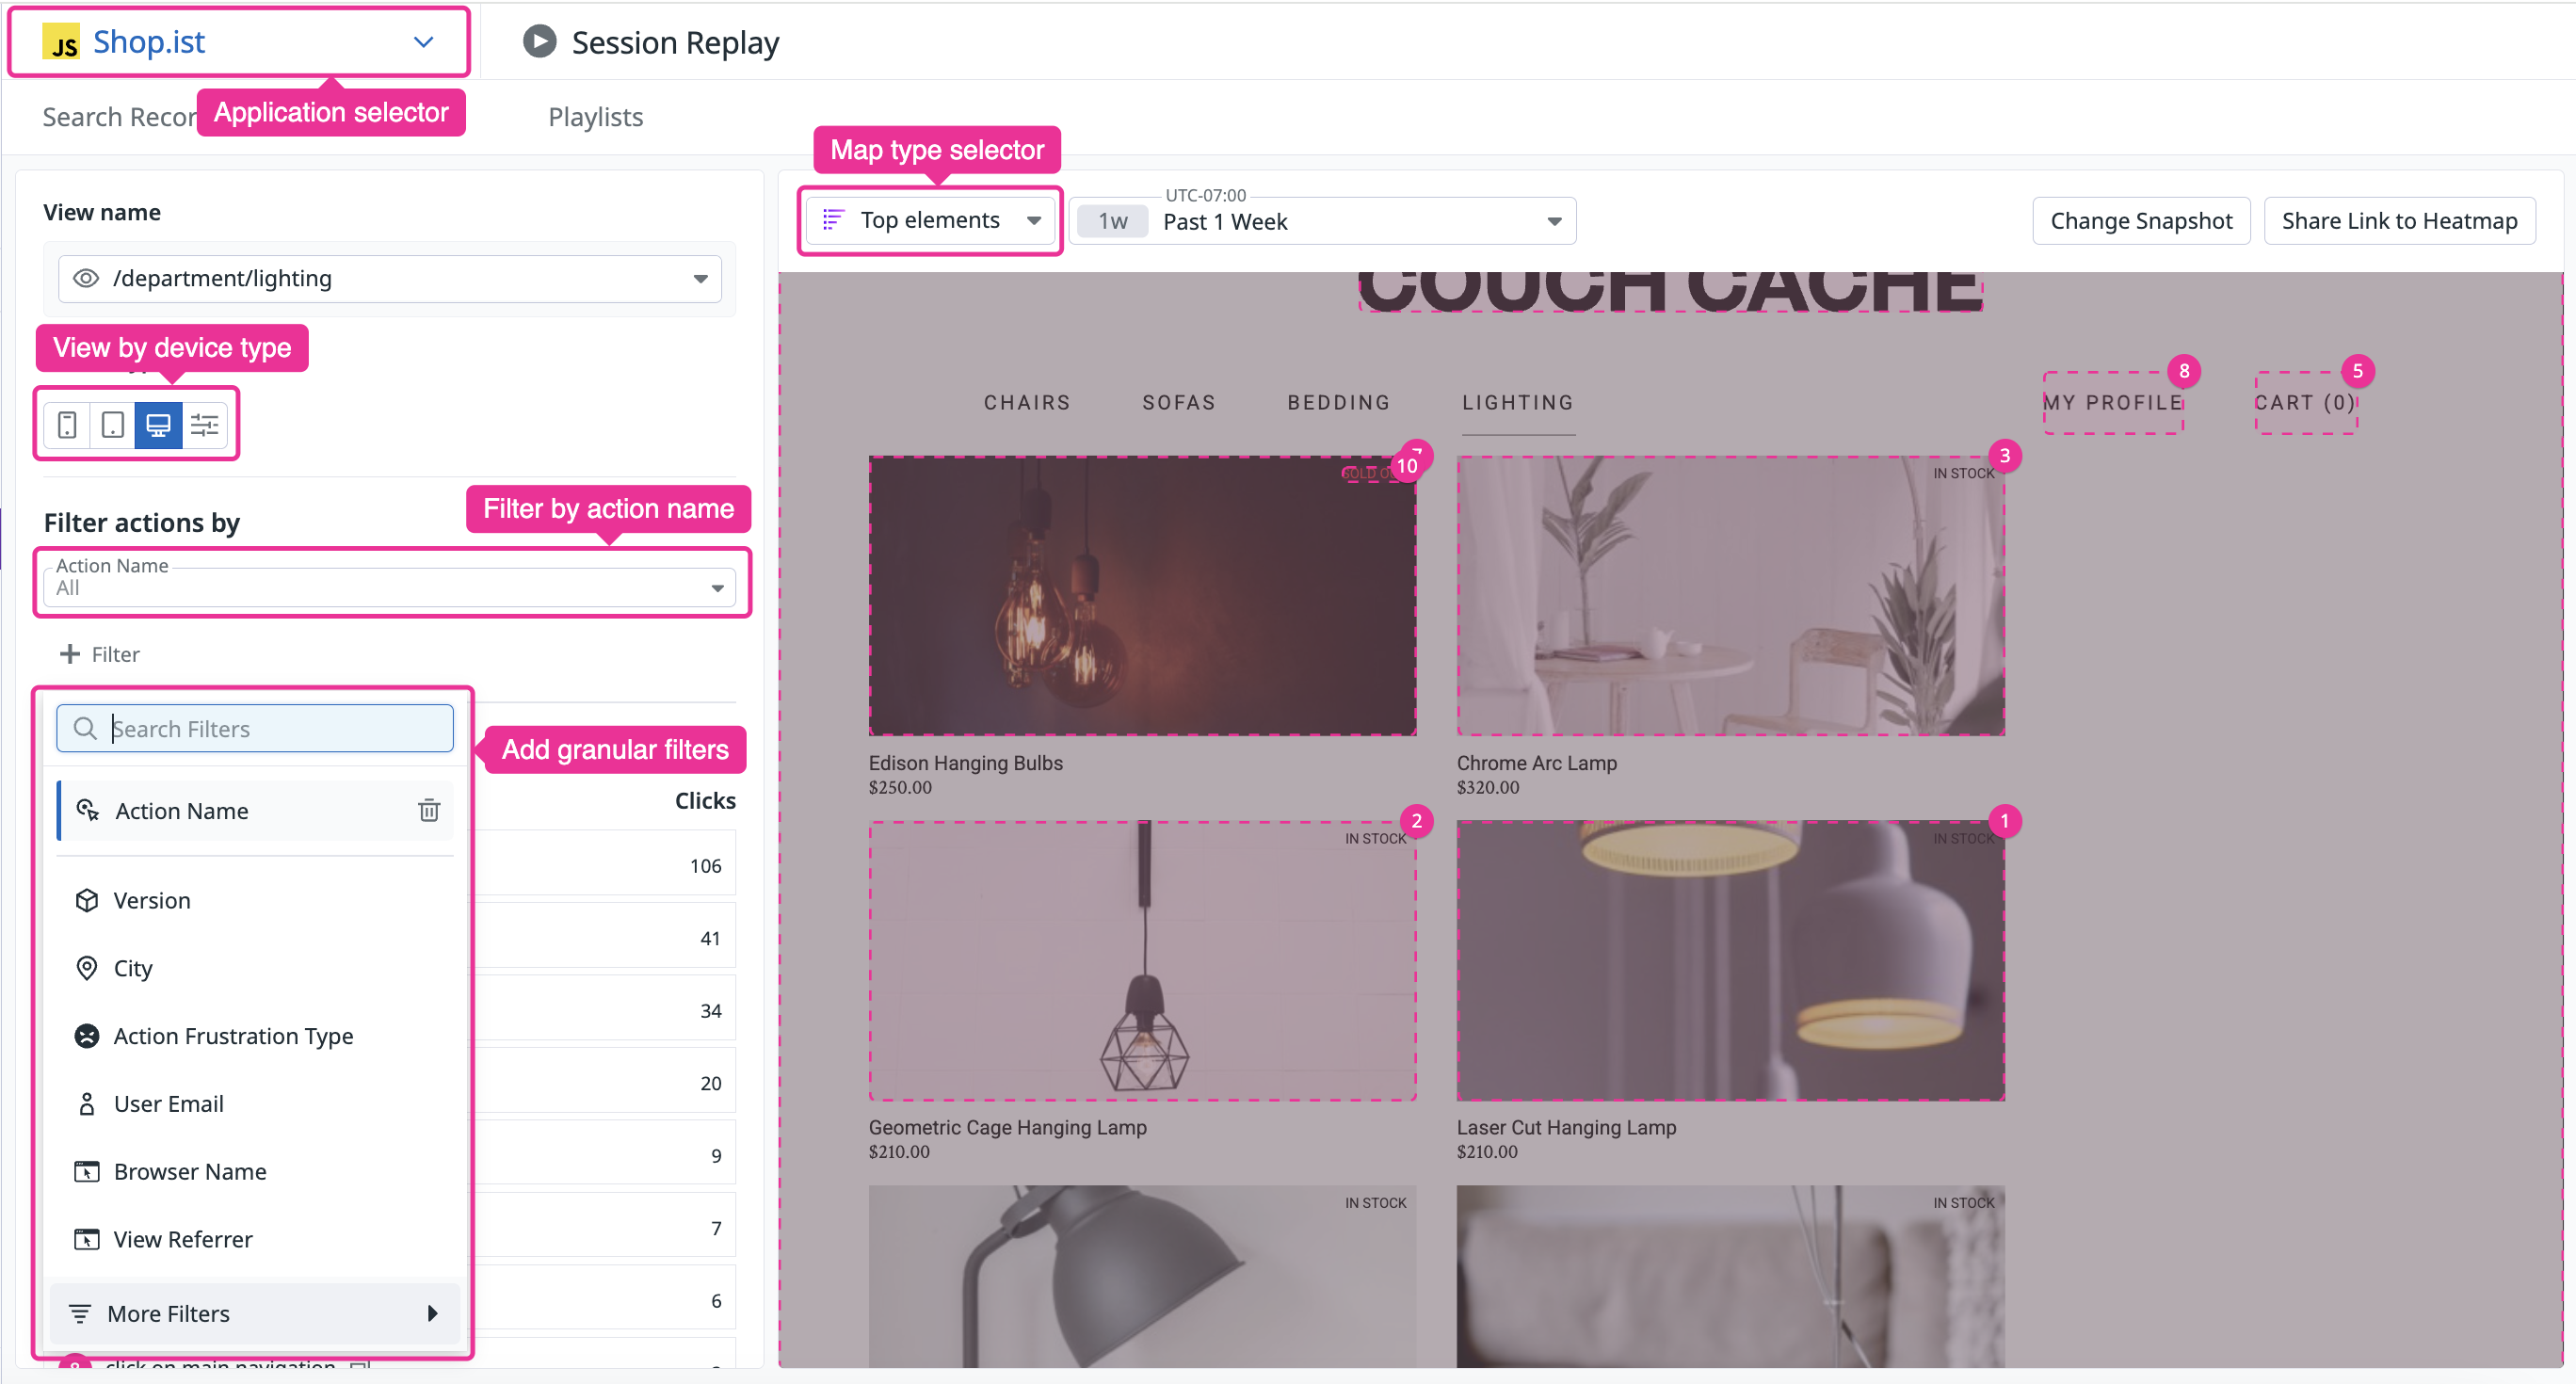
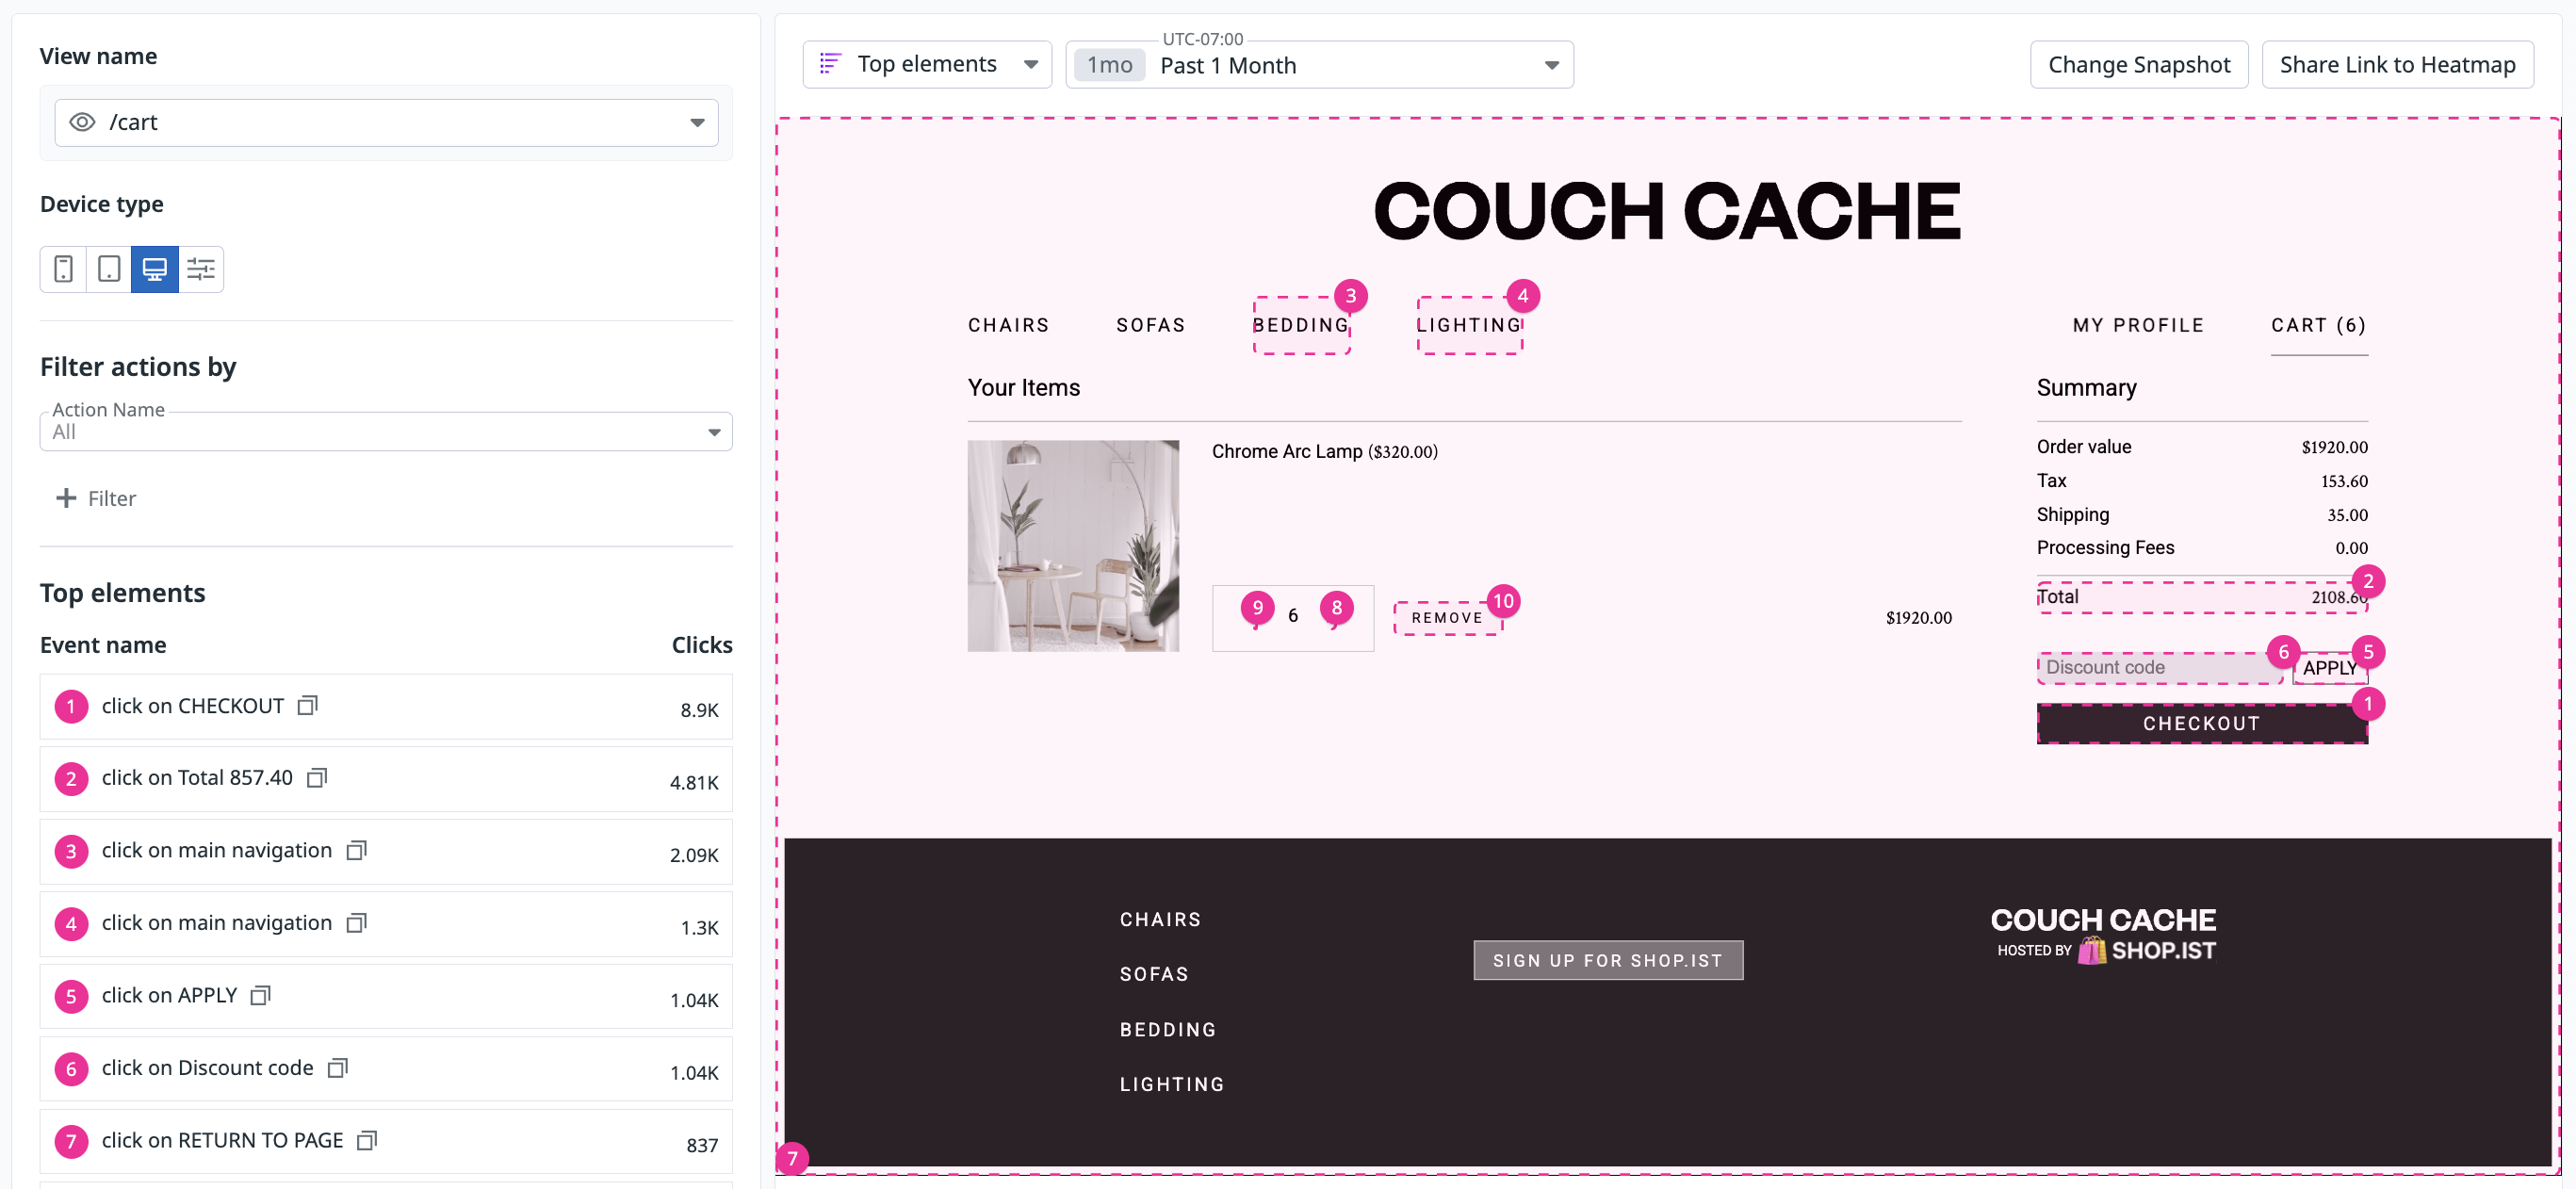
- Top Elements: View a ranking of up to the top 10 most interacted-with elements on a given page.
- Scroll maps: View how far users scroll down a page, including where the average fold of a page falls. The average fold is the lowest point on a page that a user can see on their device without scrolling.
Use heatmaps to review complex data at a glance and gain insights around optimizing your user experience.
Prerequisites
To get started with heatmaps:
- Verify your SDK version:
- For Click maps, you must be on the latest version of the SDK (v4.40.0 or later).
- For Scroll maps, you must be on (v4.50.0 or later).
- Enable Session Replay.
- Set
trackUserInteractions: truein the SDK initialization to enable action tracking (required for Clickmaps).
Getting started
Navigate to Digital Experience > Real User Monitoring > Session Replay > Heatmaps. Select your application and view.
On the Real User Monitoring landing page, select your application from the application selector and view. To the left of the timeframe selector, you can select the type of heatmap you would like to view: Top elements, Click map, or Scroll map.
Navigate to Digital Experience > Product Analytics > Heatmaps. Select your application and view.
From this page, you can select the type of heatmap (Top elements, Click map, Scroll map) you would like to see for a particular view.
Click on a view name for a more detailed look at the related heatmap.
You have the following additional view options:
- To switch the view being shown, use the View Name and Application selectors at the top.
- To change the device view, use the Device type selector.
- To filter by action name, use the Filter actions by dropdown.
- To add more granular filters, like a specific geography for example, click the Add Filter button.
Top Elements
Top Elements heatmaps aggregate click actions on a given view by displaying the elements that are most interacted with, in addition to their interaction rank. The ranking on the map itself corresponds to the action name on the side.
Hover over any action name in the panel to highlight the corresponding action on the map.
Click maps
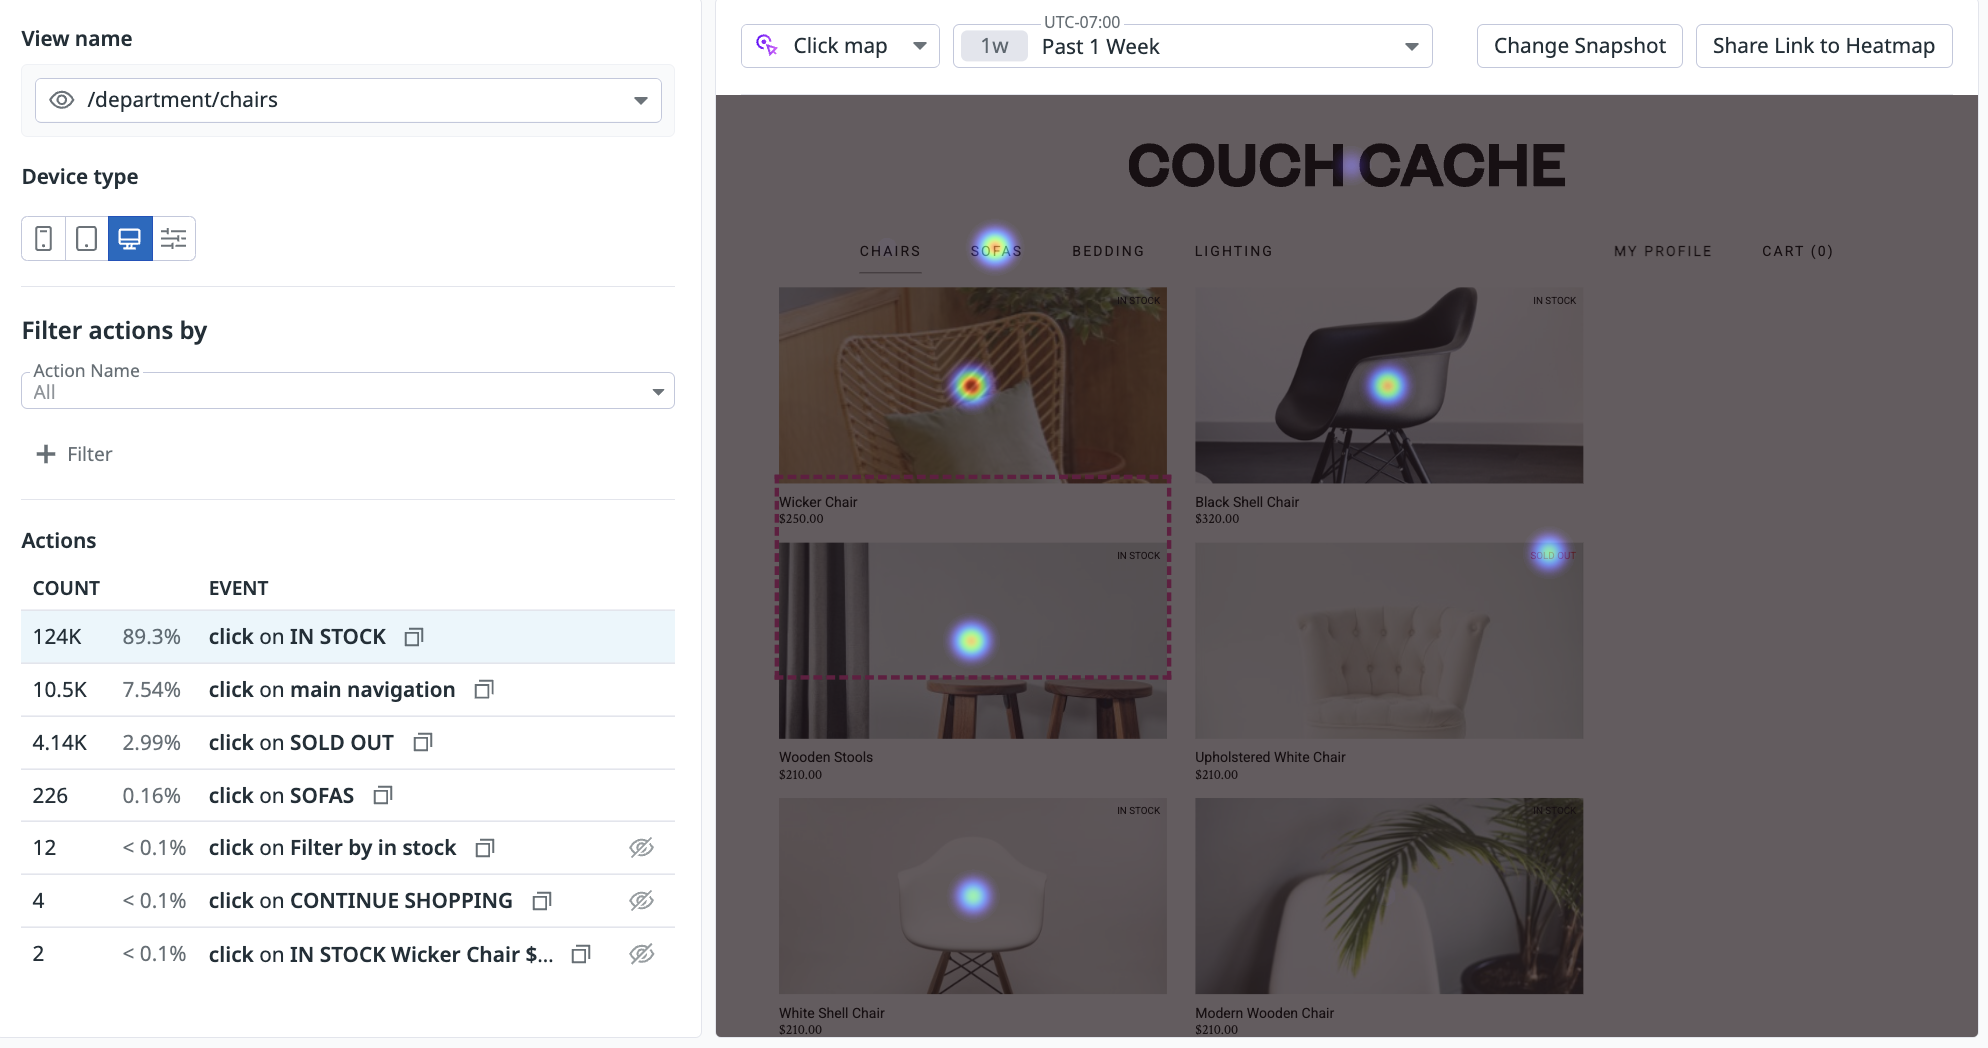
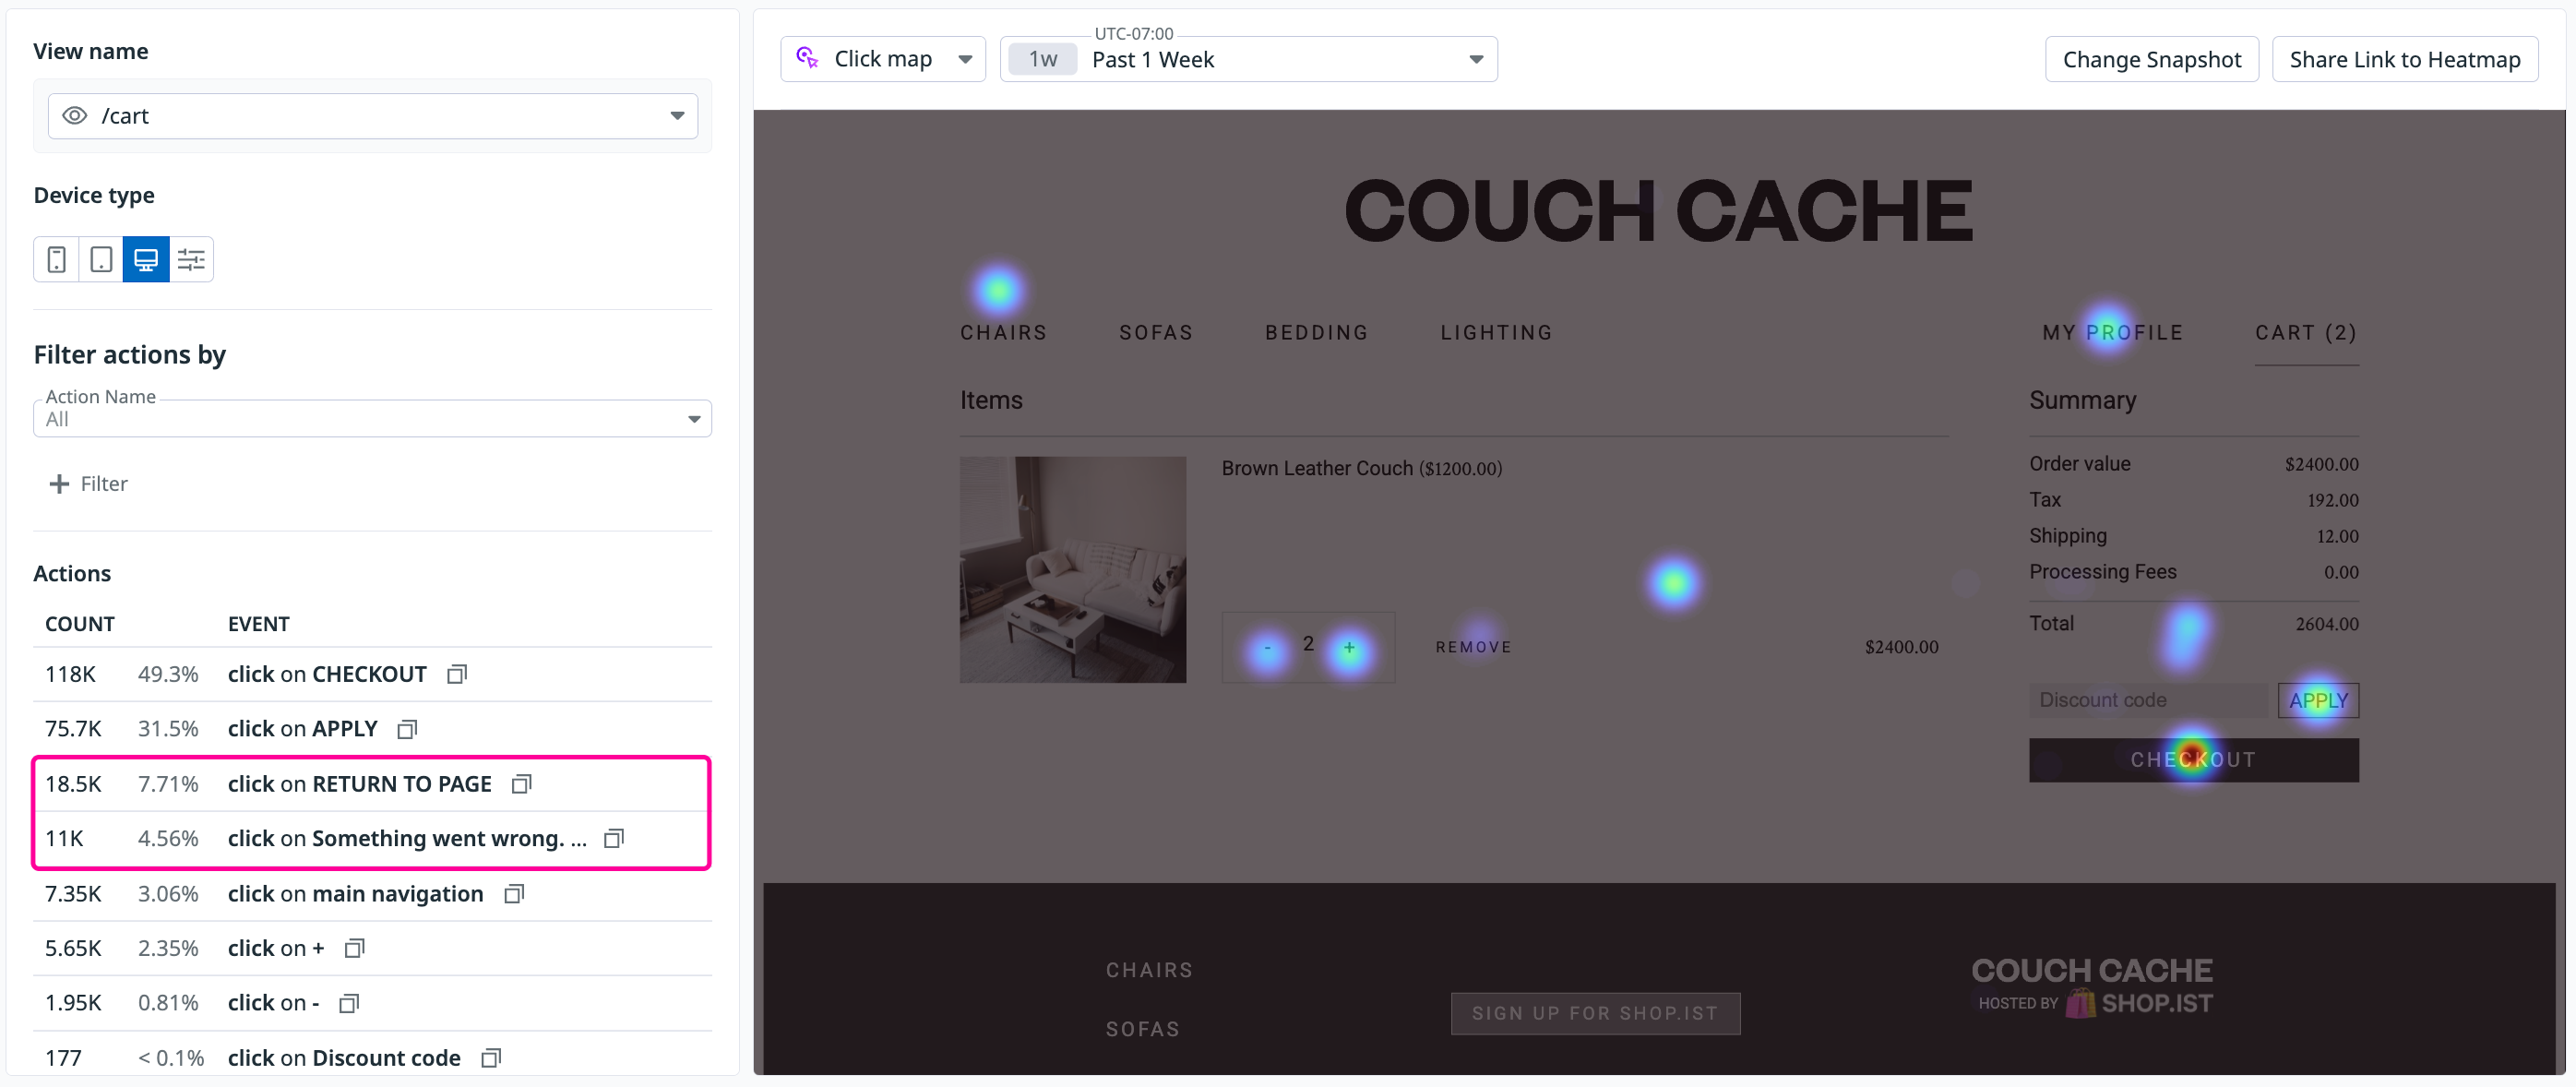
A Click map shows you the actions most interacted with on a given view by aggregating user click actions from sessions and visualizing them as blobs on the map.
On the left is a list of all actions that occurred on the page, listed by frequency. When you click into an action, you can understand more about that interaction, for example:
- The number of times the user performed the action and where it falls in overall analytics of top actions on a given page.
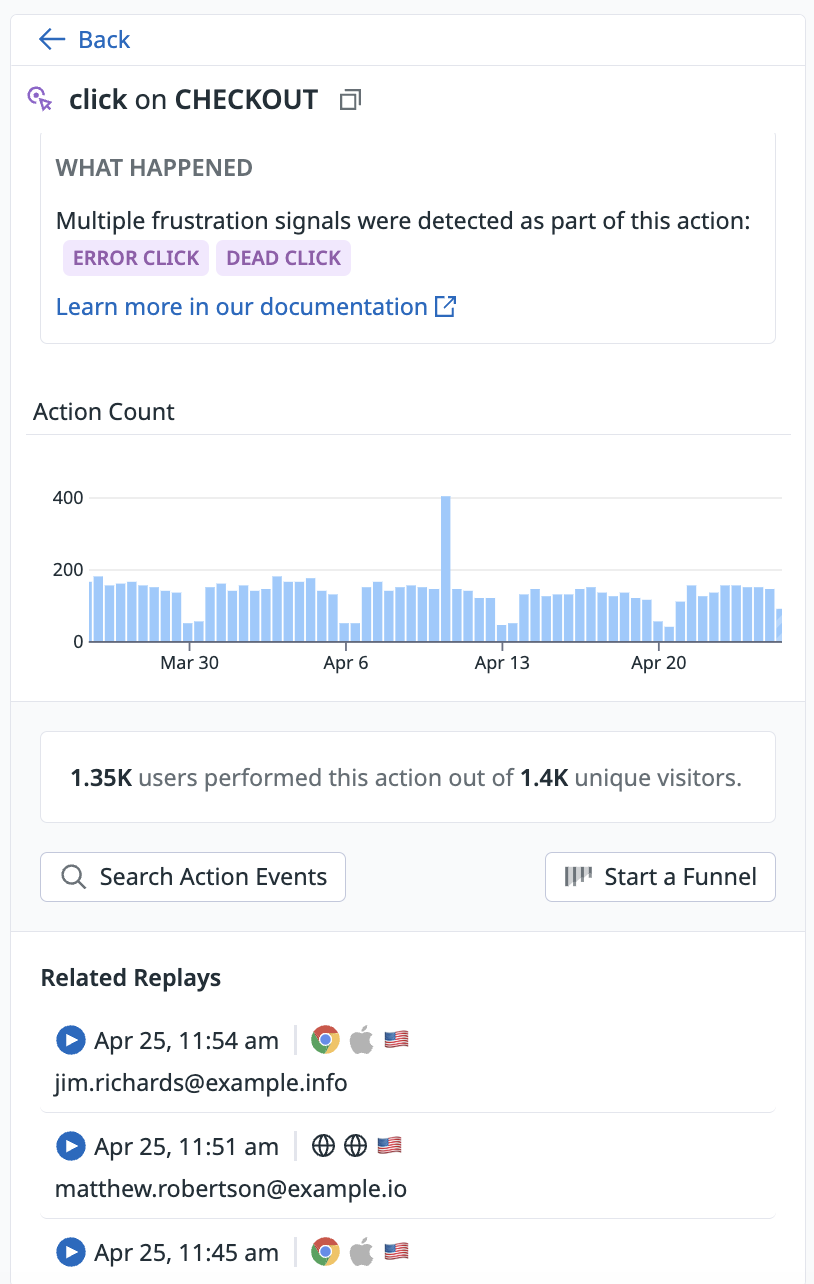
- If that action had a frustration signal occurring on it (for example, if a user rage clicked on that button), you can view the associated frustration signals as well.
From this view, you can also click the Start a Funnel button to identify user drop off.
Scroll maps
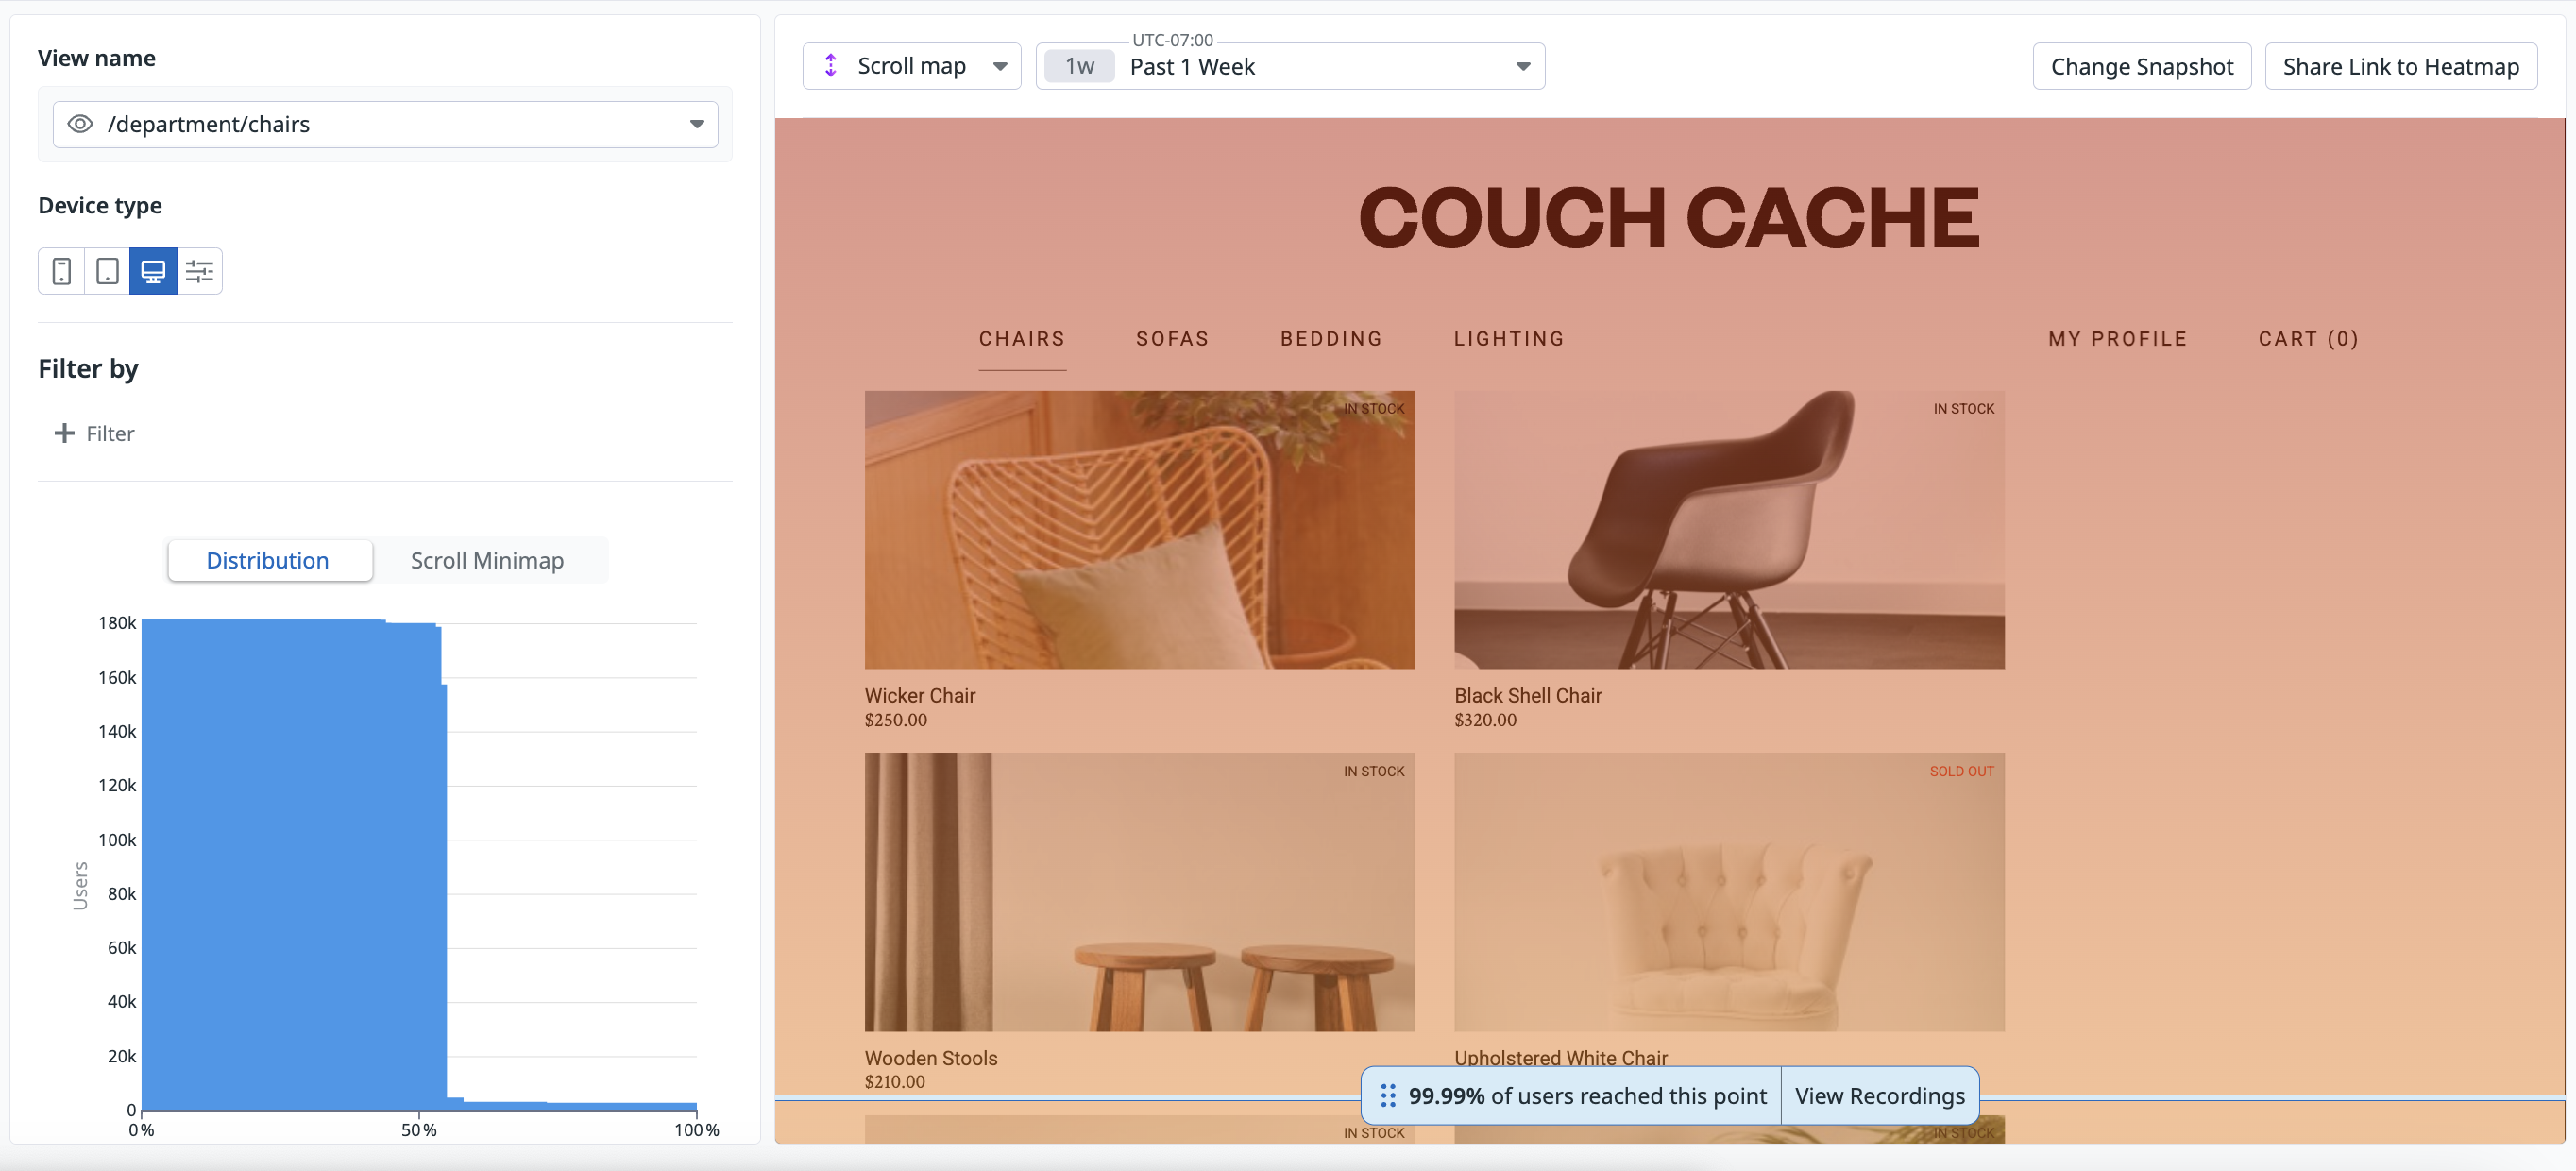
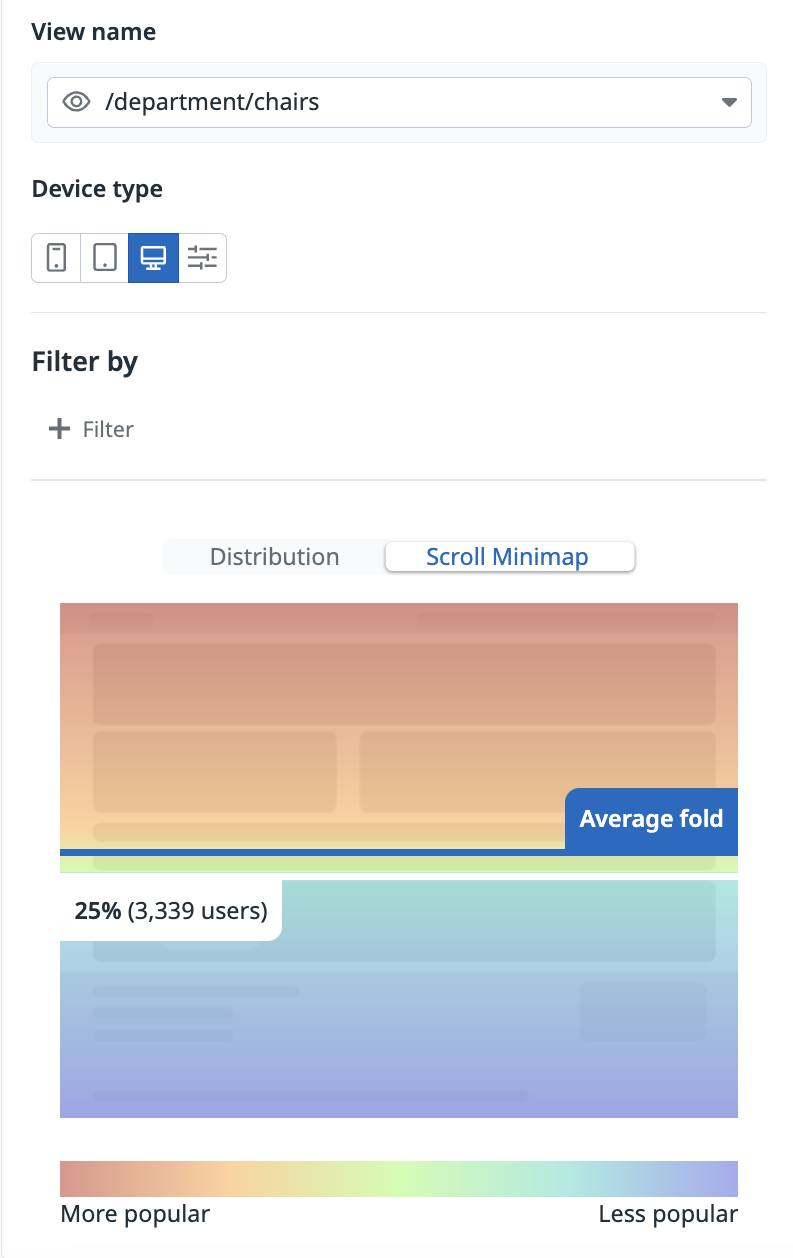
Scroll maps display the aggregate scroll activity on a given page. Use Scroll maps to see where the average fold of the page falls, and how many users scroll to a given depth. You can drag the floating blue bar on a Scroll map to the depth you wish to assess.
The panel to the left of the Scroll map provides high-level insights with direct links to query results, such as a link to a list of views where the user scrolled past a given percentile. Below the insight panel is a minimap of the page and a distribution graph displaying granular scroll data, useful for identifying where the biggest drop-off occurs.
Screenshots
A screenshot is the state of a view at a particular point in time. Changing the screenshot shows different results, depending on the screenshot selected. You can also save screenshots so that everyone in your organization can analyze the same view state.
Changing screenshots
From the heatmap view, click the Change Screenshot button. A dropdown appears with three options.
Existing screenshots
Choose from screenshots previously saved by you or your teammates. This helps ensure everyone in your organization analyzes the same view state.
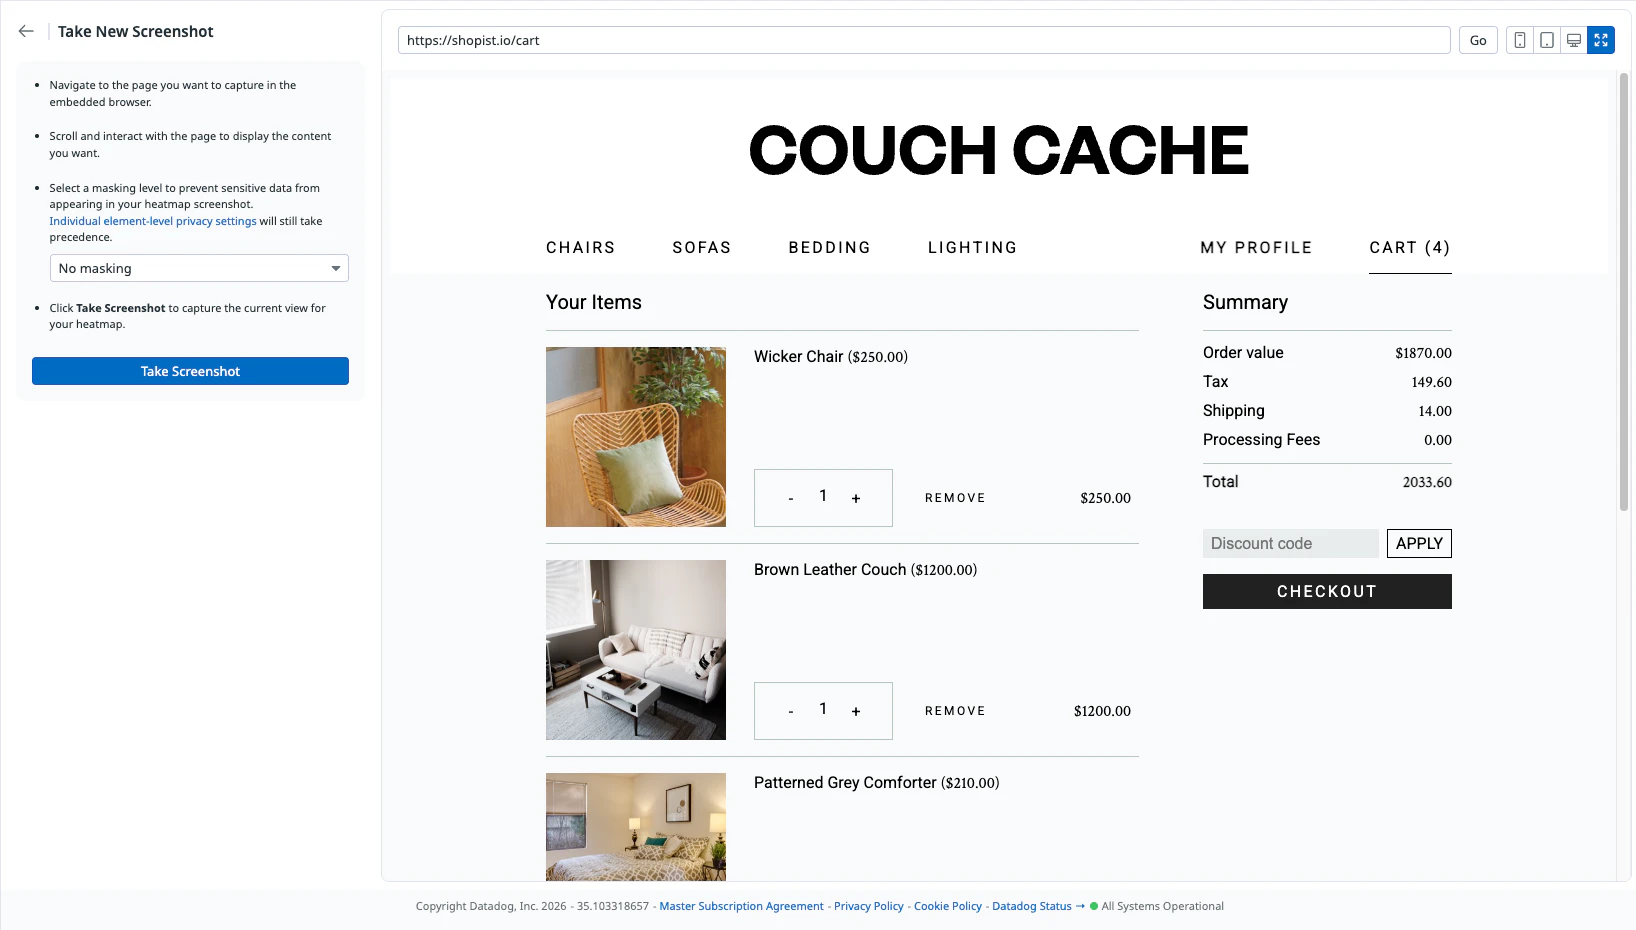
Take new screenshot
Capture a screenshot directly from your live application. Use this option when the state you need—such as an open modal, a hover menu, or a specific scroll position—does not exist in your recorded replays.
Prerequisite: Install the Datadog Test Recorder Chrome extension before using this option. The extension loads your live application in an embedded browser within Datadog, letting you navigate to the exact page and UI state you want to capture.
Click Take new screenshot.
Navigate to the page you want to capture in the embedded browser.
Scroll and interact with the page to display the content you want.
Select a masking level to prevent sensitive data from appearing in your heatmap screenshot. Individual element-level privacy settings configured in your code still take precedence. For more information, see Privacy options.
Click Take Screenshot. A preview of the screenshot opens.
Review the preview and click Confirm to apply the screenshot to your heatmap.
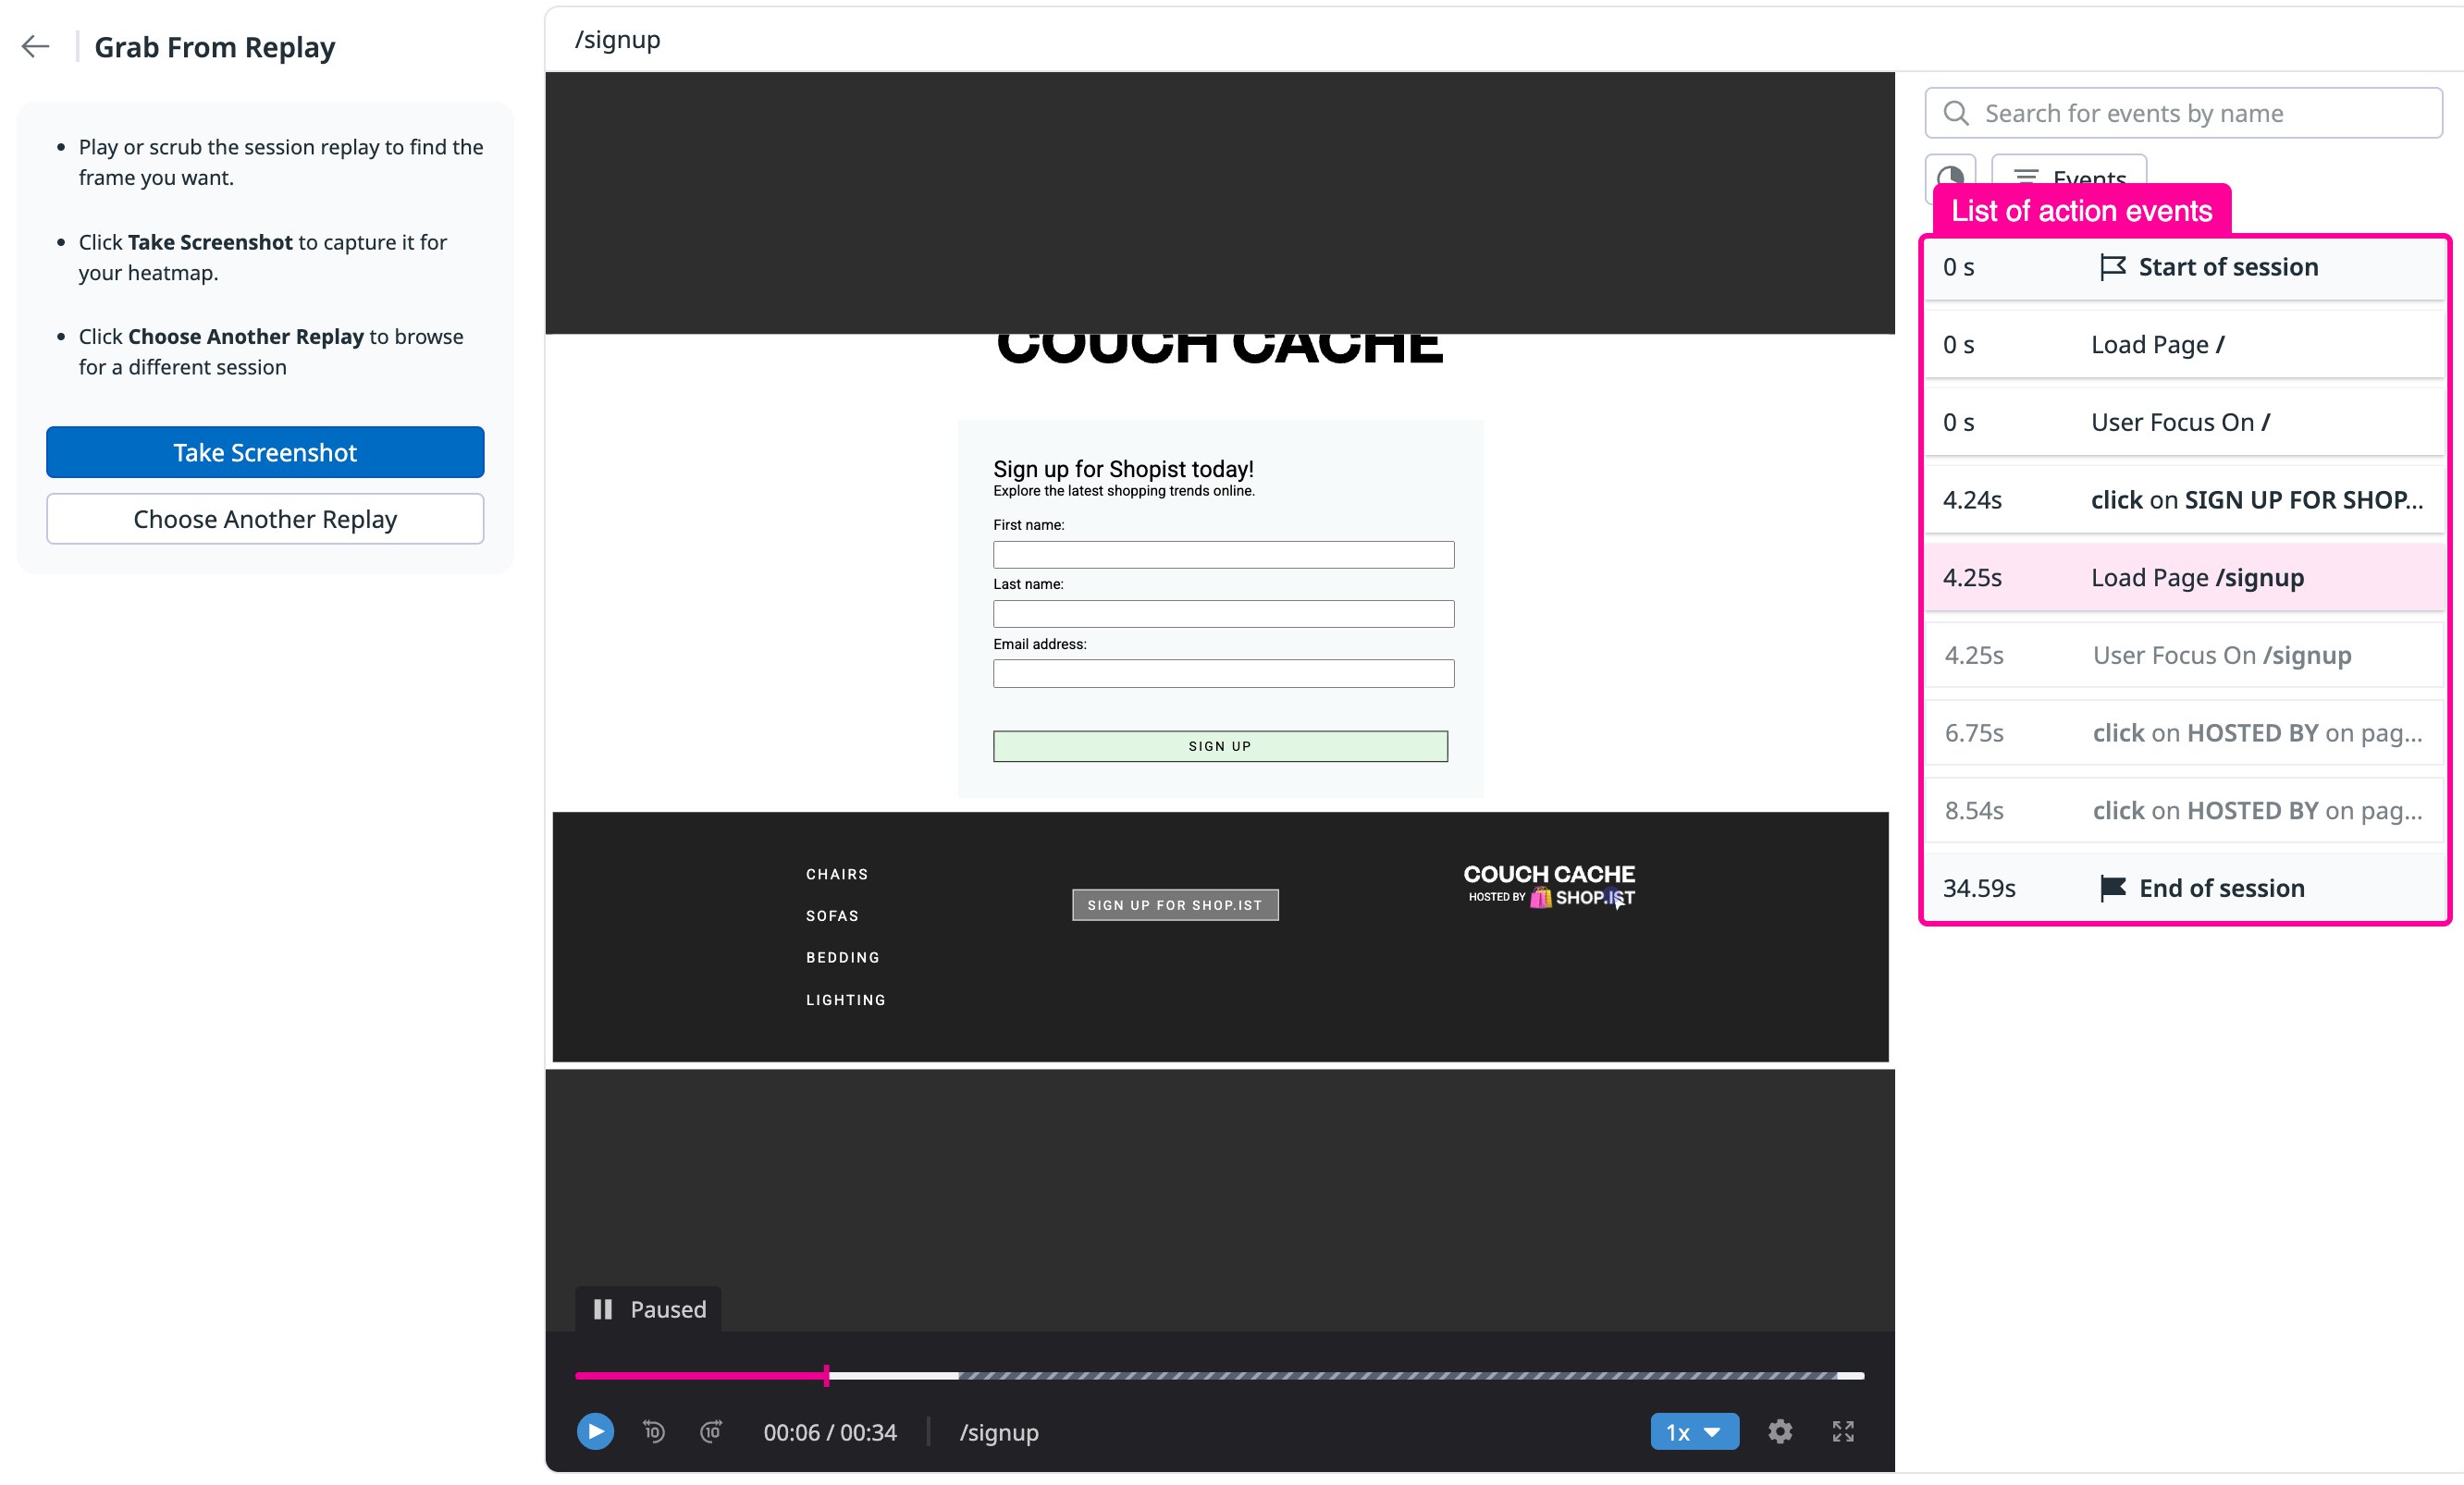
Grab from replay
Select a screenshot from a recorded Session Replay.
Click Grab from replay.
Click an action event on the right to select a different snapshot for your heatmap.
If the session does not contain the action that leads to the desired screenshot, return to the list of replays by clicking Choose Another Replay.
Click Take Screenshot to apply the screenshot at the paused point to the heatmap.
Saving screenshots
Screenshots taken using Grab from replay or Take new screenshot are automatically saved and become the default view for anyone in your organization who opens the heatmap. To also save the screenshot auto-picked from a recent replay, click Save on the current screenshot.
You can save multiple screenshots for the same view (for example: default view, open navigation menu, open modal) and switch between screenshots saved by teammates.
To remove the currently saved screenshot and revert to an auto-picked one from a recent replay, click Unpin on the current screenshot.
Data retention
The time periods you can view in a heatmap depend on where you access it:
- RUM: Session Replay heatmaps use RUM click data (RUM action events), which has a 30-day retention period.
- Product Analytics: Heatmaps use Product Analytics click data, which has a 15-month retention period.
Next steps
After analyzing heatmaps, the next step is to understand the user action by exploring related data. Watch associated session replays to see user actions in the context of their overall session, or navigate to an Analytics explorer in RUM or Product Analytics to analyze your user data.
Troubleshooting
I am looking at a heatmap for a given view, but it’s showing me an unexpected page.
Heatmaps are based on view names. Depending on how your application is configured, many pages can start being grouped under the same view name, or you can start having specific view names.
The view that I selected is not showing the initial content.
Heatmaps are generated with Session Replay data. Datadog’s intelligent algorithm picks a replay that is both recent and best matches the initial state of the page. In some cases, this replay might not be the one you want to use. To switch the snapshot of your heatmap, use the Change Snapshot button to navigate through the different states of a replay and find the one you want. If the replay you’re viewing does not have the snapshot you’re looking for, you can use the Choose Another Replay button to select another replay of the same view.
On the action list on the side of my heatmap, I see an icon showing an element that is not visible in the heatmap.
The tooltip on the icon says element is not visible. This means that the element is a common action on your page, but it’s not displayed on the snapshot in the heatmap. To see that element, you can click Change Snapshot in the top right corner to switch the snapshot of your heatmap to one where that element is present.
After attempting to create a heatmap, I see a “No Replay Data” state appear.
The “No Replay Data” state means that Datadog could not find any Session Replays to use as a heatmap background that matches the current search filters. If you just started to record sessions with the Browser SDK, it may also take a few minutes for the Session Replay to be available for viewing.
After attempting to create a heatmap, I see a “Not enough data to generate a heatmap” state appear.
This means that Datadog was not able to match any user actions with the current selected replay. This happens for a variety of reasons, such as:
- Your application is not using the latest SDK version (>= 4.20.0).
- Your page has recently changed drastically.
All of the user information on the page is empty.
User information is not collected by default. Heatmaps use the user information available in your session data to display relevant insights on behavior.
Further reading
Additional helpful documentation, links, and articles:
