Overview
Session Replay expands your user experience monitoring by allowing you to capture and visually replay the web browsing or mobile app experience of your users. Session Replay is available in both RUM and Product Analytics, helping you identify and reproduce errors, understand user journeys, and gain insights into your application’s usage patterns and design pitfalls.
Browser Session Replay
Browser Session Replay expands your user experience monitoring by allowing you to capture and visually replay the web browsing experience of your users. Combined with RUM performance data, Session Replay is beneficial for error identification, reproduction, and resolution, and provides insights into your web application’s usage patterns and design pitfalls.
The RUM Browser SDK is open source and leverages the open source rrweb project.
Learn more about the Session Replay for Browsers.
Mobile Session Replay
Mobile Session Replay expands visibility into your mobile applications by visually replaying each user interaction, such as taps, swipes, and scrolls. It is available for native apps on both Android and iOS. Visually replaying user interactions on your applications makes it easier to reproduce crashes and errors, as well as understand the user journey for making UI improvements.
Learn more about the Session Replay for Mobile.
Extend data retention
By default, Session Replay data is retained for 30 days.
To extend Session Replay data retention to 15 months, you can enable Extended Retention on individual session replays. These sessions must be non-active (the user has completed their experience).
To access any Session Replay at a later time, Datadog recommends saving the URL or adding it to a Playlist.
Extended Retention only applies to Session Replay and does not include associated events. The 15 months start when Extended Retention is enabled, not when the session is collected.
You can disable Extended Retention at any time. If the session replay is still within its default 30 days of retention, the replay expires at the end of the initial 30 day window. If you disable Extended Retention on a session replay that is older than 30 days, the replay immediately expires.
Refer to the below diagram to understand what data is retained with extended retention.
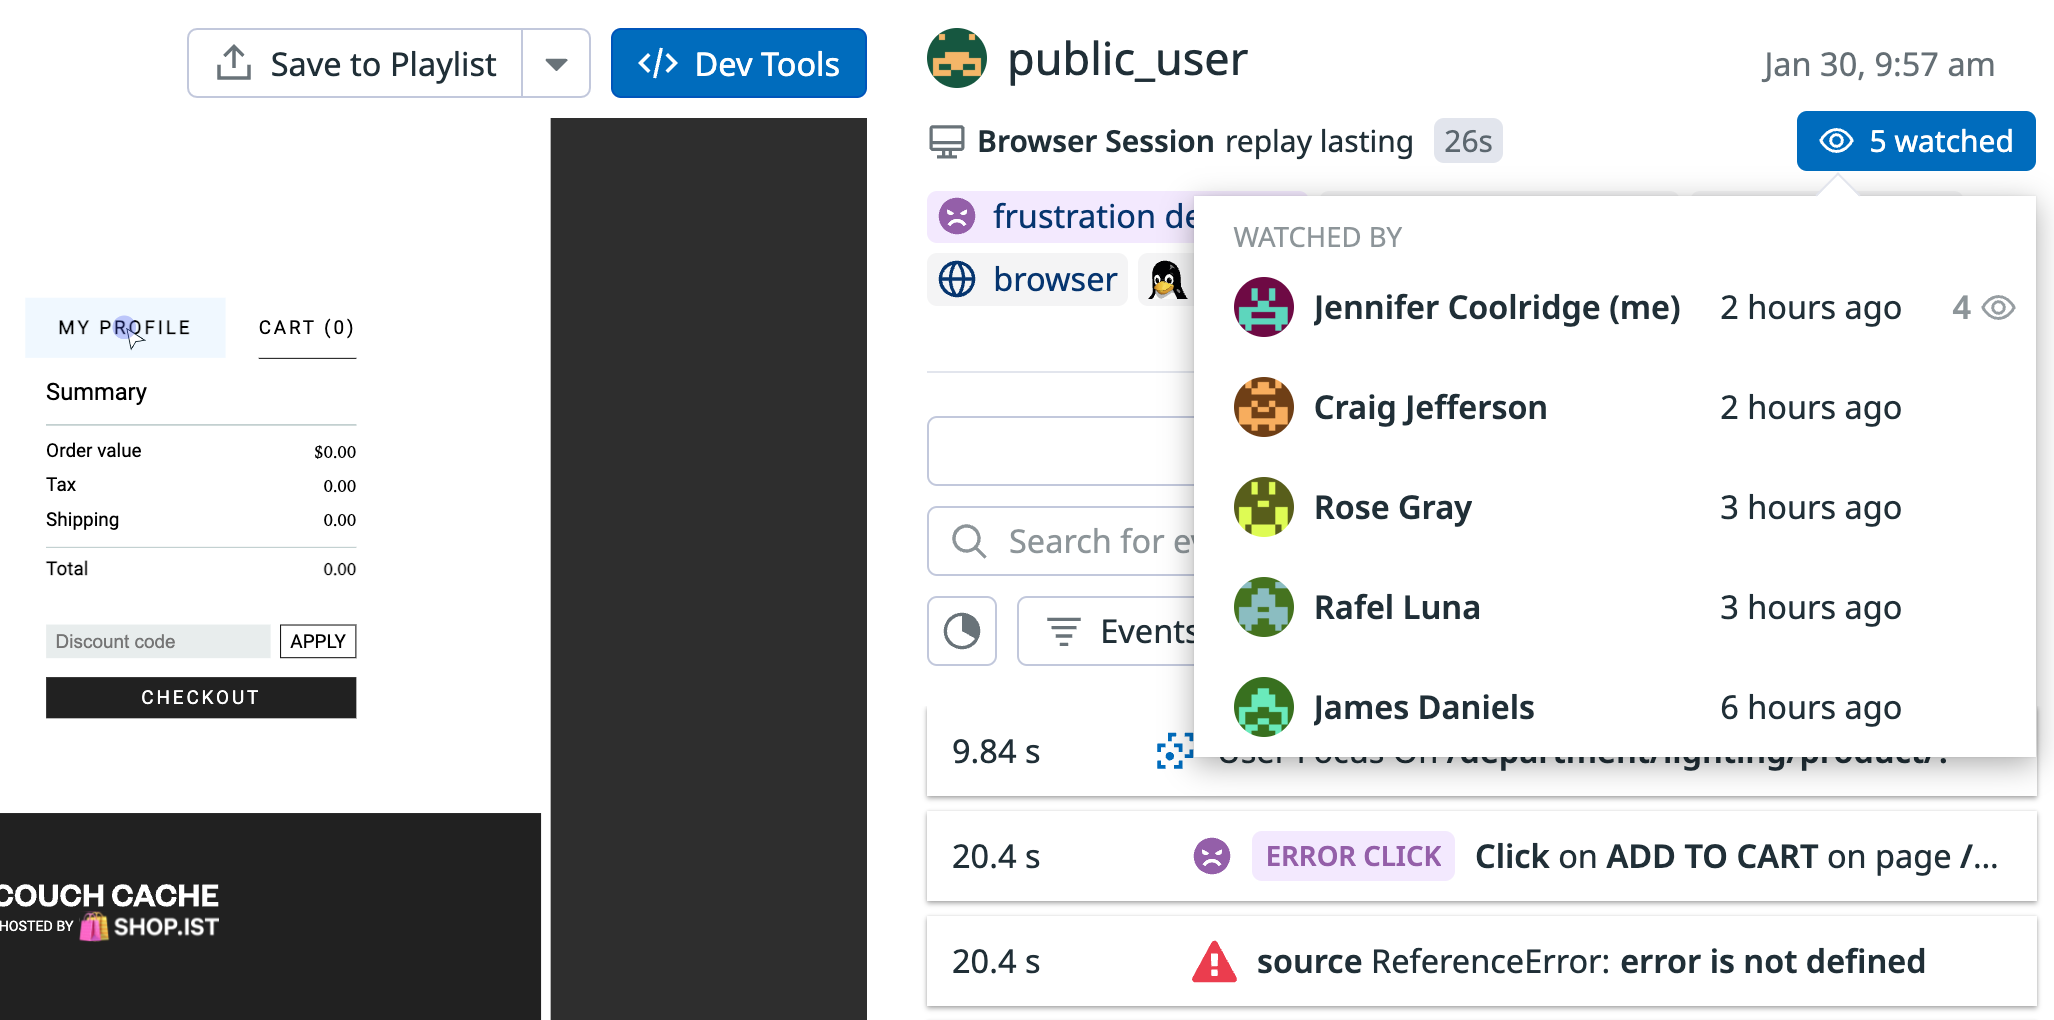
Playback history
You can see who has watched a given session replay by clicking the watched count displayed on the player page. This feature allows you to check whether someone you’d like to share the recording with has already watched it.
The history includes only playbacks that occurred in the player page or in an embedded player, like in a Notebook or side panel. Included playbacks also generate an Audit Trail event. Thumbnail previews are not included in history.
To view your own playback history, check out the My Watch History playlist.
Playlists
You can create a playlist of Session Replays to organize them by any patterns you notice. Learn more about Session Replay Playlists.
Dev Tools is a built-in debugging panel in Session Replay that exposes key information during playback. Use it to identify issues, trace requests, and understand performance bottlenecks—all without reproducing the issue yourself. Dev Tools are available for RUM sessions.
Learn more about Dev Tools for browser and mobile.
Further reading
Additional helpful documentation, links, and articles: