- Essentials
- Getting Started
- Agent
- API
- APM Tracing
- Containers
- Dashboards
- Database Monitoring
- Datadog
- Datadog Site
- DevSecOps
- Incident Management
- Integrations
- Internal Developer Portal
- Logs
- Monitors
- OpenTelemetry
- Profiler
- Session Replay
- Security
- Serverless for AWS Lambda
- Software Delivery
- Synthetic Monitoring and Testing
- Tags
- Workflow Automation
- Learning Center
- Support
- Glossary
- Standard Attributes
- Guides
- Agent
- Integrations
- Developers
- Authorization
- DogStatsD
- Custom Checks
- Integrations
- Create an Agent-based Integration
- Create an API Integration
- Create a Log Pipeline
- Integration Assets Reference
- Build a Marketplace Offering
- Create a Tile
- Create an Integration Dashboard
- Create a Monitor Template
- Create a Cloud SIEM Detection Rule
- OAuth for Integrations
- Install Agent Integration Developer Tool
- Service Checks
- IDE Plugins
- Community
- Guides
- OpenTelemetry
- Administrator's Guide
- API
- Partners
- Datadog Mobile App
- DDSQL Reference
- CoScreen
- CoTerm
- Cloudcraft (Standalone)
- In The App
- Dashboards
- Notebooks
- DDSQL Editor
- Reference Tables
- Sheets
- Monitors and Alerting
- Metrics
- Watchdog
- Bits AI
- Internal Developer Portal
- Error Tracking
- Change Tracking
- Service Management
- Actions & Remediations
- Infrastructure
- Cloudcraft
- Resource Catalog
- Universal Service Monitoring
- Hosts
- Containers
- Processes
- Serverless
- Network Monitoring
- Cloud Cost
- Application Performance
- APM
- APM Terms and Concepts
- Application Instrumentation
- APM Metrics Collection
- Trace Pipeline Configuration
- Correlate Traces with Other Telemetry
- Trace Explorer
- Recommendations
- Code Origins for Spans
- Service Observability
- Endpoint Observability
- Dynamic Instrumentation
- Live Debugger
- Error Tracking
- Data Security
- Guides
- Troubleshooting
- Continuous Profiler
- Database Monitoring
- Agent Integration Overhead
- Setup Architectures
- Setting Up Postgres
- Setting Up MySQL
- Setting Up SQL Server
- Setting Up Oracle
- Setting Up Amazon DocumentDB
- Setting Up MongoDB
- Connecting DBM and Traces
- Data Collected
- Exploring Database Hosts
- Exploring Query Metrics
- Exploring Query Samples
- Exploring Database Schemas
- Exploring Recommendations
- Troubleshooting
- Guides
- Data Streams Monitoring
- Data Jobs Monitoring
- Data Observability
- Digital Experience
- Real User Monitoring
- Synthetic Testing and Monitoring
- Continuous Testing
- Product Analytics
- Software Delivery
- CI Visibility
- CD Visibility
- Deployment Gates
- Test Optimization
- Quality Gates
- DORA Metrics
- Security
- Security Overview
- Cloud SIEM
- Code Security
- Cloud Security
- App and API Protection
- Workload Protection
- Sensitive Data Scanner
- AI Observability
- Log Management
- Observability Pipelines
- Log Management
- Administration
Search RUM Events
Overview
After applying a time range on the top right, you can find events with key:value pairs and a full-text search in the RUM Explorer.
Event types
While RUM automatically captures events, you can also capture your own events. All auto-captured and custom events are stored into six event types for browser, iOS, Android, and React Native applications and indexed to become searchable.
| Event Type | Retention | Description |
|---|---|---|
| Session | 30 days | A user session begins when a user starts browsing the web application. It contains high-level information about the user (such as browser, device, and geolocation). It aggregates all RUM events collected during the user journey with a unique session.id attribute. |
| View | 30 days | A view event is generated each time a user visits a page of the web application. While the user remains on the same page, resource, long-task, error, and action events are linked to the related RUM view with the view.id attribute. |
| Action | 30 days | RUM action events track user interactions during a user journey and can be manually sent to monitor custom user actions. |
| Error | 30 days | RUM collects every frontend error emitted by the browser. |
| Resource | 15 days | A resource event is generated for images, XHR, Fetch, CSS, or JS libraries loaded on a webpage. It includes detailed loading timing information. |
| Long Task | 15 days | A long task event is generated for any task in the browser that blocks the main thread for more than 50ms. |
To search through your RUM events, select an event type from the dropdown menu to the left of the search bar.
Search query
To filter on sessions produced by a specific application by real users over the past day, use the application selector from the top navigation, then create a custom query such as @session.type:user and set the time range to 1d.
Note: If you are including a facet in your query, be sure to create the facet first.
Search syntax
For more information about searching for RUM events and using time frames, see Search Syntax and Custom Time Frames.
Setup facets and measures
All RUM events contain attributes, which are automatically collected by the RUM SDKs, and your custom attributes, which are displayed on the event side panel.
While most automatically collected attributes are indexed and faceted, your custom event attributes are not indexed and faceted by default. Index these attributes by creating a facet or measure to be able to access them in your search and visualizations.
Facets
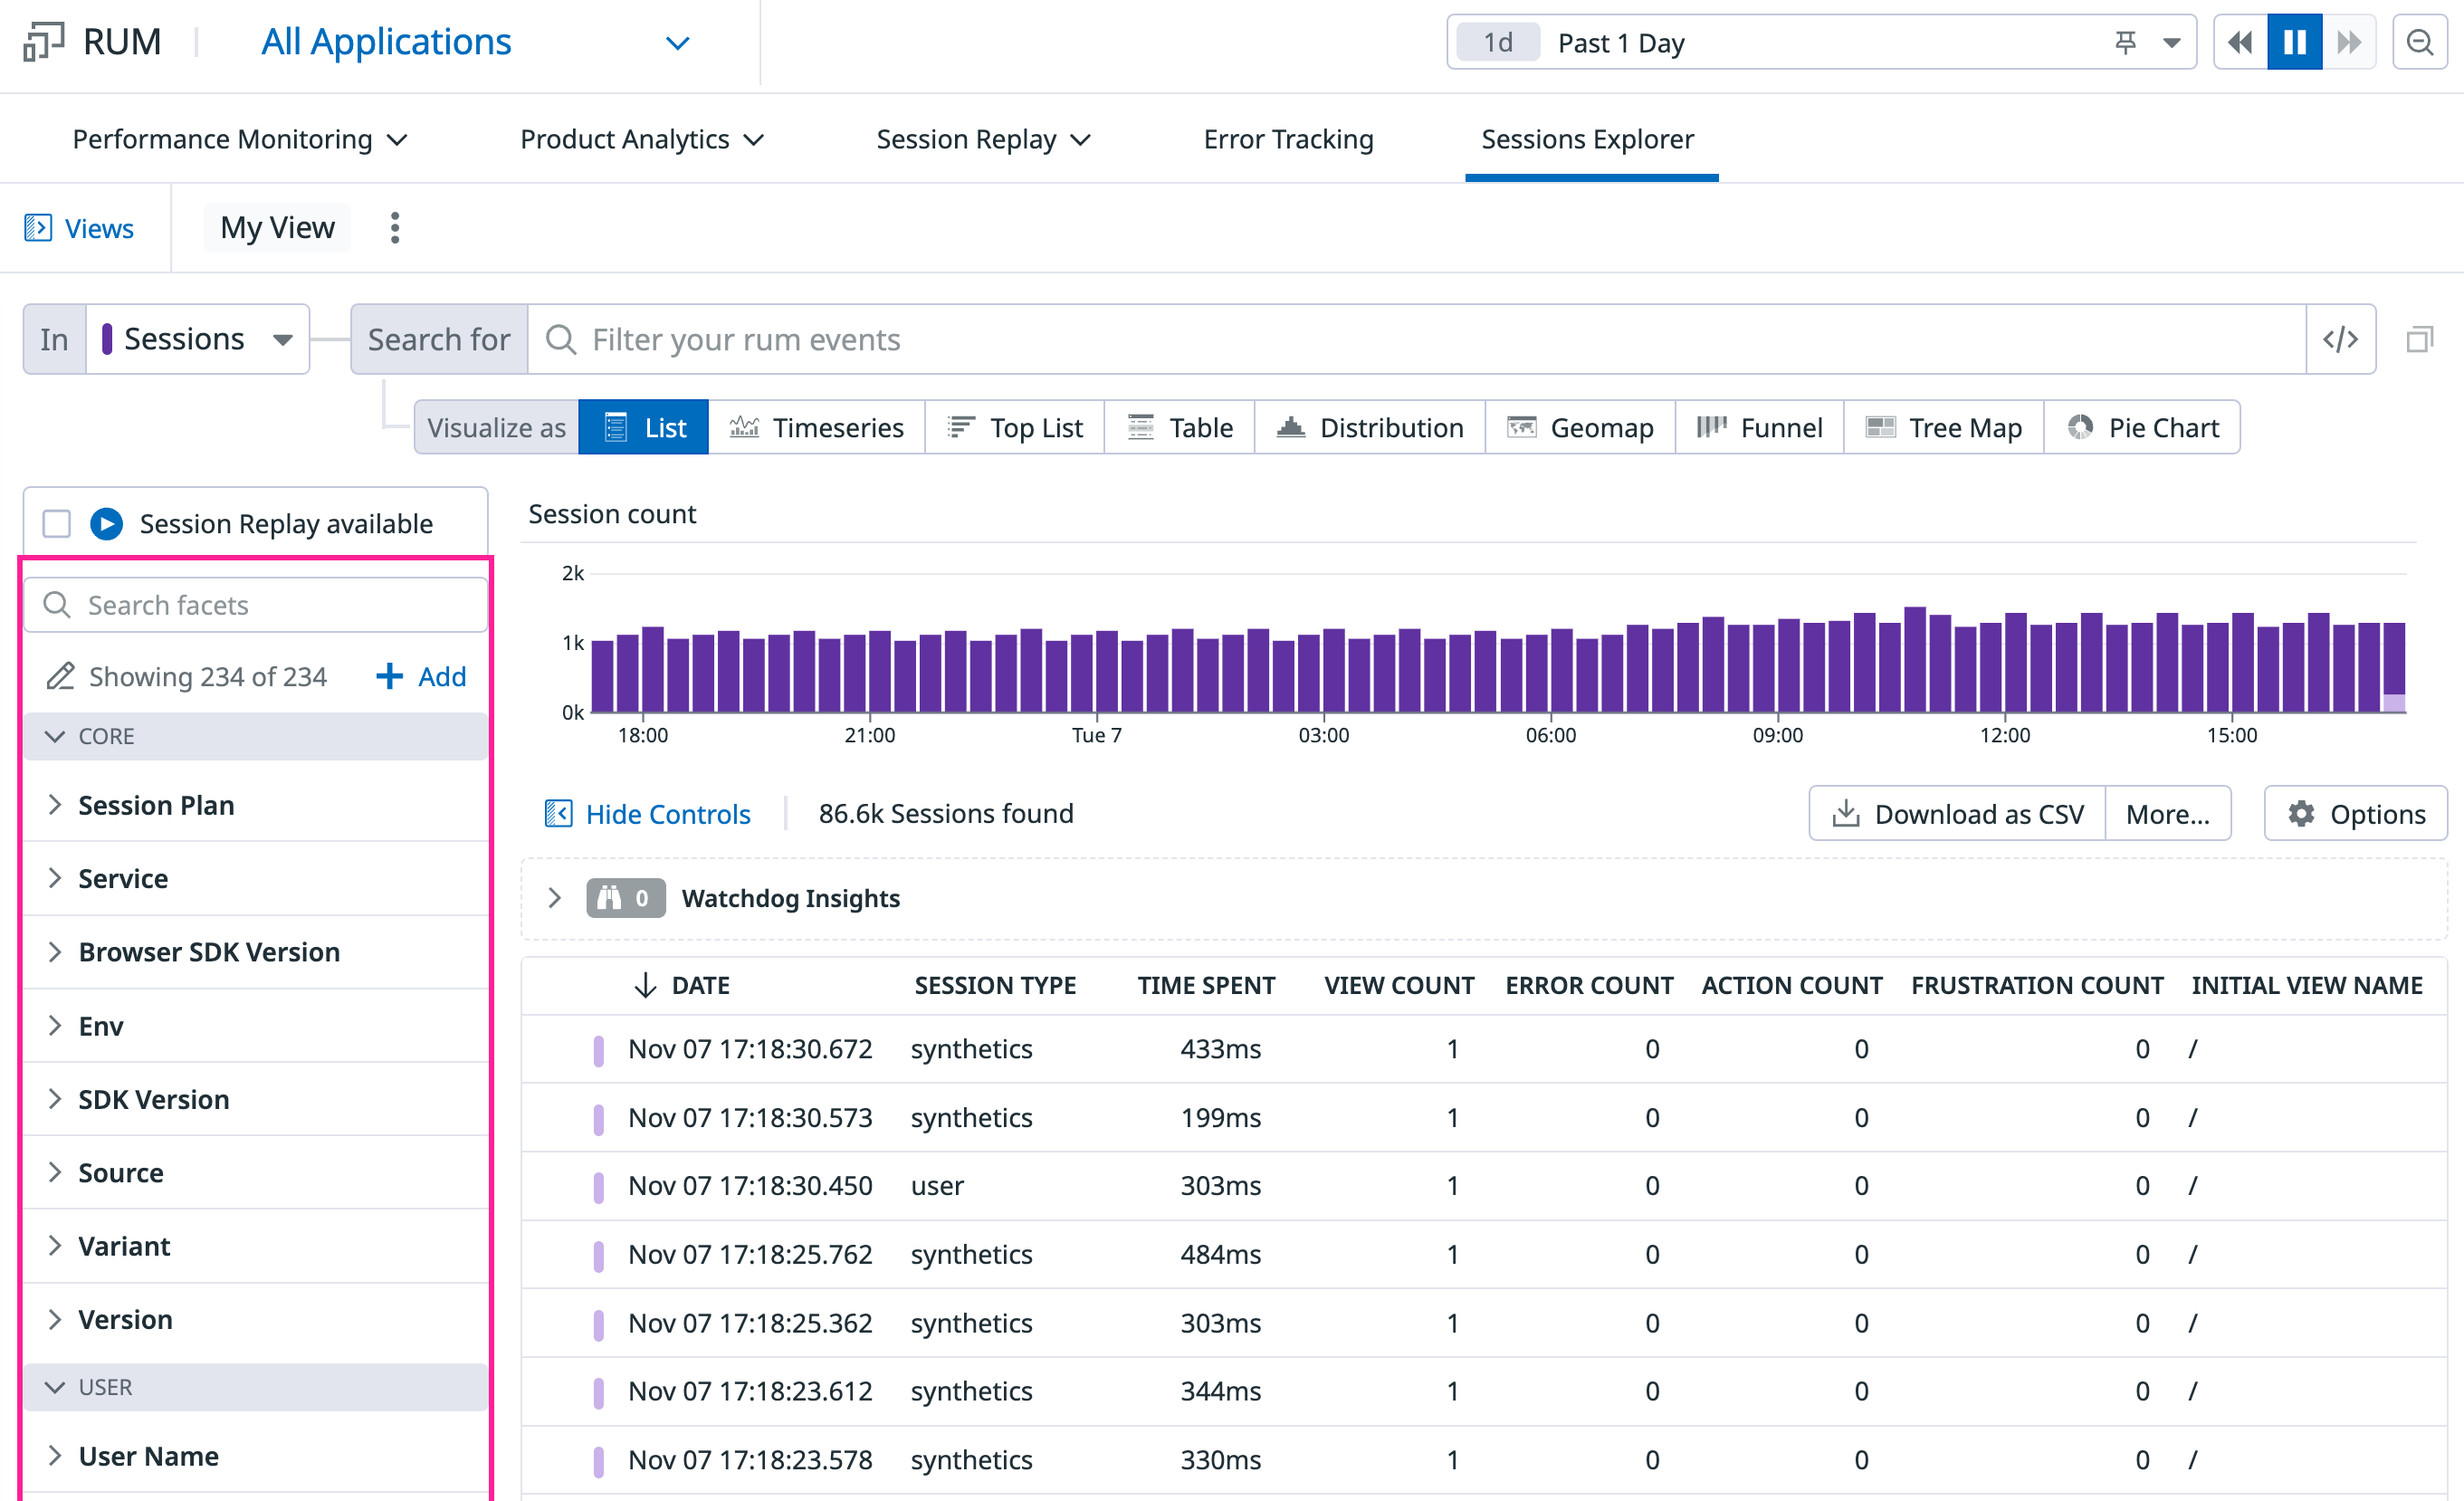
A facet displays all distinct members of an attribute or tag and provides basic analytics, such as the number of RUM events represented. Facets allow you to pivot or filter your datasets based on a given attribute. Selecting a value applies a filter in the search bar.
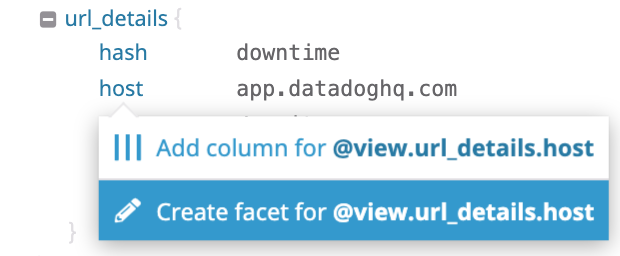
To create a facet, find and click on an attribute in the event side panel. This creates a section of attributes for the values in the side panel, such as “Country subdivision”.
You can also take metadata from a session and turn it into a facet (Virginia, for example) by clicking + Add from the left side panel, then entering or selecting a path to the facet.
You can click Advanced options to customize the facet further, such as providing a different display name, type, group, or description.
The value for the attribute is stored across all new views. You can access these attributes in the search bar, the Facets panel, and your visualizations.
Measures
A measure is an attribute with a numerical value contained in your RUM events.
To create a measure, find and click on a numerical attribute in the event side panel.
The value of this attribute is stored across all new RUM events. You can access these attributes in the search bar, the Facets panel, and your visualizations.
Every measure has a unit that is displayed in a column of the RUM Explorer and in your visualizations.
Search for facets
To search for a specific attribute, add it as a facet and enter @ in your search query. This specifies that you are searching for a facet.
For example, if your facet name is url and you want to filter on the url value www.datadoghq.com, enter @url:www.datadoghq.com.
Further Reading
Additional helpful documentation, links, and articles:


