- Essentials
- Getting Started
- Agent
- API
- APM Tracing
- Containers
- Dashboards
- Database Monitoring
- Datadog
- Datadog Site
- DevSecOps
- Incident Management
- Integrations
- Internal Developer Portal
- Logs
- Monitors
- Notebooks
- OpenTelemetry
- Profiler
- Search
- Session Replay
- Security
- Serverless for AWS Lambda
- Software Delivery
- Synthetic Monitoring and Testing
- Tags
- Workflow Automation
- Learning Center
- Support
- Glossary
- Standard Attributes
- Guides
- Agent
- Integrations
- Developers
- Authorization
- DogStatsD
- Custom Checks
- Integrations
- Build an Integration with Datadog
- Create an Agent-based Integration
- Create an API-based Integration
- Create a Log Pipeline
- Integration Assets Reference
- Build a Marketplace Offering
- Create an Integration Dashboard
- Create a Monitor Template
- Create a Cloud SIEM Detection Rule
- Install Agent Integration Developer Tool
- Service Checks
- IDE Plugins
- Community
- Guides
- OpenTelemetry
- Administrator's Guide
- API
- Partners
- Datadog Mobile App
- DDSQL Reference
- CoScreen
- CoTerm
- Remote Configuration
- Cloudcraft (Standalone)
- In The App
- Dashboards
- Notebooks
- DDSQL Editor
- Reference Tables
- Sheets
- Monitors and Alerting
- Watchdog
- Metrics
- Bits AI
- Internal Developer Portal
- Error Tracking
- Change Tracking
- Service Management
- Service Level Objectives
- Incident Management
- On-Call
- Status Pages
- Event Management
- Case Management
- Actions & Remediations
- Infrastructure
- Cloudcraft
- Resource Catalog
- Universal Service Monitoring
- End User Device Monitoring
- Hosts
- Containers
- Processes
- Serverless
- Network Monitoring
- Storage Management
- Cloud Cost
- Application Performance
- APM
- APM Terms and Concepts
- Application Instrumentation
- APM Metrics Collection
- Trace Pipeline Configuration
- Correlate Traces with Other Telemetry
- Trace Explorer
- Recommendations
- Code Origin for Spans
- Service Observability
- Endpoint Observability
- Dynamic Instrumentation
- Live Debugger
- Error Tracking
- Data Security
- Guides
- Troubleshooting
- Continuous Profiler
- Database Monitoring
- Agent Integration Overhead
- Setup Architectures
- Setting Up Postgres
- Setting Up MySQL
- Setting Up SQL Server
- Setting Up Oracle
- Setting Up Amazon DocumentDB
- Setting Up MongoDB
- Connecting DBM and Traces
- Data Collected
- Exploring Database Hosts
- Exploring Query Metrics
- Exploring Query Samples
- Exploring Database Schemas
- Exploring Recommendations
- Troubleshooting
- Guides
- Data Streams Monitoring
- Data Jobs Monitoring
- Data Observability
- Digital Experience
- Real User Monitoring
- Synthetic Testing and Monitoring
- Continuous Testing
- Product Analytics
- Software Delivery
- CI Visibility
- CD Visibility
- Deployment Gates
- Test Optimization
- Code Coverage
- PR Gates
- DORA Metrics
- Feature Flags
- Security
- Security Overview
- Cloud SIEM
- Code Security
- Cloud Security
- App and API Protection
- Workload Protection
- Sensitive Data Scanner
- AI Observability
- Log Management
- Administration
RUM Performance Overview Dashboards
Web app performance
The web app performance dashboard offers a bird’s-eye view of RUM web applications. It shows:
- Core web vitals: For all views, additional browser KPIs are highlighted: Largest Contentful Paint, First Input Delay, and Cumulative Layout Shift. Other performance telemetry, such as Load Time, is also available.
- XHR and Fetch requests and resources: For all views, identify bottlenecks when your application loads.
- Long tasks : Events that block the browser’s main thread for more than 50ms.
For more information about the data displayed, see RUM Browser Data Collected.
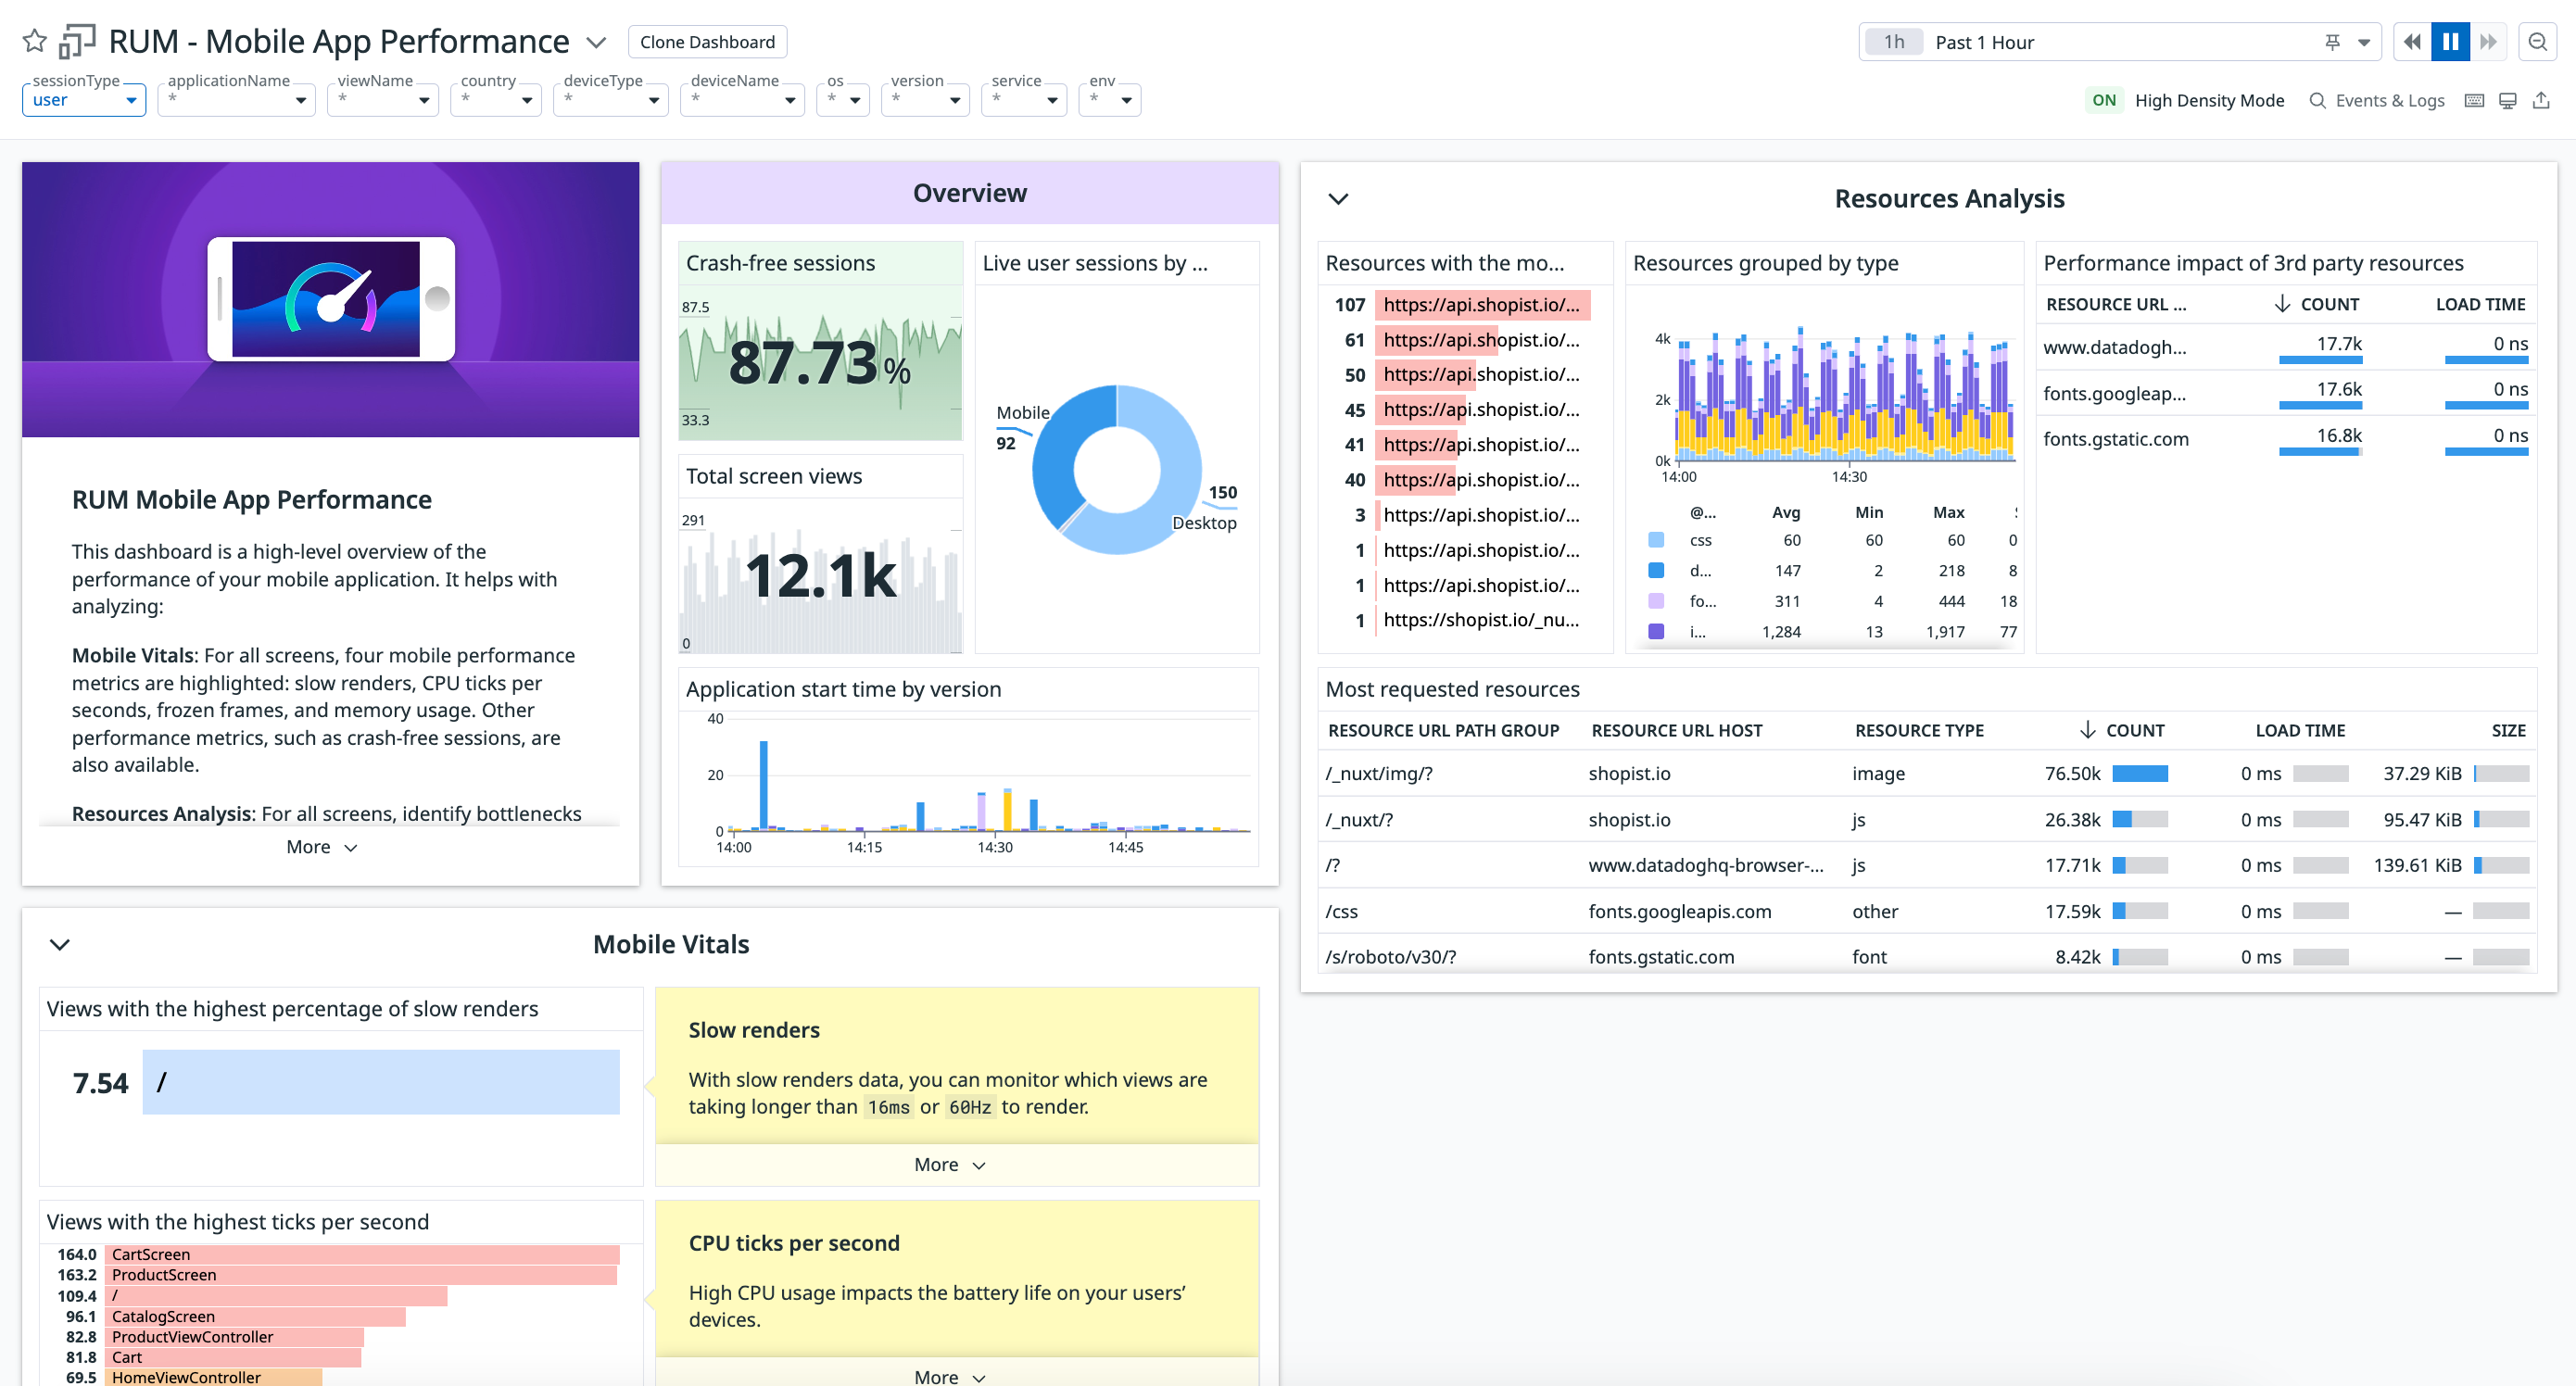
Mobile app performance
The mobile app performance dashboard gives an overview of RUM mobile applications. It shows:
- Mobile vitals: For all screens, additional mobile KPIs are highlighted: slow renders, CPU ticks per seconds, frozen frames, and memory usage. Other performance telemetry, such as crash-free sessions, is also available.
- Resources analysis: For all screens, identify bottlenecks when your application requests content.
- Crashes and errors: Identify where crashes and errors can surface in your application.
For more information about the data displayed, see our documentation for each platform: iOS RUM, Android RUM, React Native RUM, and Flutter RUM.
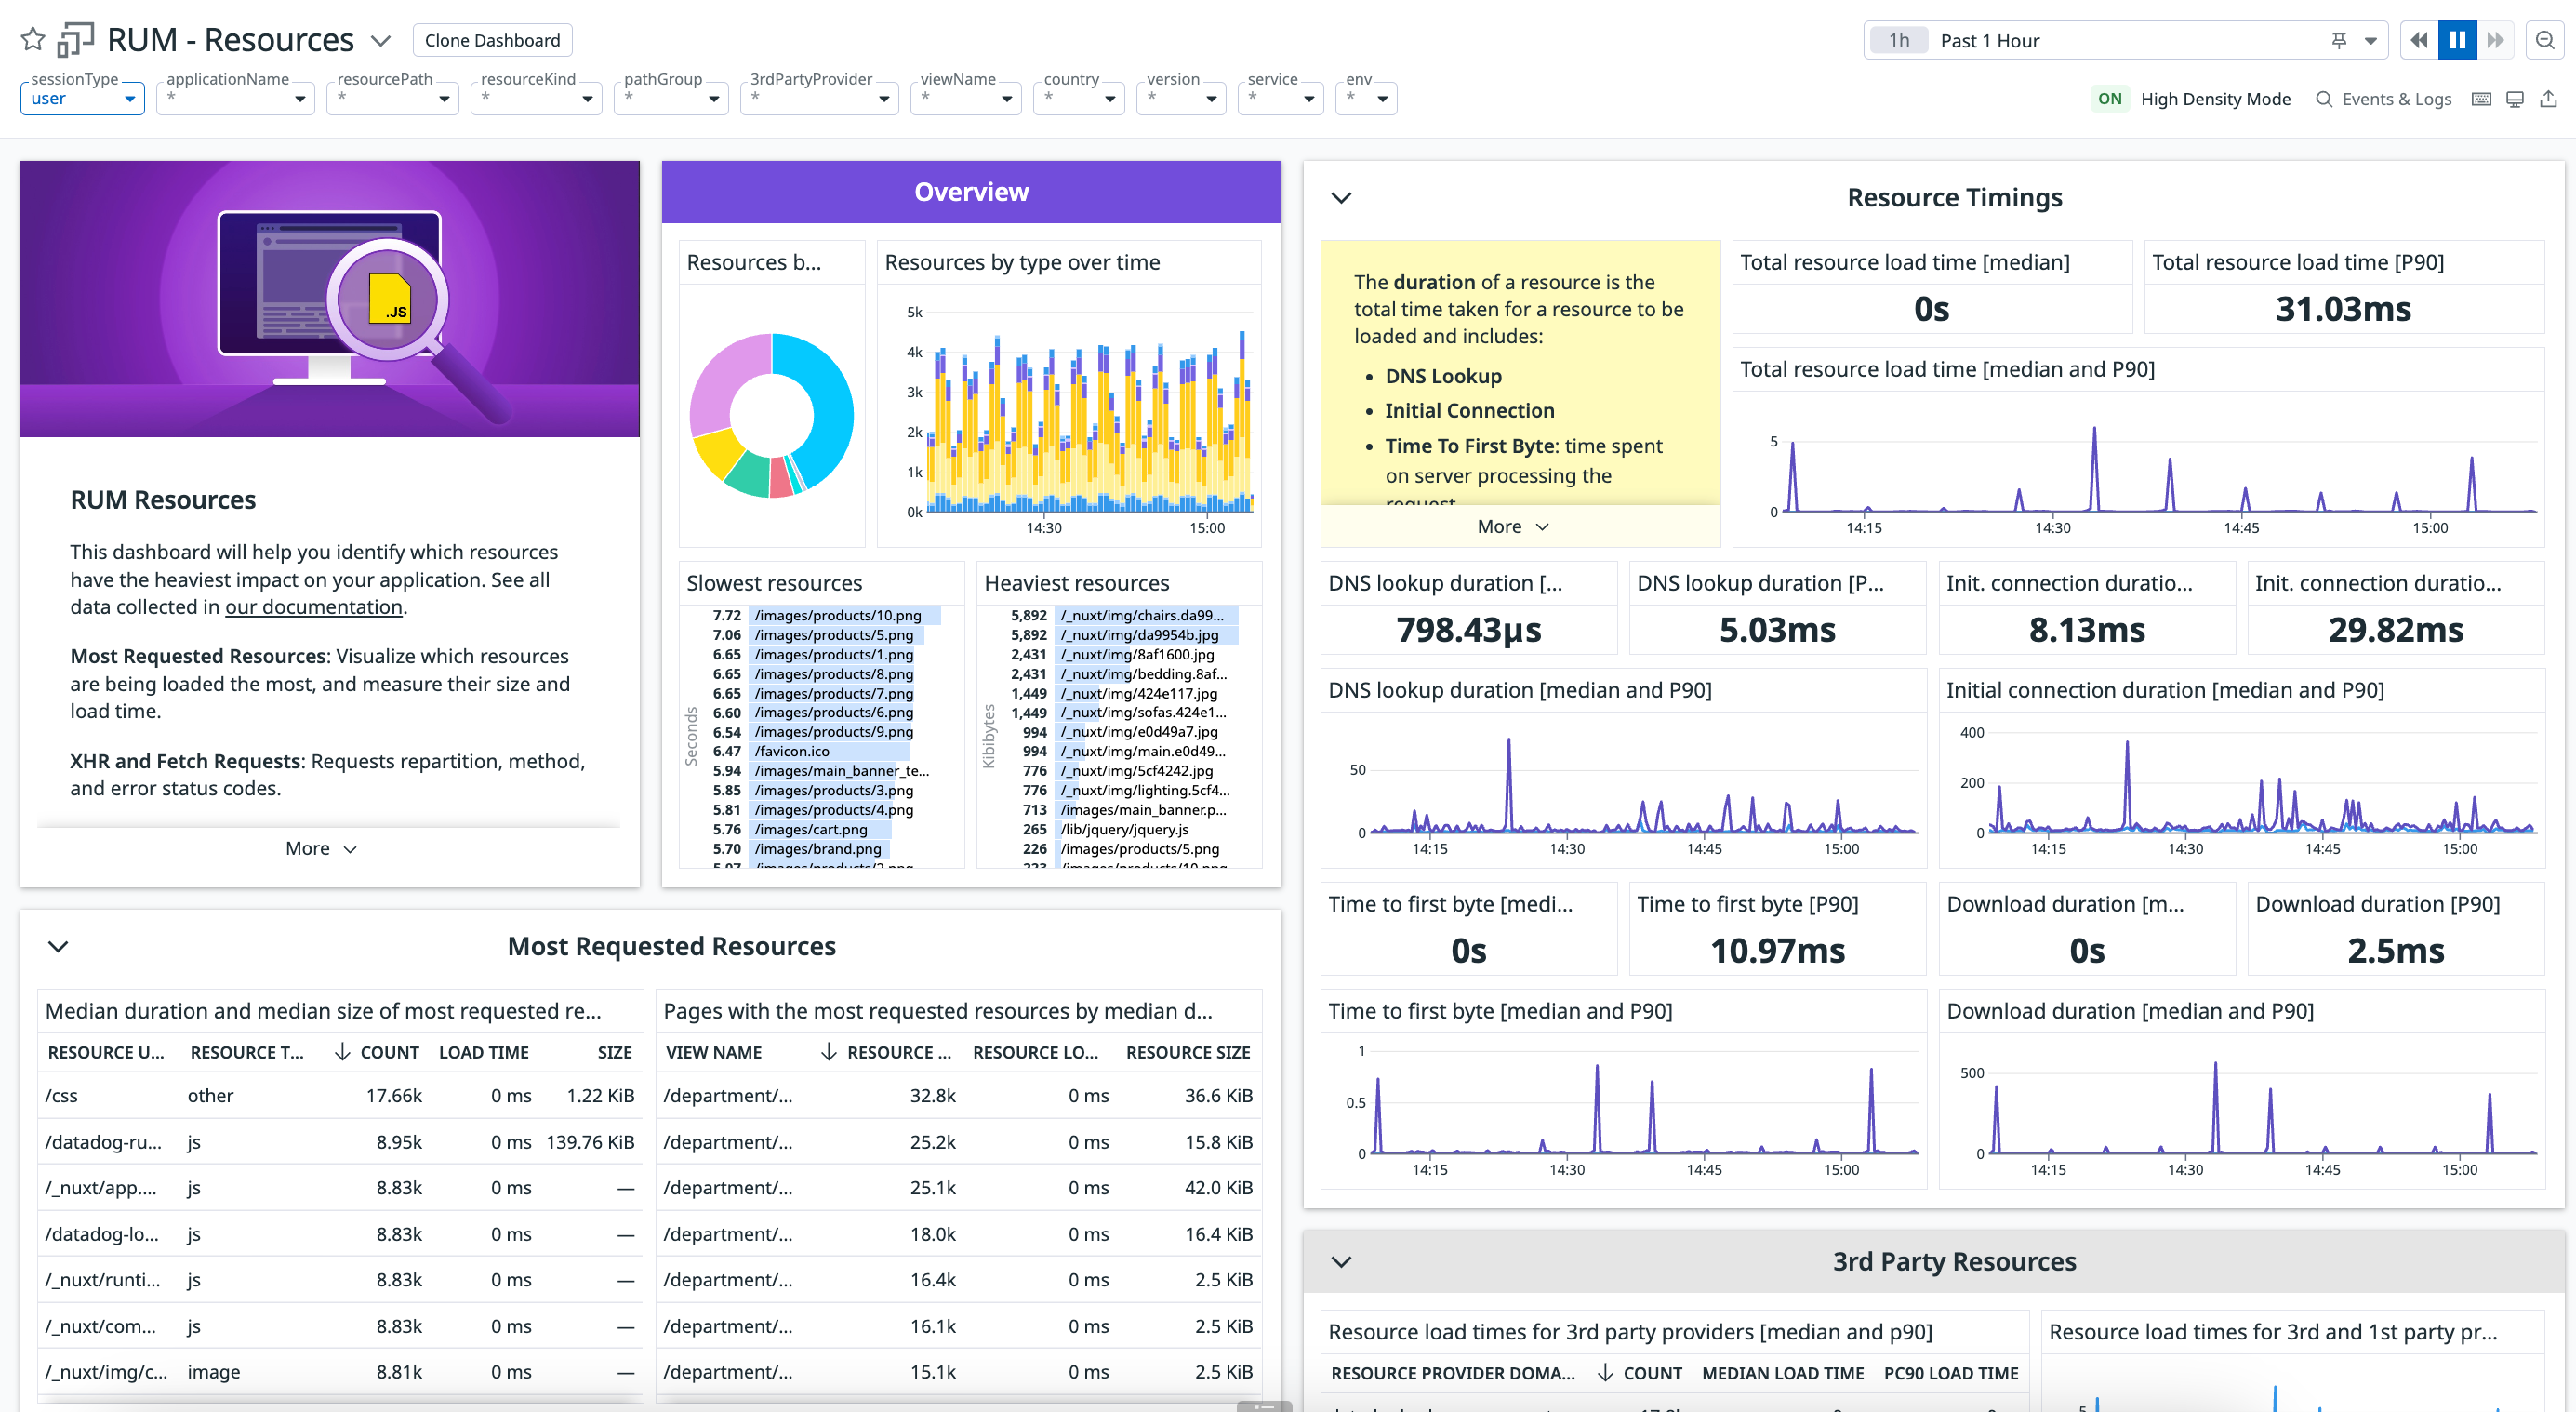
Resources
The RUM resources dashboard helps you identify which resources have the heaviest impact on your application. It shows:
- Most requested resources: Visualize which resources are being loaded the most, and measure their size and load time.
- XHR and Fetch requests: Requests repartition, method, and error status codes.
- Resource load timings: Monitor the trends in resource timings (DNS Lookup, Initial Connection, Time To First Byte, Download) collected by the browser SDK.
- 3rd party resources: Understand which of your 3rd party resources are having the most impact on your application.
For more information about the data displayed, see Real User Monitoring Data Security.
Further Reading
Additional helpful documentation, links, and articles:


