Overview
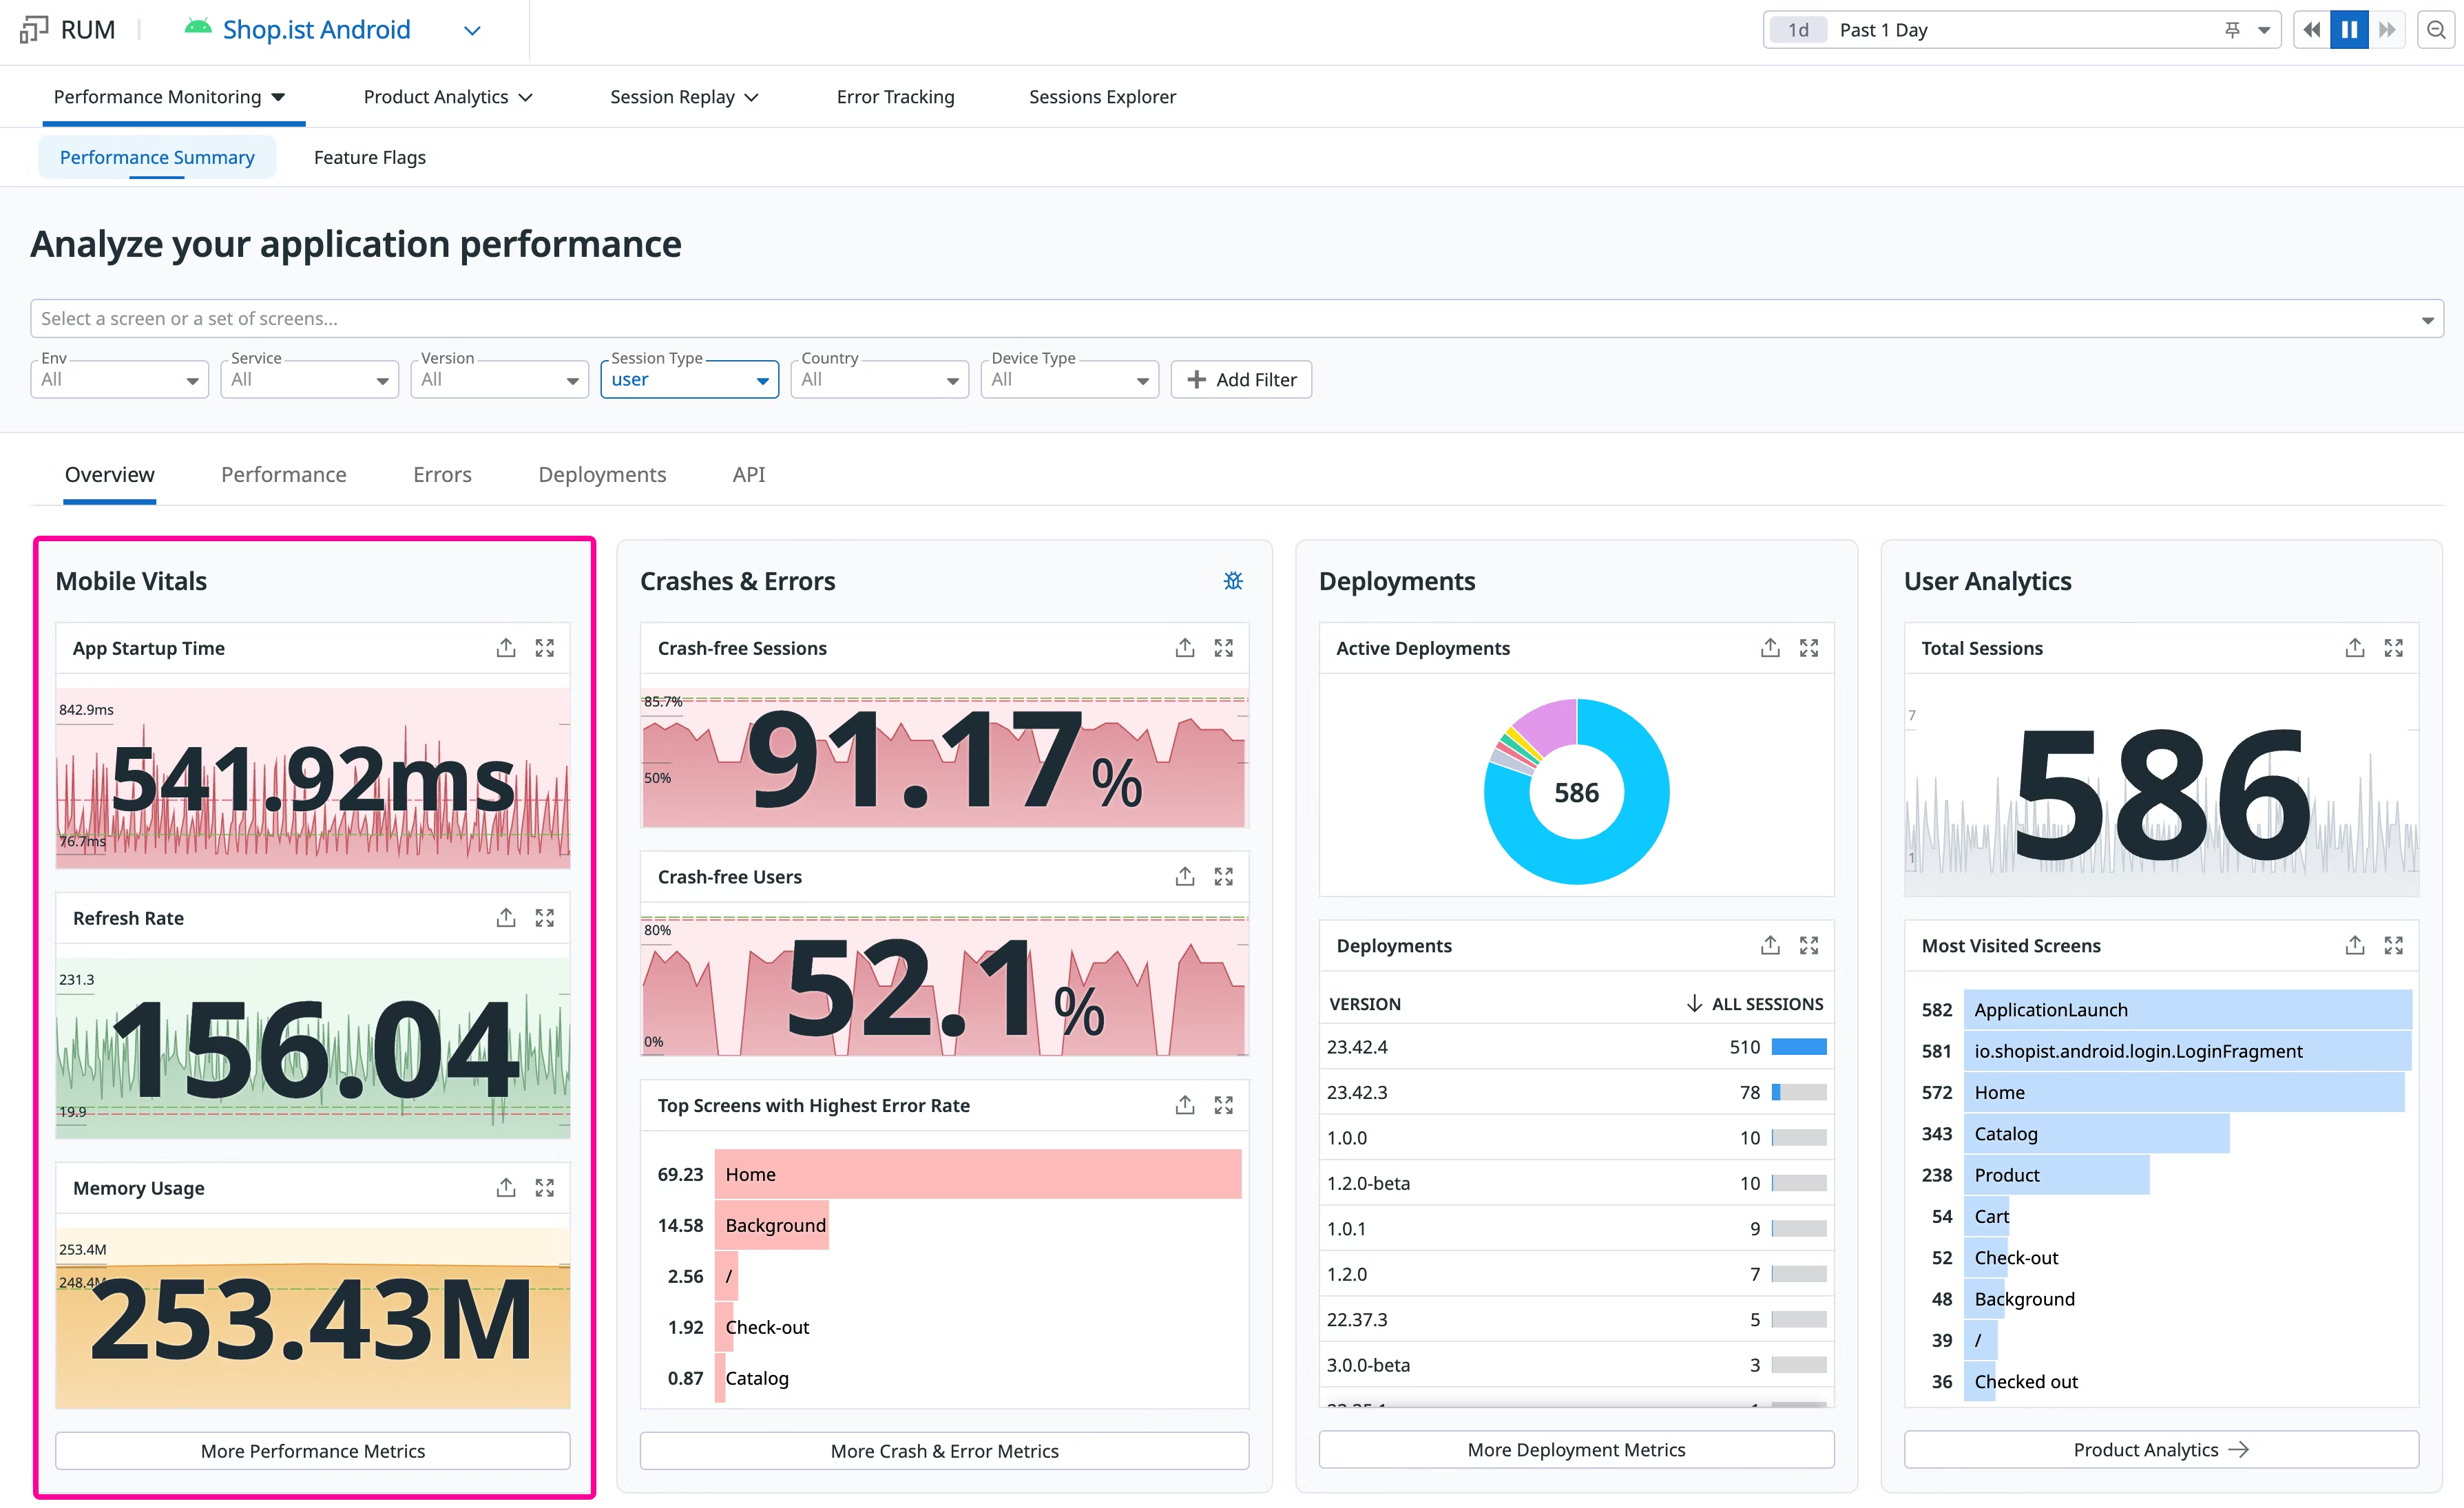
Real User Monitoring offers Mobile Vitals, which includes a set of data points inspired by frameworks such as Android Vitals and Apple’s MetricKit, which can help compute insights about your mobile application’s responsiveness, stability, and resource consumption. Mobile Vitals range from poor, moderate, to good.
You can view Mobile Vitals for your application by navigating to Digital Experience > Performance Summary and selecting your application.
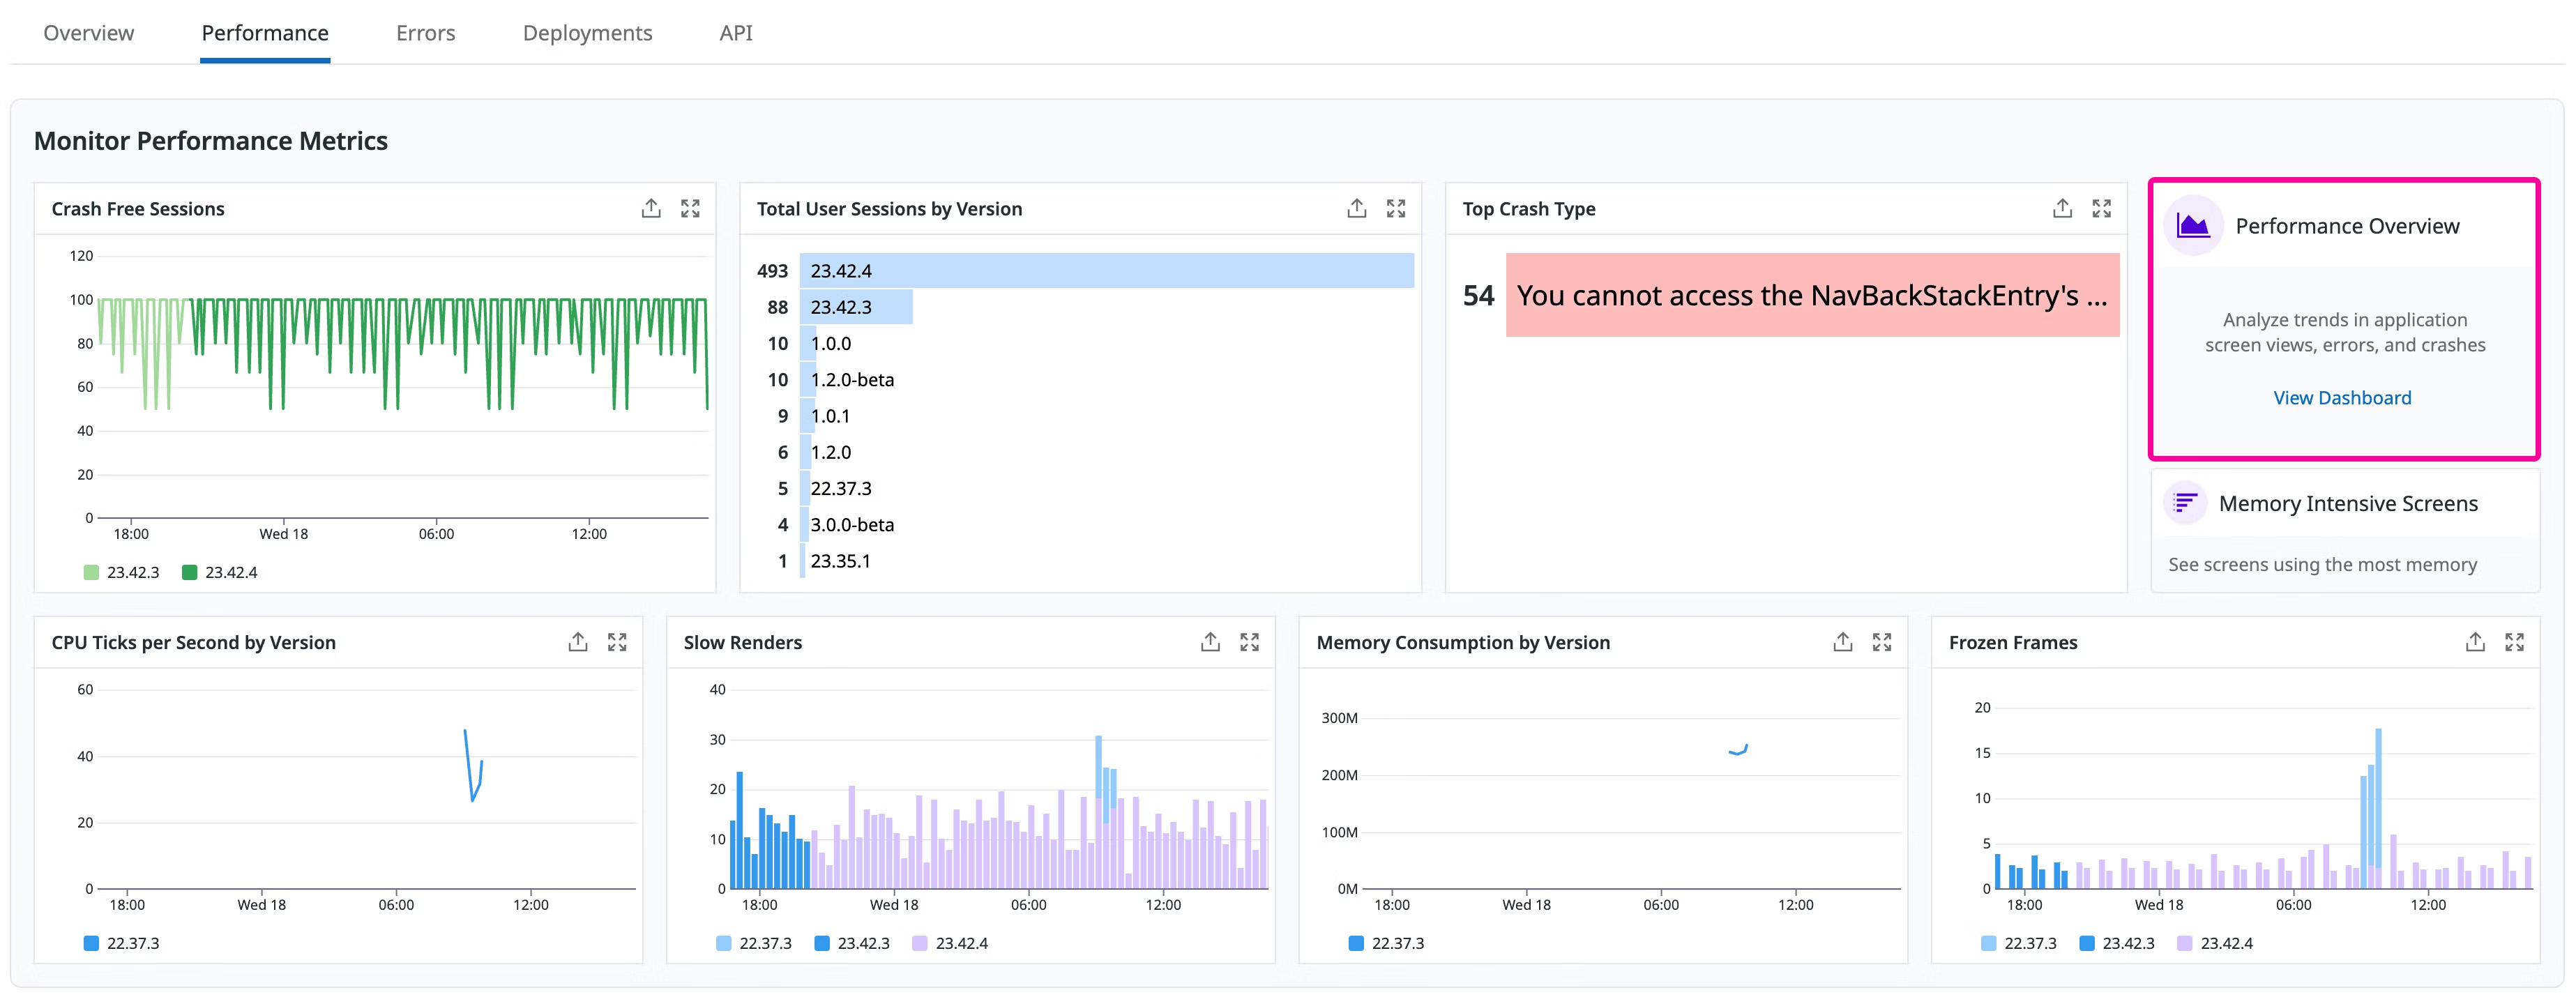
To access the RUM mobile app performance dashboard, switch to the Performance tab, then click the View Dashboard link.
Understand your application’s overall health and performance with the line graphs displaying data points across various application versions. To filter on application version or see specific sessions and views, click on a graph.
You can also select a view in the RUM Explorer and observe recommended benchmark ranges that directly correlate to your application’s user experience in the session. Click on a metric such as Refresh Rate Average and click Search Views With Poor Performance to apply a filter in your search query and examine additional views.
Telemetry
The following telemetry provide insight into your mobile application’s performance.
| Measurement | Description |
|---|
| Refresh rate | To ensure a smooth, jank-free user experience, your application should render frames in under 60Hz.
RUM tracks the application’s main thread display refresh rate using @view.refresh_rate_average and @view.refresh_rate_min view attributes.
Note: Refresh rates are normalized on a range of zero to 60fps. For example, if your application runs at 100fps on a device capable of rendering 120fps, Datadog reports 50fps in Mobile Vitals. |
| Slow renders | To ensure a smooth, jank-free user experience, your application should render frames in under 60Hz.
RUM tracks the application’s display refresh rate using @view.refresh_rate_average and @view.refresh_rate_min view attributes.
With slow rendering, you can monitor which views are taking longer than 16ms or 60Hz to render.
Note: Refresh rates are normalized on a range of zero to 60fps. For example, if your application runs at 100fps on a device capable of rendering 120fps, Datadog reports 50fps in Mobile Vitals. |
| Frozen frames | Frames that take longer than 700ms to render appear as stuck and unresponsive in your application. These are classified as frozen frames.
RUM tracks long task events with the duration for any task taking longer then 100ms to complete.
With frozen frames, you can monitor which views appear frozen (taking longer than 700ms to render) to your end users and eliminate jank in your application. |
| Application not responding | When the UI thread of an application is blocked for more than 5 seconds, an Application Not Responding (ANR) error triggers. If the application is in the foreground, the system displays a dialog modal to the user, allowing them to force quit the application.
RUM tracks ANR occurrences and captures the entire stack trace that blocks the main thread when it encounters an ANR. |
| Crash-free sessions by version | An application crash is reported due to an unexpected exit in the application typically caused by an unhandled exception or signal. Crash-free user sessions in your application directly correspond to your end user’s experience and overall satisfaction.
RUM tracks complete crash reports and presents trends over time with Error Tracking.
With crash-free sessions, you can stay up to speed on industry benchmarks and ensure that your application is ranked highly on the Google Play Store. |
| CPU ticks per second | High CPU usage impacts the battery life on your users’ devices.
RUM tracks CPU ticks per second for each view and the CPU utilization over the course of a session. The recommended range is <40 for good and <60 for moderate.
You can see the top views with the most number of CPU ticks on average over a selected time period under Mobile Vitals in your application’s Overview page. |
| Memory utilization | High memory usage can lead to OutOfMemoryError, which causes the application to crash and creates a poor user experience.
RUM tracks the amount of physical memory used by your application in bytes for each view, over the course of a session. The recommended range is <200MB for good and <400MB for moderate.
You can see the top views with the most memory consumption on average over a selected time period under Mobile Vitals in your application’s Overview page. |
| Measurement | Description |
|---|
| Refresh rate | To ensure a smooth, jank-free user experience, your application should render frames in under 60Hz.
RUM tracks the application’s main thread display refresh rate using @view.refresh_rate_average and @view.refresh_rate_min view attributes.
Note: Refresh rates are normalized on a range of zero to 60fps. For example, if your application runs at 100fps on a device capable of rendering 120fps, Datadog reports 50fps in Mobile Vitals. |
| Slow renders | To ensure a smooth, jank-free user experience, your application should render frames in under 60Hz.
RUM tracks the application’s display refresh rate using @view.refresh_rate_average and @view.refresh_rate_min view attributes.
With slow rendering, you can monitor which views are taking longer than 16ms or 60Hz to render.
Note: Refresh rates are normalized on a range of zero to 60fps. For example, if your application runs at 100fps on a device capable of rendering 120fps, Datadog reports 50fps in Mobile Vitals. |
| Frozen frames | Frames that take longer than 700ms to render appear as stuck and unresponsive in your application. These are classified as frozen frames.
RUM tracks long task events with the duration for any task taking longer then 100ms to complete.
With frozen frames, you can monitor which views appear frozen (taking longer than 700ms to render) to your end users and eliminate jank in your application. |
| Crash-free sessions by version | An application crash is reported due to an unexpected exit in the application typically caused by an unhandled exception or signal. Crash-free user sessions in your application directly correspond to your end user’s experience and overall satisfaction.
RUM tracks complete crash reports and presents trends over time with Error Tracking.
With crash-free sessions, you can stay up to speed on industry benchmarks and ensure that your application is ranked highly on the Apple App Store. |
| Hang rate | As defined by Apple, the hang rate of an application corresponds to “the number of seconds per hour that the app is unresponsive, while only counting periods of unresponsiveness of more than 250 ms.” To compute the hang rate of your application on Datadog, enable app hang reporting and follow the dedicated section. |
| CPU ticks per second | High CPU usage impacts the battery life on your users’ devices.
RUM tracks CPU ticks per second for each view and the CPU utilization over the course of a session. The recommended range is <40 for good and <60 for moderate.
You can see the top views with the most number of CPU ticks on average over a selected time period under Mobile Vitals in your application’s Overview page. |
| Memory utilization | High memory usage can lead to watchdog terminations, which causes a poor user experience.
RUM tracks the amount of physical memory used by your application in bytes for each view, over the course of a session. The recommended range is <200MB for good and <400MB for moderate.
You can see the top views with the most memory consumption on average over a selected time period under Mobile Vitals in your application’s Overview page. |
| Measurement | Description |
|---|
| Refresh rate | To ensure a smooth, jank-free user experience, your application should render frames in under 60Hz.
RUM tracks the application’s main thread display refresh rate using @view.refresh_rate_average and @view.refresh_rate_min view attributes.
Note: Refresh rates are normalized on a range of zero to 60fps. For example, if your application runs at 100fps on a device capable of rendering 120fps, Datadog reports 50fps in Mobile Vitals. |
| Slow renders | To ensure a smooth, jank-free user experience, your application should render frames in under 60Hz.
RUM tracks the application’s display refresh rate using @view.refresh_rate_average and @view.refresh_rate_min view attributes.
With slow rendering, you can monitor which views are taking longer than 16ms or 60Hz to render.
Note: Refresh rates are normalized on a range of zero to 60fps. For example, if your application runs at 100fps on a device capable of rendering 120fps, Datadog reports 50fps in Mobile Vitals. |
| Frozen frames | Frames that take longer than 700ms to render appear as stuck and unresponsive in your application. These are classified as frozen frames.
RUM tracks long task events with the duration for any task taking longer then 100ms to complete.
With frozen frames, you can monitor which views appear frozen (taking longer than 700ms to render) to your end users and eliminate jank in your application. |
| Application not responding | On Android, when the UI thread of an application is blocked for more than 5 seconds, an Application Not Responding (ANR) error triggers. If the application is in the foreground, the system displays a dialog modal to the user, allowing them to force quit the application.
RUM tracks ANR occurrences and captures the entire stack trace that blocks the main thread when it encounters an ANR. |
| Crash-free sessions by version | An application crash is reported due to an unexpected exit in the application typically caused by an unhandled exception or signal. Crash-free user sessions in your application directly correspond to your end user’s experience and overall satisfaction.
RUM tracks complete crash reports and presents trends over time with Error Tracking.
With crash-free sessions, you can stay up to speed on industry benchmarks and ensure that your application is ranked highly on the Google Play Store. |
| CPU ticks per second | High CPU usage impacts the battery life on your users’ devices.
RUM tracks CPU ticks per second for each view and the CPU utilization over the course of a session. The recommended range is <40 for good and <60 for moderate.
You can see the top views with the most number of CPU ticks on average over a selected time period under Mobile Vitals in your application’s Overview page. |
| Memory utilization | High memory usage can lead to out-of-memory crashes, which causes a poor user experience.
RUM tracks the amount of physical memory used by your application in bytes for each view, over the course of a session. The recommended range is <200MB for good and <400MB for moderate.
You can see the top views with the most memory consumption on average over a selected time period under Mobile Vitals in your application’s Overview page. |
| Widget build time | This is the duration of time taken build the frame on the UI thread. To ensure a smooth animations, this should not exceed 16ms for 60 FPS, and 8ms for 120 FPS.
High values here mean you need to look into optimizing your build methods for this view. See Control Build Cost in the Flutter documentation. |
| Raster time | This is the duration of time taken to rasterize the frame on the raster thread. To ensure a smooth animations, this should not exceed 16ms for 60 FPS, and 8ms for 120 FPS.
High values here may mean your view is complex to render. See [Identifying Problems in the GPU Graph][12] in the Flutter documentation. |
| Measurement | Description |
|---|
| Refresh rate | To ensure a smooth, jank-free user experience, your application should render frames in under 60Hz.
RUM tracks the application’s main thread display refresh rate using @view.refresh_rate_average and @view.refresh_rate_min view attributes.
Note: Refresh rates are normalized on a range of zero to 60fps. For example, if your application runs at 100fps on a device capable of rendering 120fps, Datadog reports 50fps in Mobile Vitals. |
| JS Refresh rate | To ensure a smooth, jank-free user experience, your application should render frames in under 60Hz.
RUM tracks the application’s javascript thread display refresh rate using @view.js_refresh_rate.average, @view.js_refresh_rate.min, and @view.js_refresh_rate.max view attributes.
Note: Refresh rates are normalized on a range of zero to 60fps. For example, if your application runs at 100fps on a device capable of rendering 120fps, Datadog reports 50fps in Mobile Vitals. |
| Slow renders | To ensure a smooth, jank-free user experience, your application should render frames in under 60Hz.
With slow rendering, you can monitor which views have an average frame rate under 55fps.
Note: Refresh rates are normalized on a range of zero to 60fps. For example, if your application runs at 100fps on a device capable of rendering 120fps, Datadog reports 50fps in Mobile Vitals. |
| Frozen frames | Frames that take longer than 700ms to render appear as stuck and unresponsive in your application. These are classified as frozen frames.
RUM tracks long task events with the duration for any task taking longer then 100ms to complete.
With frozen frames, you can monitor which views appear frozen (taking longer than 700ms to render) to your end users and eliminate jank in your application. |
| Application not responding | When the UI thread of an application is blocked for more than 5 seconds, an Application Not Responding (ANR) error triggers. If the application is in the foreground, the system displays a dialog modal to the user, allowing them to force quit the application.
RUM tracks ANR occurrences and captures the entire stack trace that blocks the main thread when it encounters an ANR. |
| Crash-free sessions by version | An application crash is reported due to an unexpected exit in the application typically caused by an unhandled exception or signal. Crash-free user sessions in your application directly correspond to your end user’s experience and overall satisfaction.
RUM tracks complete crash reports and presents trends over time with Error Tracking.
With crash-free sessions, you can stay up to speed on industry benchmarks and ensure that your application is ranked highly on the Google Play Store. |
| CPU ticks per second | High CPU usage impacts the battery life on your users’ devices.
RUM tracks CPU ticks per second for each view and the CPU utilization over the course of a session. The recommended range is <40 for good and <60 for moderate.
You can see the top views with the most number of CPU ticks on average over a selected time period under Mobile Vitals in your application’s Overview page. |
| Memory utilization | High memory usage can lead to out-of-memory crashes, which causes a poor user experience.
RUM tracks the amount of physical memory used by your application in bytes for each view, over the course of a session. The recommended range is <200MB for good and <400MB for moderate.
You can see the top views with the most memory consumption on average over a selected time period under Mobile Vitals in your application’s Overview page. |
| Measurement | Description |
|---|
| Refresh rate | To ensure a smooth, jank-free user experience, your application should render frames in under 60Hz.
RUM tracks the application’s main thread display refresh rate using @view.refresh_rate_average and @view.refresh_rate_min view attributes.
Note: Refresh rates are normalized on a range of zero to 60fps. For example, if your application runs at 100fps on a device capable of rendering 120fps, Datadog reports 50fps in Mobile Vitals. |
| Slow renders | To ensure a smooth, jank-free user experience, your application should render frames in under 60Hz.
RUM tracks the application’s display refresh rate using @view.refresh_rate_average and @view.refresh_rate_min view attributes.
With slow rendering, you can monitor which views are taking longer than 16ms or 60Hz to render.
Note: Refresh rates are normalized on a range of zero to 60fps. For example, if your application runs at 100fps on a device capable of rendering 120fps, Datadog reports 50fps in Mobile Vitals. |
| Crash-free sessions by version | An application crash is reported due to an unexpected exit in the application typically caused by an unhandled exception or signal. Crash-free user sessions in your application directly correspond to your end user’s experience and overall satisfaction.
RUM tracks complete crash reports and presents trends over time with Error Tracking.
With crash-free sessions, you can stay up to speed on industry benchmarks and ensure that your application is ranked highly on the Google Play Store. |
| Hang rate | As defined by Apple, the hang rate of an application corresponds to “the number of seconds per hour that the app is unresponsive, while only counting periods of unresponsiveness of more than 250 ms.” To compute the hang rate of your application on Datadog, enable “Track Non-Fatal App Hangs” in Datadog’s Settings. |
| CPU ticks per second | High CPU usage impacts the battery life on your users’ devices.
RUM tracks CPU ticks per second for each view and the CPU utilization over the course of a session. The recommended range is <40 for good and <60 for moderate.
You can see the top views with the most number of CPU ticks on average over a selected time period under Mobile Vitals in your application’s Overview page. |
| Memory utilization | High memory usage can lead to watchdog terminations, which causes a poor user experience.
RUM tracks the amount of physical memory used by your application in bytes for each view, over the course of a session. The recommended range is <200MB for good and <400MB for moderate.
You can see the top views with the most memory consumption on average over a selected time period under Mobile Vitals in your application’s Overview page. |
Further Reading
Additional helpful documentation, links, and articles: