Search profiles
Go to APM > Profiles and select a service to view its profiles.
You can filter according to infrastructure tags or application tags set up from your environment tracing configuration. By default the following facets are available:
| Facet | Definition |
|---|
| Env | The environment your application is running on (production, staging). |
| Service | The name of the service your code is running. |
| Version | The version of your code. |
| Host | The hostname your profiled process is running on. |
| Runtime | The type of runtime the profiled process is running (JVM, CPython). |
Visualizations
Flame graph
The flame graph is the default visualization for Continuous Profiler. The one below shows how much CPU each method used and how each method was called. Other Profile types are available depending on the language.
For example, starting from the first row in the previous image, Thread.run() called Thread.runWith(Object, Runnable), which called ThreadPoolExecutor$Worker.run(), and so on.
The width of a frame represents how much of the total CPU it consumed. On the right, you can see a CPU time by Method top list that only accounts for self time, which is the time a method spent on CPU without calling another method.
By default, darker frames indicate higher CPU usage, while lighter frames signify lower usage; the most resource-intensive methods are grouped on the leftmost side of the flame graph.
Flame graphs can be included in Dashboards and Notebooks with the Profiling Flame Graph Widget.
Timeline view
The timeline view is equivalent to the flame graph, with time-based patterns and work distribution over the period of a single profile, a single process in profiling explorer and a trace.
Compared to the flame graph, the timeline view can help you:
- Isolate spiky methods
- Sort out complex interactions between threads
- Surface runtime activity that impacted the process
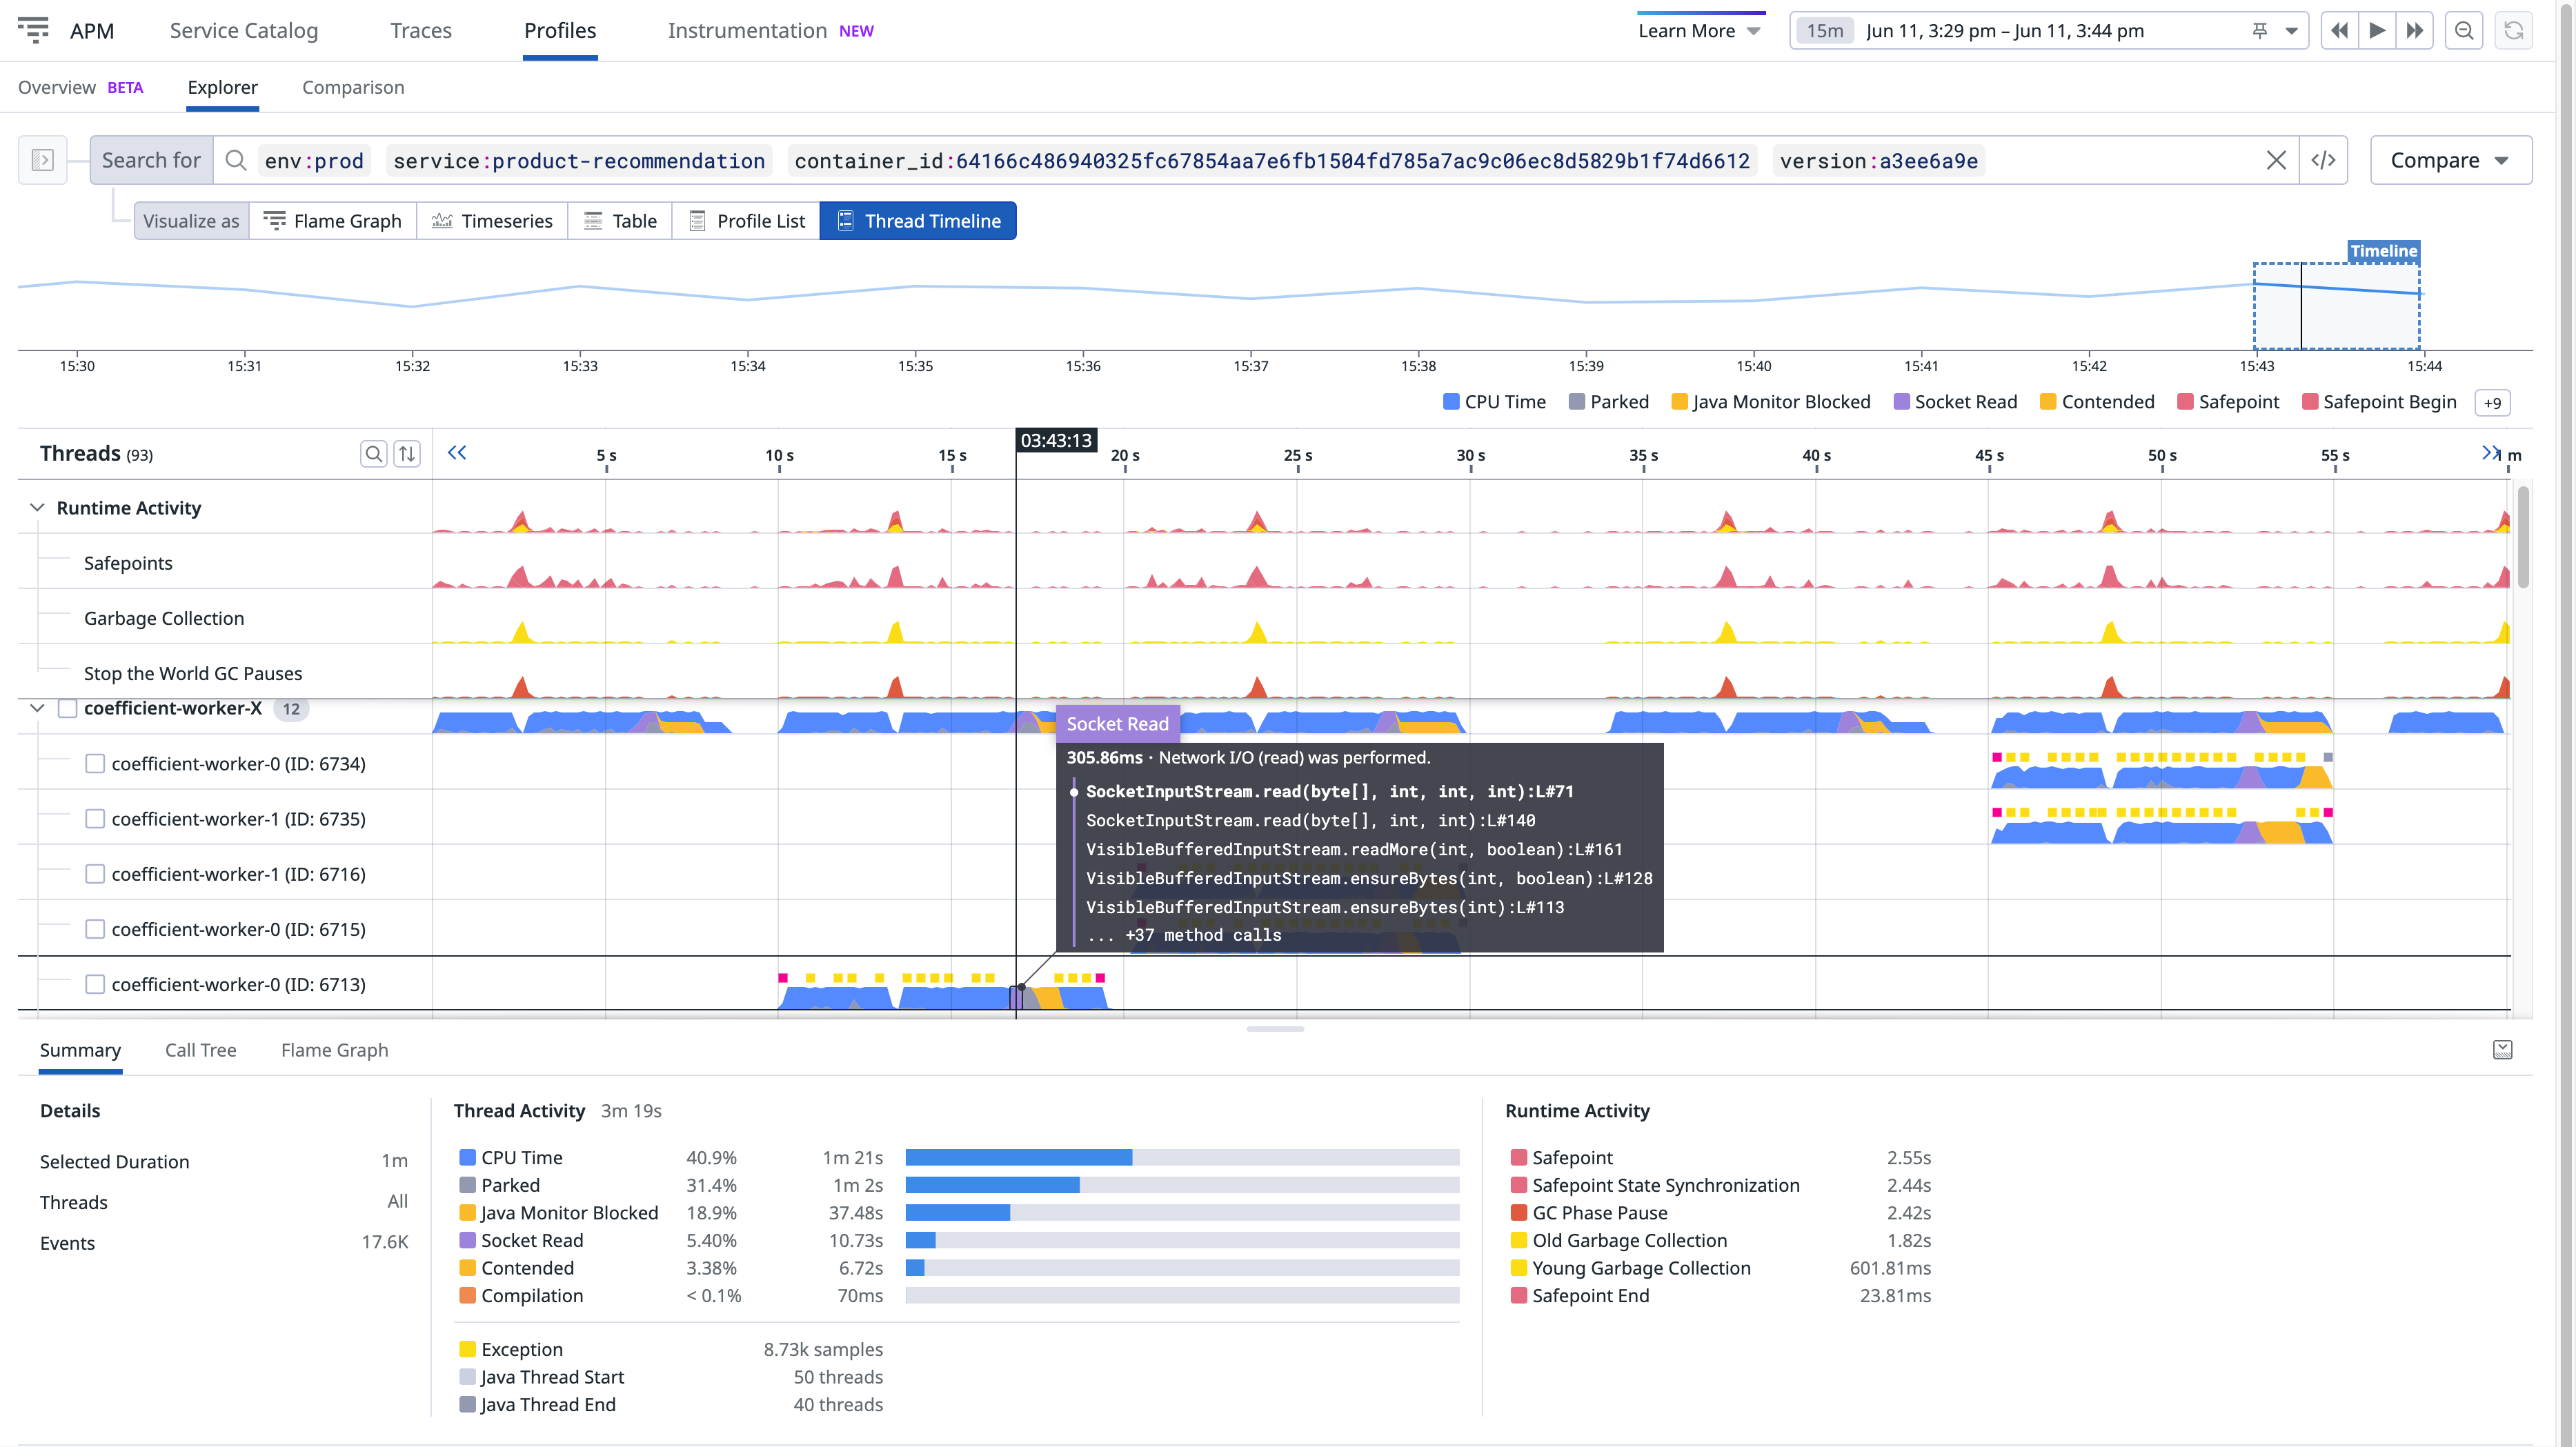
To access the timeline view:
- Go to APM > Profiles > Explorer.
- Set the Visualize as option to Thread Timeline.
Depending on the runtime and language, the timeline lanes vary:
Each lane represents a thread. Threads from a common pool are grouped together. You can expand the pool to view details for each thread.
Lanes on top are runtime activities that may impact performance.
For additional information about debugging slow p95 requests or timeouts using the timeline, see the blog post Understanding Request Latency with Profiling.
See prerequisites to learn how to enable this feature for Python.
Each lane represents a thread. Threads from a common pool are grouped together. You can expand the pool to view details for each thread.
See prerequisites to learn how to enable this feature for Go.
Each lane represents a goroutine. Goroutines created by the same go statement are grouped together. You can expand the group to view details for each goroutine.
Lanes on top are runtime activities that may impact performance.
For additional information about debugging slow p95 requests or timeouts using the timeline, see the blog post Debug Go Request Latency with Datadog’s Profiling Timeline.
See prerequisites to learn how to enable this feature for Ruby.
Each lane represents a thread. Threads from a common pool are grouped together. You can expand the pool to view details for each thread.
The thread ID is shown as native-thread-id (ruby-object-id) where the native thread ID is Thread#native_thread_id (when available) and the Ruby object ID is Thread#object_id.
Note: The Ruby VM or your operating system might reuse native thread IDs.
See prerequisites to learn how to enable this feature for Node.js.
There is one lane for the JavaScript thread.
There can also be lanes visualizing various kinds of asynchronous activity consisting of DNS requests and TCP connect operations. The number of lanes matches
the maximum concurrency of these activities so they can be visualized without overlaps.
Lanes on the top are garbage collector runtime activities that may add extra latency to your request.
Each lane represents a thread. Threads with the same name are grouped together. You can expand a group to view details for each thread. Note that threads that are explicitly created by code are grouped under Managed Threads.
Lanes on top are runtime activities that may impact performance such as GC activity.
The thread ID is shown as <unique-id> [#OS-thread-id].
Note: Your operating system might reuse thread IDs.
See prerequisites to learn how to enable this feature for PHP.
There is one lane for each PHP thread (in PHP NTS, this is only one lane as there is only one thread per process).
Fibers that run in this thread are represented in the same lane.
Lanes on the top are runtime activities that may add extra latency to your request, due to file compilation and garbage collection.
Timeline view is currently not supported for Full Host profiling
Timeseries and Table
For each runtime, there is a broad set of metrics available, which you can see listed by timeseries.
Call graph
The call graph takes the same profiling data used in flame graphs, but displays each method just once, as a single node, with edges used to convey which methods have called each other.
Edge thickness is used to show time spent calling other methods, while color and size indicate self time.
Single profile
By default, profiles are uploaded once a minute. Depending on the language, these processes are profiled between 15 and 60 seconds.
To view a specific profile, set the Visualize as option to Profile List and click an item in the list:
The header contains information associated with your profile, like the service that generated it, or the environment and code version associated with it.
Four tabs are below the profile header:
| Tab | Definition |
|---|
| Profiles | A flame graph and summary table of the profile you are looking at. You can switch between profile types (for example, CPU, Memory allocation). |
| Insights | A set of heuristics that suggest potential issues or areas of improvement in your code. |
| Metrics | Profiler metrics coming from all profiles of the same service. |
| Runtime Info | Runtime properties in supported languages, and profile tags. |
| Related Processes | Processes related to the profile. |
Note: In the upper right corner of each profile, there are options to:
- Compare this profile with others
- View repository commit
- View traces for the same process and time frame
- Download the profile
- Open the profile in full page
Further Reading
Additional helpful documentation, links, and articles: