- Agents
- Essentials
- Getting Started
- Agent
- API
- APM Tracing
- Containers
- Dashboards
- Database Monitoring
- Datadog
- Datadog Site
- DevSecOps
- Incident Management
- Integrations
- Internal Developer Portal
- Logs
- Monitors
- Notebooks
- OpenTelemetry
- Profiler
- Search
- Session Replay
- Security
- Serverless for AWS Lambda
- Software Delivery
- Synthetic Monitoring and Testing
- Tags
- Workflow Automation
- Learning Center
- Support
- Glossary
- Standard Attributes
- Guides
- Agent
- Integrations
- Extend Datadog
- Authorization
- DogStatsD
- Custom Checks
- Integrations
- Build an Integration with Datadog
- Create an Agent-based Integration
- Create an API-based Integration
- Create a Log Pipeline
- Integration Assets Reference
- Build a Marketplace Offering
- Create an Integration Dashboard
- Create a Monitor Template
- Create a Cloud SIEM Detection Rule
- Install Agent Integration Developer Tool
- Service Checks
- Community
- Guides
- OpenTelemetry
- Administrator's Guide
- API
- Partners
- Datadog Mobile App
- DDSQL Reference
- CoScreen
- CoTerm
- Remote Configuration
- Cloudcraft (Standalone)
- In The App
- Dashboards
- Notebooks
- DDSQL Editor
- Reference Tables
- Sheets
- Monitors and Alerting
- Service Level Objectives
- Metrics
- Watchdog
- Bits AI
- Internal Developer Portal
- Error Tracking
- Change Tracking
- Event Management
- Incident Response
- Actions & Remediations
- Infrastructure
- Cloudcraft
- Resource Catalog
- Universal Service Monitoring
- End User Device Monitoring
- Hosts
- Containers
- Processes
- Serverless
- Network Monitoring
- Storage Management
- Cloud Cost
- Application Performance
- APM
- Continuous Profiler
- Database Monitoring
- Agent Integration Overhead
- Setup Architectures
- Setting Up Postgres
- Setting Up MySQL
- Setting Up SQL Server
- Setting Up Oracle
- Setting Up Amazon DocumentDB
- Setting Up MongoDB
- Setting Up ClickHouse
- Connecting DBM and Traces
- Data Collected
- Exploring Database Hosts
- Exploring Query Metrics
- Exploring Query Samples
- Exploring Database Schemas
- Exploring Recommendations
- Troubleshooting
- Guides
- Data Streams Monitoring
- Data Observability
- Digital Experience
- Real User Monitoring
- Synthetic Testing and Monitoring
- Continuous Testing
- Experiments
- Product Analytics
- Session Replay
- Software Delivery
- CI Visibility
- CD Visibility
- Deployment Gates
- Test Optimization
- Code Coverage
- PR Gates
- DORA Metrics
- Feature Flags
- Developer Integrations
- Security
- Security Overview
- Cloud SIEM
- Code Security
- Cloud Security
- App and API Protection
- AI Guard
- Workload Protection
- Sensitive Data Scanner
- AI Observability
- Log Management
- Observability Pipelines
- Configuration
- Sources
- Processors
- Destinations
- Amazon OpenSearch
- Amazon S3
- Amazon Security Lake
- Azure Storage
- CrowdStrike NG-SIEM
- Datadog Archives
- Datadog CloudPrem
- Datadog Logs
- Datadog Metrics
- Elasticsearch
- Google Cloud Storage
- Google Pub/Sub
- Google SecOps
- HTTP Client
- Kafka
- Microsoft Sentinel
- New Relic
- OpenSearch
- SentinelOne
- Socket
- Splunk HEC
- Sumo Logic Hosted Collector
- Syslog
- Packs
- Akamai CDN
- Amazon CloudFront
- Amazon VPC Flow Logs
- AWS Application Load Balancer Logs
- AWS CloudTrail
- AWS Elastic Load Balancer Logs
- AWS Network Load Balancer Logs
- Cisco ASA
- Cloudflare
- F5
- Fastly
- Fortinet Firewall
- HAProxy Ingress
- Istio Proxy
- Juniper SRX Firewall Traffic Logs
- Netskope
- NGINX
- Okta
- Palo Alto Firewall
- Windows XML
- ZScaler ZIA DNS
- Zscaler ZIA Firewall
- Zscaler ZIA Tunnel
- Zscaler ZIA Web Logs
- Search Syntax
- Scaling and Performance
- Monitoring and Troubleshooting
- Guides and Resources
- Log Management
- CloudPrem
- Administration
Solve Memory Leaks with Profiling
Overview
Profiling has several datasets to help solve memory leaks, such as the Heap profile type, which is available for multiple languages.
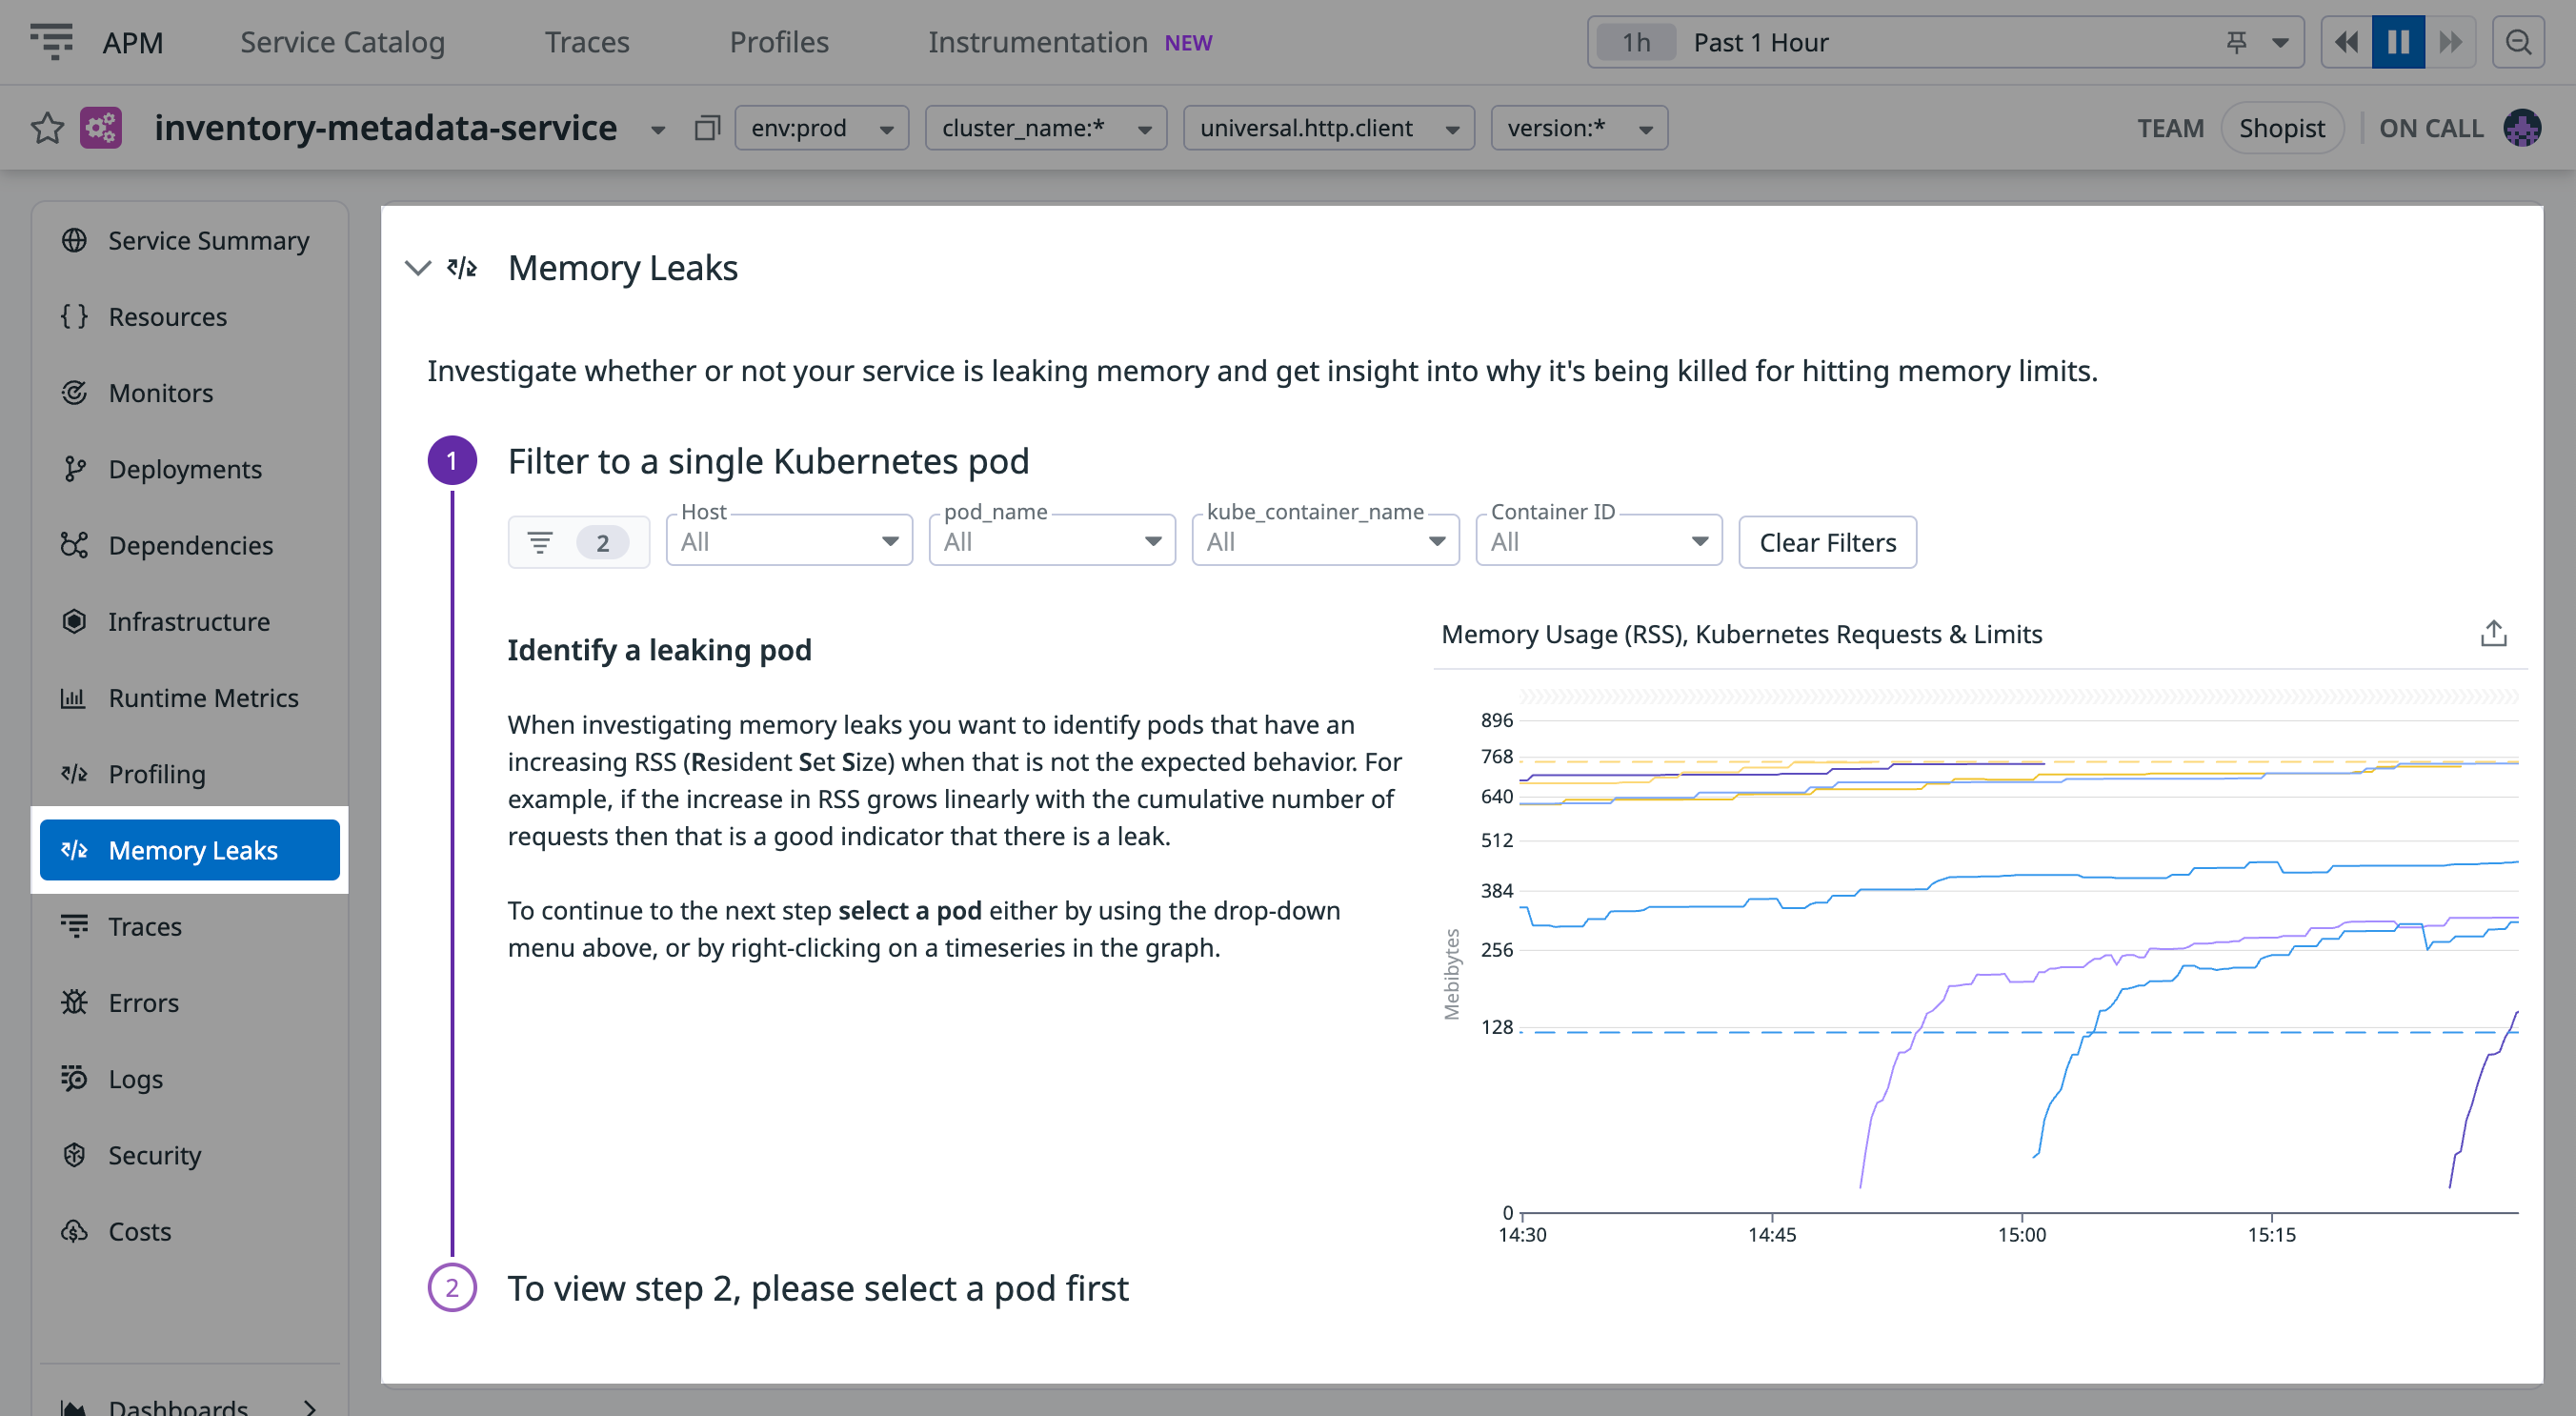
To help you get started, Datadog provides an end-to-end, guided walkthrough for your service within the APM service page:
What to expect
Following this walkthrough requires zero prior knowledge, and it is accessible for first-time investigations.
The walkthrough guides you through several steps to:
- Scope to the relevant data.
- Recommend Datadog integrations and upgrades that assist in the investigation.
- Explain how memory management works in your runtime.
- Confirm potential memory leaks by inspecting retained objects using profile comparisons.
Requirements
To use this walkthrough, you need:
- A containerized service with either the Datadog Kubernetes integration or the Datadog Container integration installed.
- Continuous Profiler enabled.
- Ensure that your profiles are tagged with
container_id. This is necessary to link between container memory utilization metrics and profiling data. - For Java (Enabling the heap class histogram collection) and .NET (Heap snapshot) ensure that heap profiling is enabled so that heap data is available for analysis.
- Ensure that your profiles are tagged with
Get started
To investigate a memory leak using the guided walkthrough:
- Go to APM > Software Catalog.
- Hover over the service you want to investigate and click Service Page.
- Click the Memory Leaks tab.
- Follow the guided steps to complete your investigation.
Further reading
Additional helpful documentation, links, and articles:

