- Essentials
- Getting Started
- Agent
- API
- APM Tracing
- Containers
- Dashboards
- Database Monitoring
- Datadog
- Datadog Site
- DevSecOps
- Incident Management
- Integrations
- Internal Developer Portal
- Logs
- Monitors
- Notebooks
- OpenTelemetry
- Profiler
- Search
- Session Replay
- Security
- Serverless for AWS Lambda
- Software Delivery
- Synthetic Monitoring and Testing
- Tags
- Workflow Automation
- Learning Center
- Support
- Glossary
- Standard Attributes
- Guides
- Agent
- Integrations
- Developers
- Authorization
- DogStatsD
- Custom Checks
- Integrations
- Build an Integration with Datadog
- Create an Agent-based Integration
- Create an API-based Integration
- Create a Log Pipeline
- Integration Assets Reference
- Build a Marketplace Offering
- Create an Integration Dashboard
- Create a Monitor Template
- Create a Cloud SIEM Detection Rule
- Install Agent Integration Developer Tool
- Service Checks
- IDE Plugins
- Community
- Guides
- OpenTelemetry
- Administrator's Guide
- API
- Partners
- Datadog Mobile App
- DDSQL Reference
- CoScreen
- CoTerm
- Remote Configuration
- Cloudcraft (Standalone)
- In The App
- Dashboards
- Notebooks
- DDSQL Editor
- Reference Tables
- Sheets
- Monitors and Alerting
- Service Level Objectives
- Metrics
- Watchdog
- Bits AI
- Internal Developer Portal
- Error Tracking
- Change Tracking
- Event Management
- Incident Response
- Actions & Remediations
- Infrastructure
- Cloudcraft
- Resource Catalog
- Universal Service Monitoring
- End User Device Monitoring
- Hosts
- Containers
- Processes
- Serverless
- Network Monitoring
- Storage Management
- Cloud Cost
- Application Performance
- APM
- Continuous Profiler
- Database Monitoring
- Agent Integration Overhead
- Setup Architectures
- Setting Up Postgres
- Setting Up MySQL
- Setting Up SQL Server
- Setting Up Oracle
- Setting Up Amazon DocumentDB
- Setting Up MongoDB
- Connecting DBM and Traces
- Data Collected
- Exploring Database Hosts
- Exploring Query Metrics
- Exploring Query Samples
- Exploring Database Schemas
- Exploring Recommendations
- Troubleshooting
- Guides
- Data Streams Monitoring
- Data Observability
- Digital Experience
- Real User Monitoring
- Synthetic Testing and Monitoring
- Continuous Testing
- Product Analytics
- Session Replay
- Software Delivery
- CI Visibility
- CD Visibility
- Deployment Gates
- Test Optimization
- Code Coverage
- PR Gates
- DORA Metrics
- Feature Flags
- Security
- Security Overview
- Cloud SIEM
- Code Security
- Cloud Security
- App and API Protection
- AI Guard
- Workload Protection
- Sensitive Data Scanner
- AI Observability
- Log Management
- Observability Pipelines
- Configuration
- Sources
- Processors
- Destinations
- Packs
- Akamai CDN
- Amazon CloudFront
- Amazon VPC Flow Logs
- AWS Application Load Balancer Logs
- AWS CloudTrail
- AWS Elastic Load Balancer Logs
- AWS Network Load Balancer Logs
- Cisco ASA
- Cloudflare
- F5
- Fastly
- Fortinet Firewall
- HAProxy Ingress
- Istio Proxy
- Juniper SRX Firewall Traffic Logs
- Netskope
- NGINX
- Okta
- Palo Alto Firewall
- Windows XML
- ZScaler ZIA DNS
- Zscaler ZIA Firewall
- Zscaler ZIA Tunnel
- Zscaler ZIA Web Logs
- Search Syntax
- Scaling and Performance
- Monitoring and Troubleshooting
- Guides and Resources
- Log Management
- CloudPrem
- Administration
Isolate Outliers in Monolithic Services
Overview
When investigating the performance of a monolithic application–that is, a single service that has multiple uses–you usually need to find which parts of the code base are using the most resources. The APM Service page showing top endpoints might be a logical first place to look, but the data there is focused on the number of requests and their duration, not the impact those requests have on compute resources available on your backend.
Instead, use the Continuous Profiler to filter flame graphs by endpoint usage. This allows you to identify the top resource-consuming endpoints and examine which functions use the most resources for each particular endpoint.
This guide describes how to use the Datadog Continuous Profiler to investigate these kinds of problems.
CPU bursts
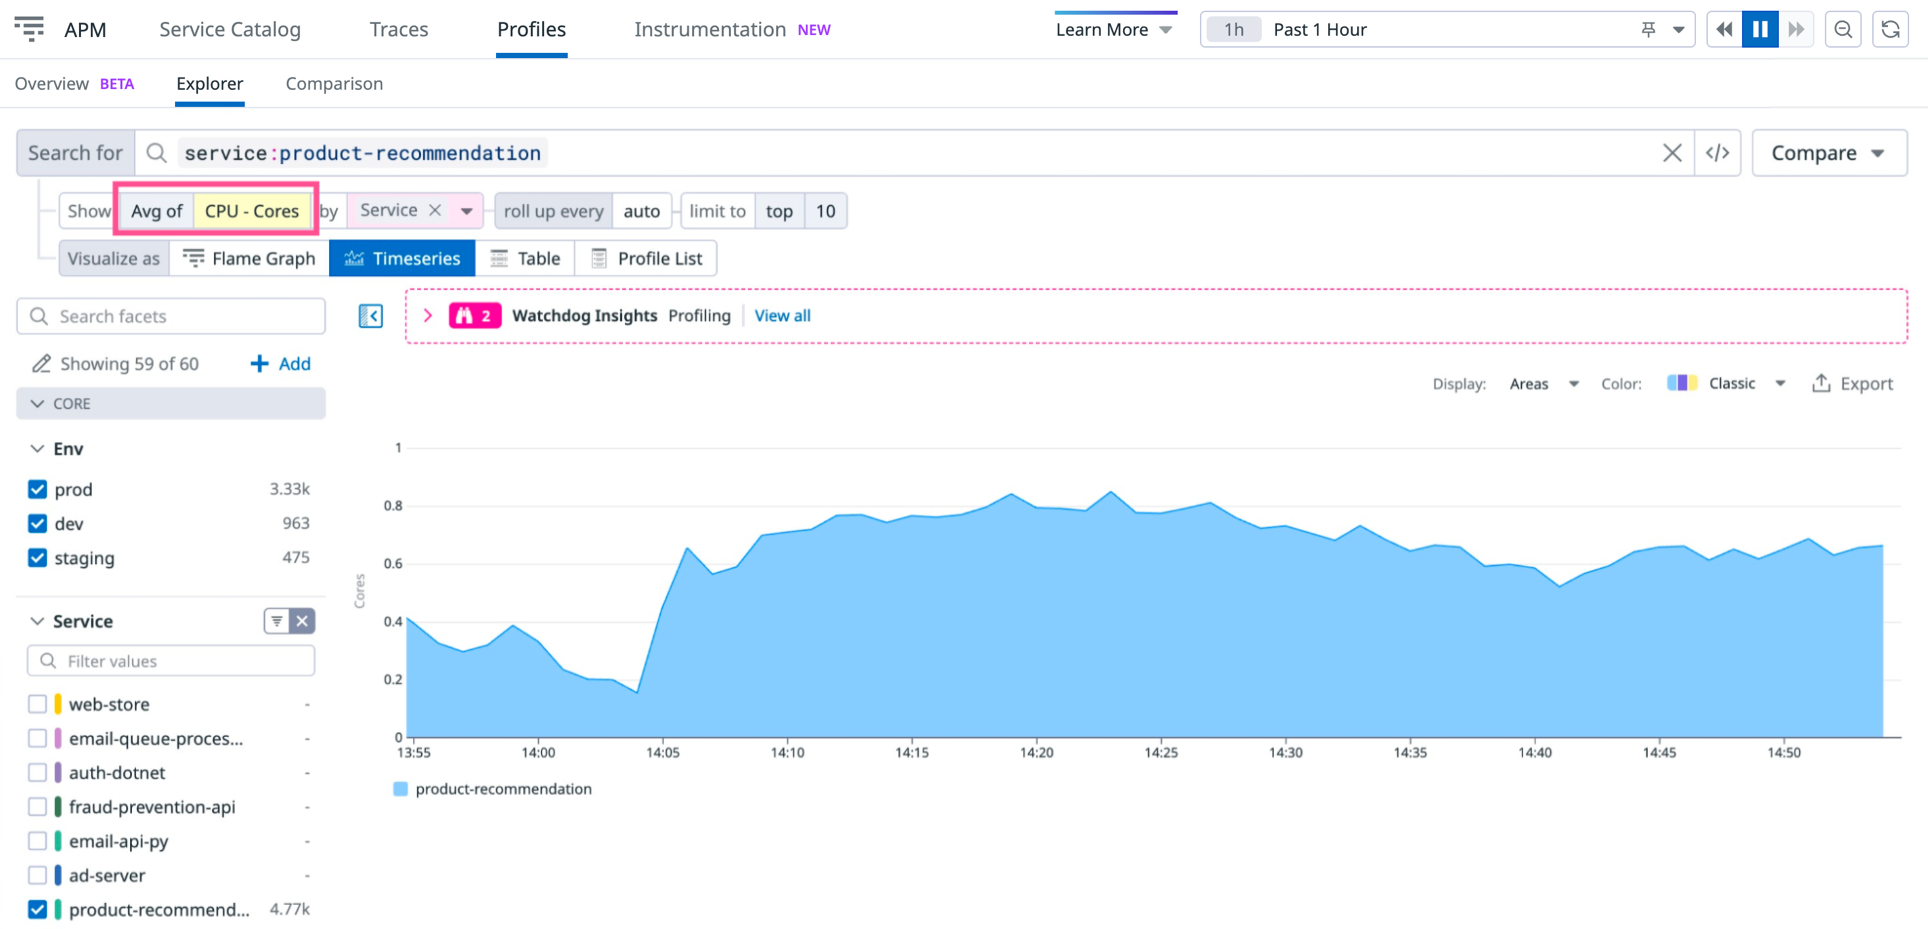
The first step in a performance investigation is to identify anomalies in resource usage over time. Consider the following graph of CPU utilization over the past hour for the service product-recommendation:
This doesn’t provide the exact root cause, but you can see anomalous peaks in CPU usage.
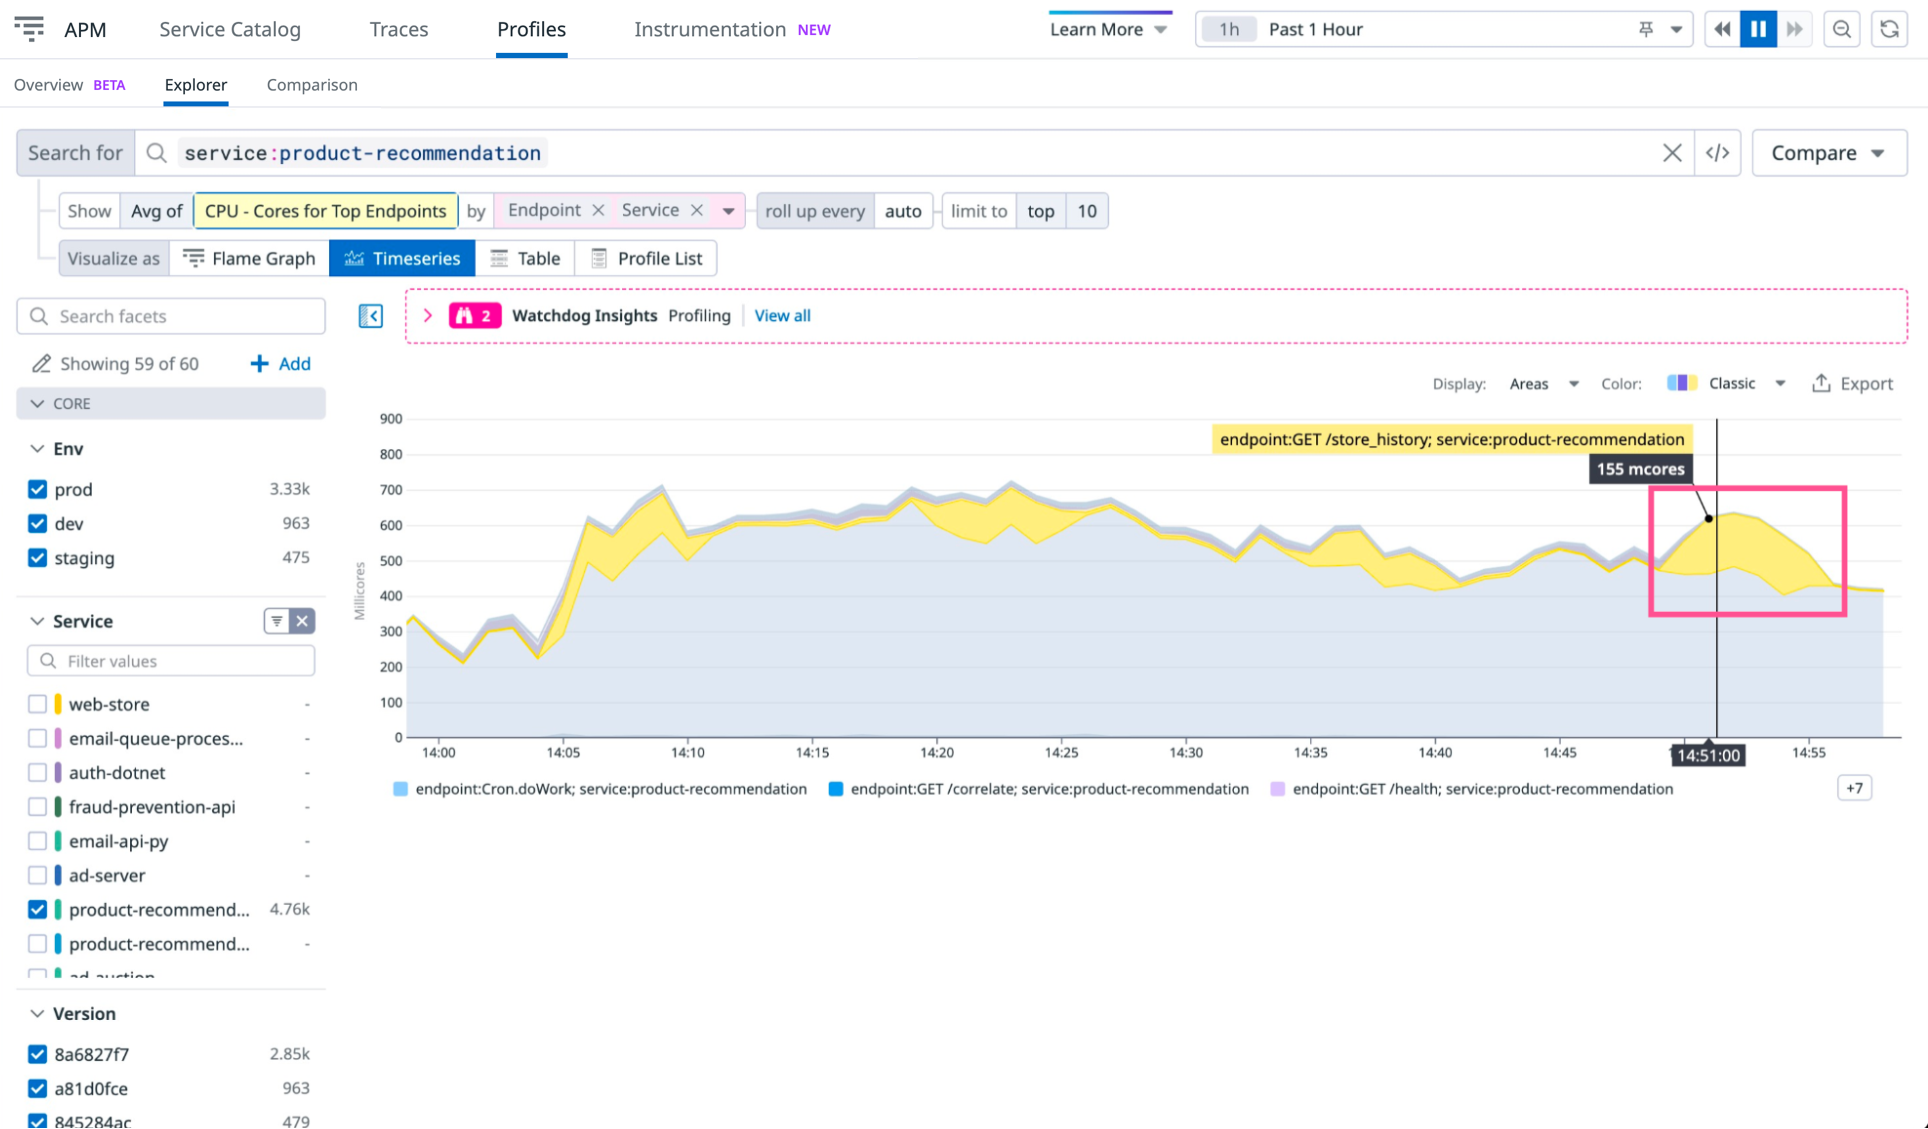
Select the Show - Avg of dropdown (highlighted in the previous image) and change the graph to show CPU Cores for Top Endpoints instead. This graph shows how different parts of the application contribute to the overall CPU utilization:
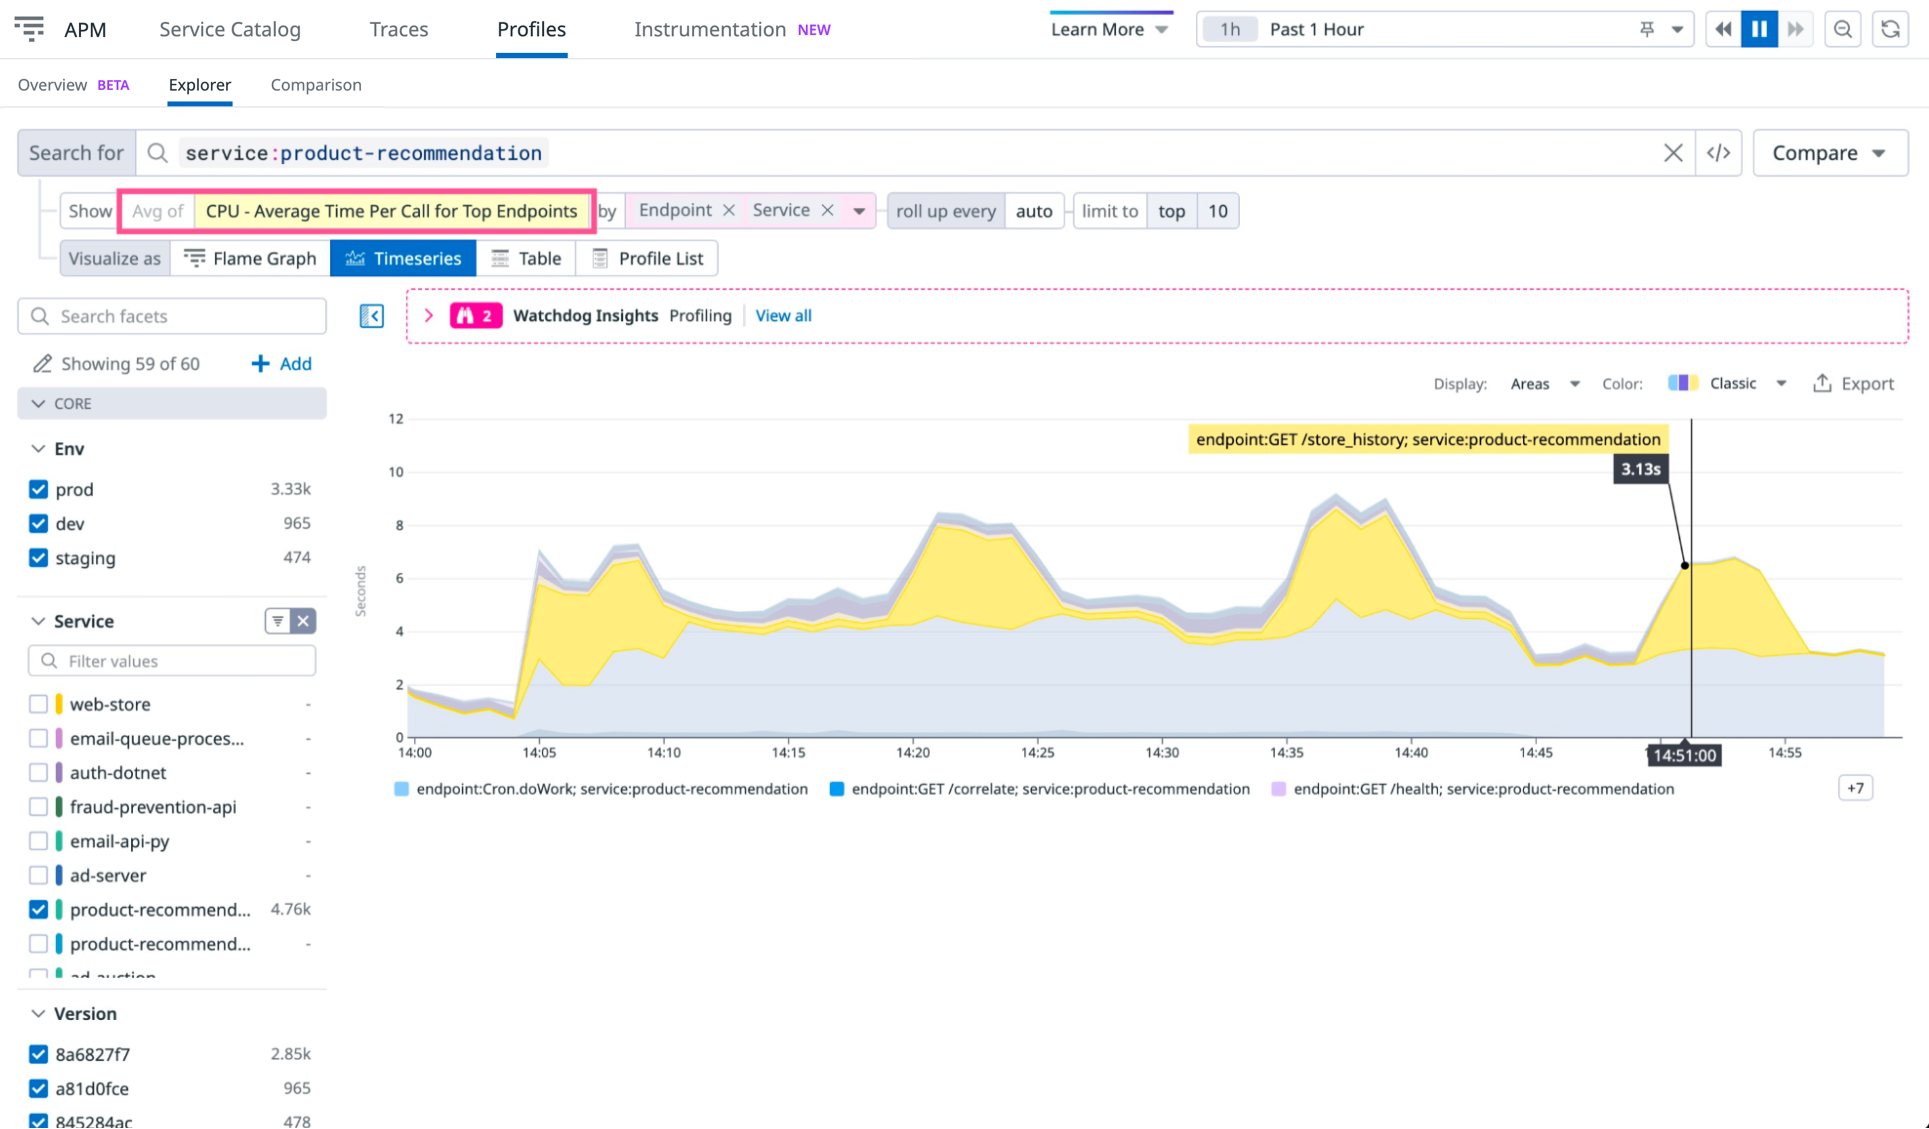
The yellow peaks indicate that the GET /store_history endpoint has some intermittent usage corresponding to the anomalies identified earlier. However, the peaks might be due to differences in traffic to that endpoint. To understand if profiles can provide further insights, change the metric to CPU - Average Time Per Call for Top Endpoints:
The updated graph reveals that there is an intermittent spike in CPU utilization where each call to GET /store_history takes on average three seconds of CPU time. This suggests the spikes aren’t due to an increase in traffic, but instead an increase in CPU usage per request.
Isolate the impact of endpoints
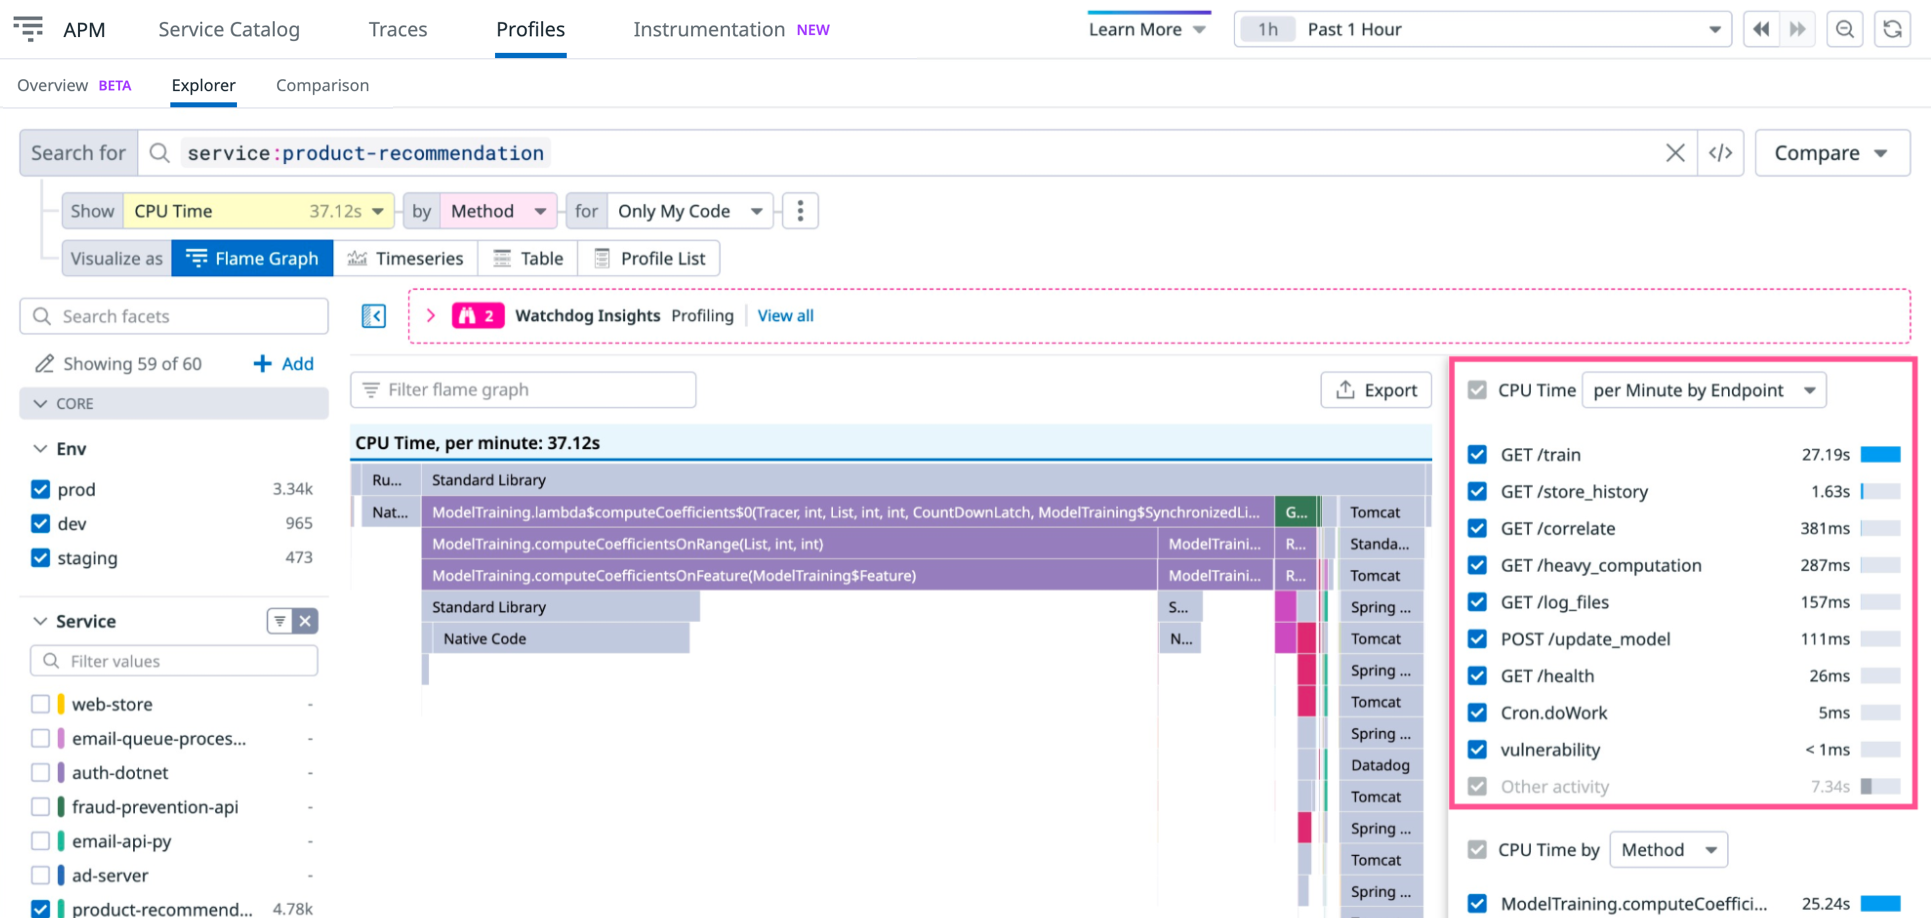
To determine the cause of increased CPU usage each time GET /store_history is called, examine the profiling flame graph for this endpoint during one of the spikes. Select a time range where GET /store_history is showing more CPU utilization and scope the profiling page to that time range. Then switch to the Flame Graph visualization to see the methods using the CPU at this time:
To better understand why the GET /store_history endpoint is using more CPU, refer to the table highlighted in the previous image, where the endpoint is second from the top. Select that row to focus the flame graph on the CPU utilization caused by the GET /store_history endpoint.
Because you are investigating resource usage per request, also change the value in the dropdown at top of the table to CPU Time per Endpoint Call. This shows the average resource usage per call to that endpoint instead of the average resource usage per minute.
Comparing flame graphs
With the graph displaying data for the correct time and endpoint, you should have enough data to determine what is causing the spike in CPU utilization. If you’re still uncertain, you can compare the flame graph for the spike with a time when utilization was more acceptable.
To see if there are differences in which methods are using a lot of CPU time between a spike and normal usage, click Compare (next to the search field) and select Previous 15 minutes. This opens the Comparison view.
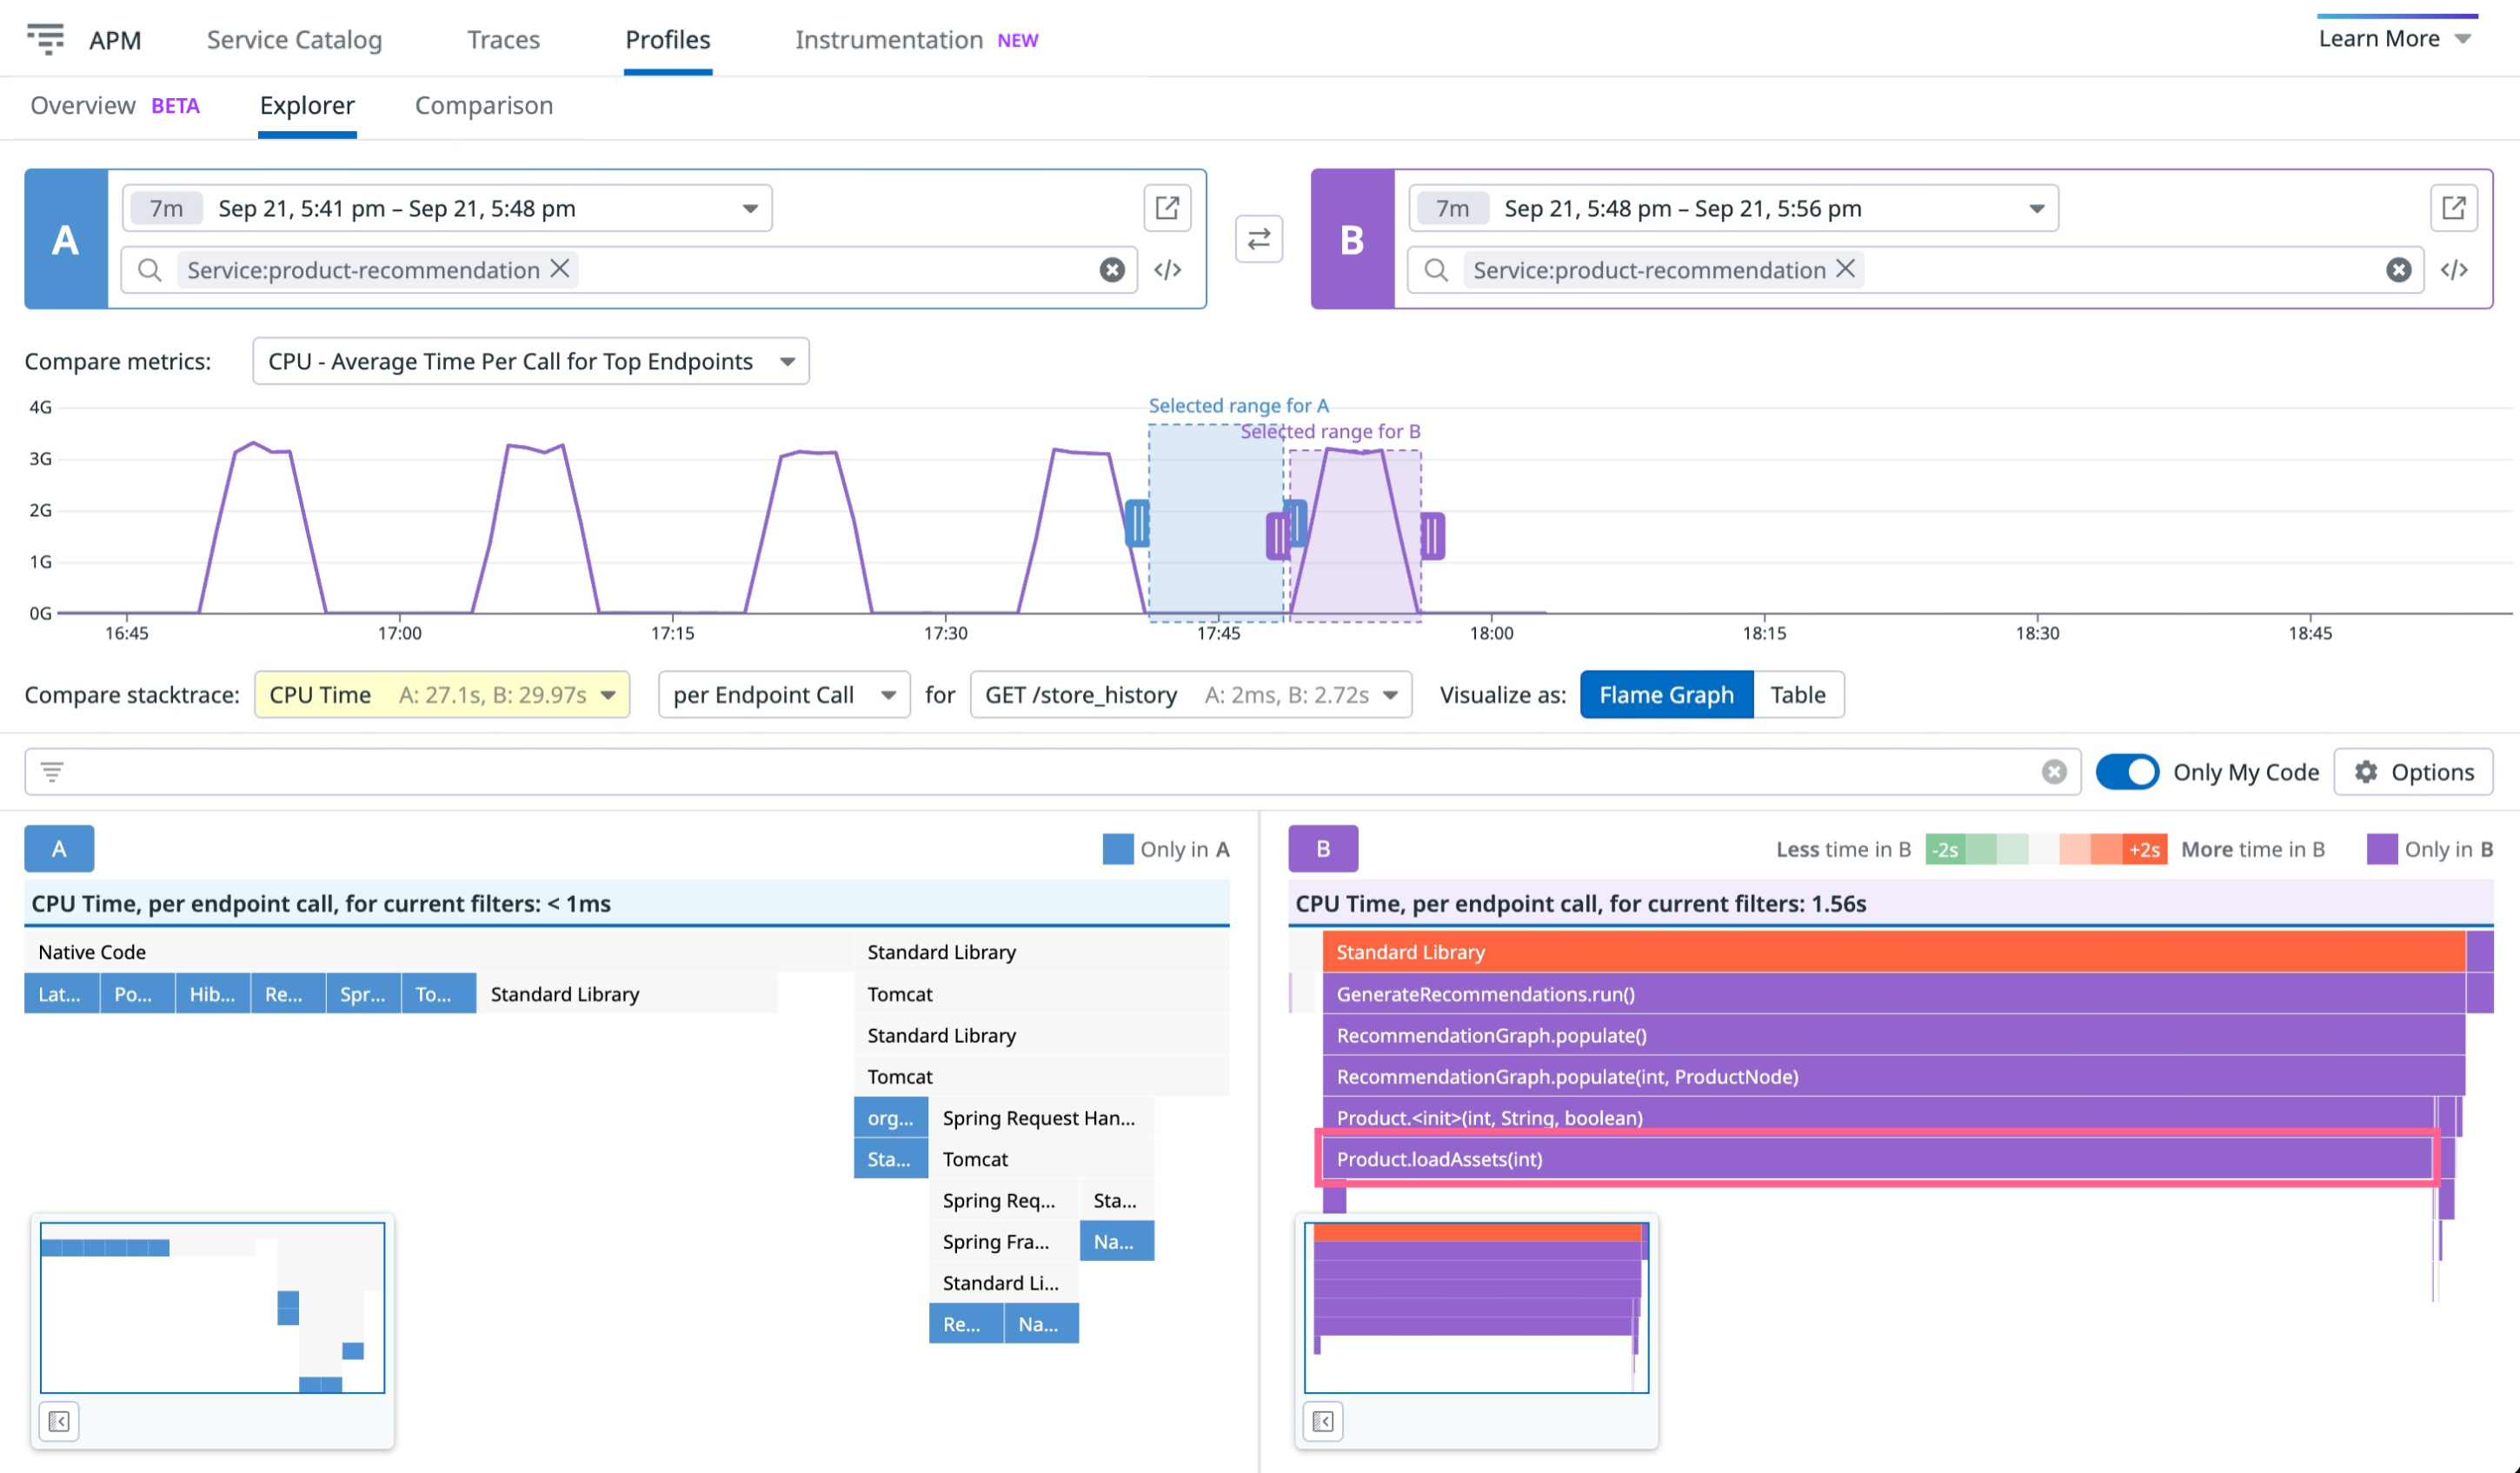
The view shows two graphs, labeled A and B, each representing a time range for CPU utilization per GET /store_history call. Adjust the time selector for A so that it is scoped to a period with low CPU utilization per call:
The comparison reveals the different methods causing CPU utilization during the spike (timeframe B) that are not used during normal CPU usage (timeframe A). As shown in the previous image,Product.loadAssets(int), is causing the spikes.
To fix the problem, optimize the method. Looking at the method code, the signature is Product(int id, String name, boolean shouldLoadAssets) and you do not need to load assets for the response to the GET /store_history endpoint. This implies that there is a bug further up the call stack that improperly instructs the Product constructor to load assets.
Fix that bug and verify that the spikes go away, using the timeseries graphs discussed earlier.
Isolate the impact of operations (Java)
There are other attributes available in the profiler. For example, you can filter and group a flame graph by operation names, rather than by functions or threads. For monolithic applications, this can more clearly identify CPU-intensive resources, even if they are shared between endpoints.
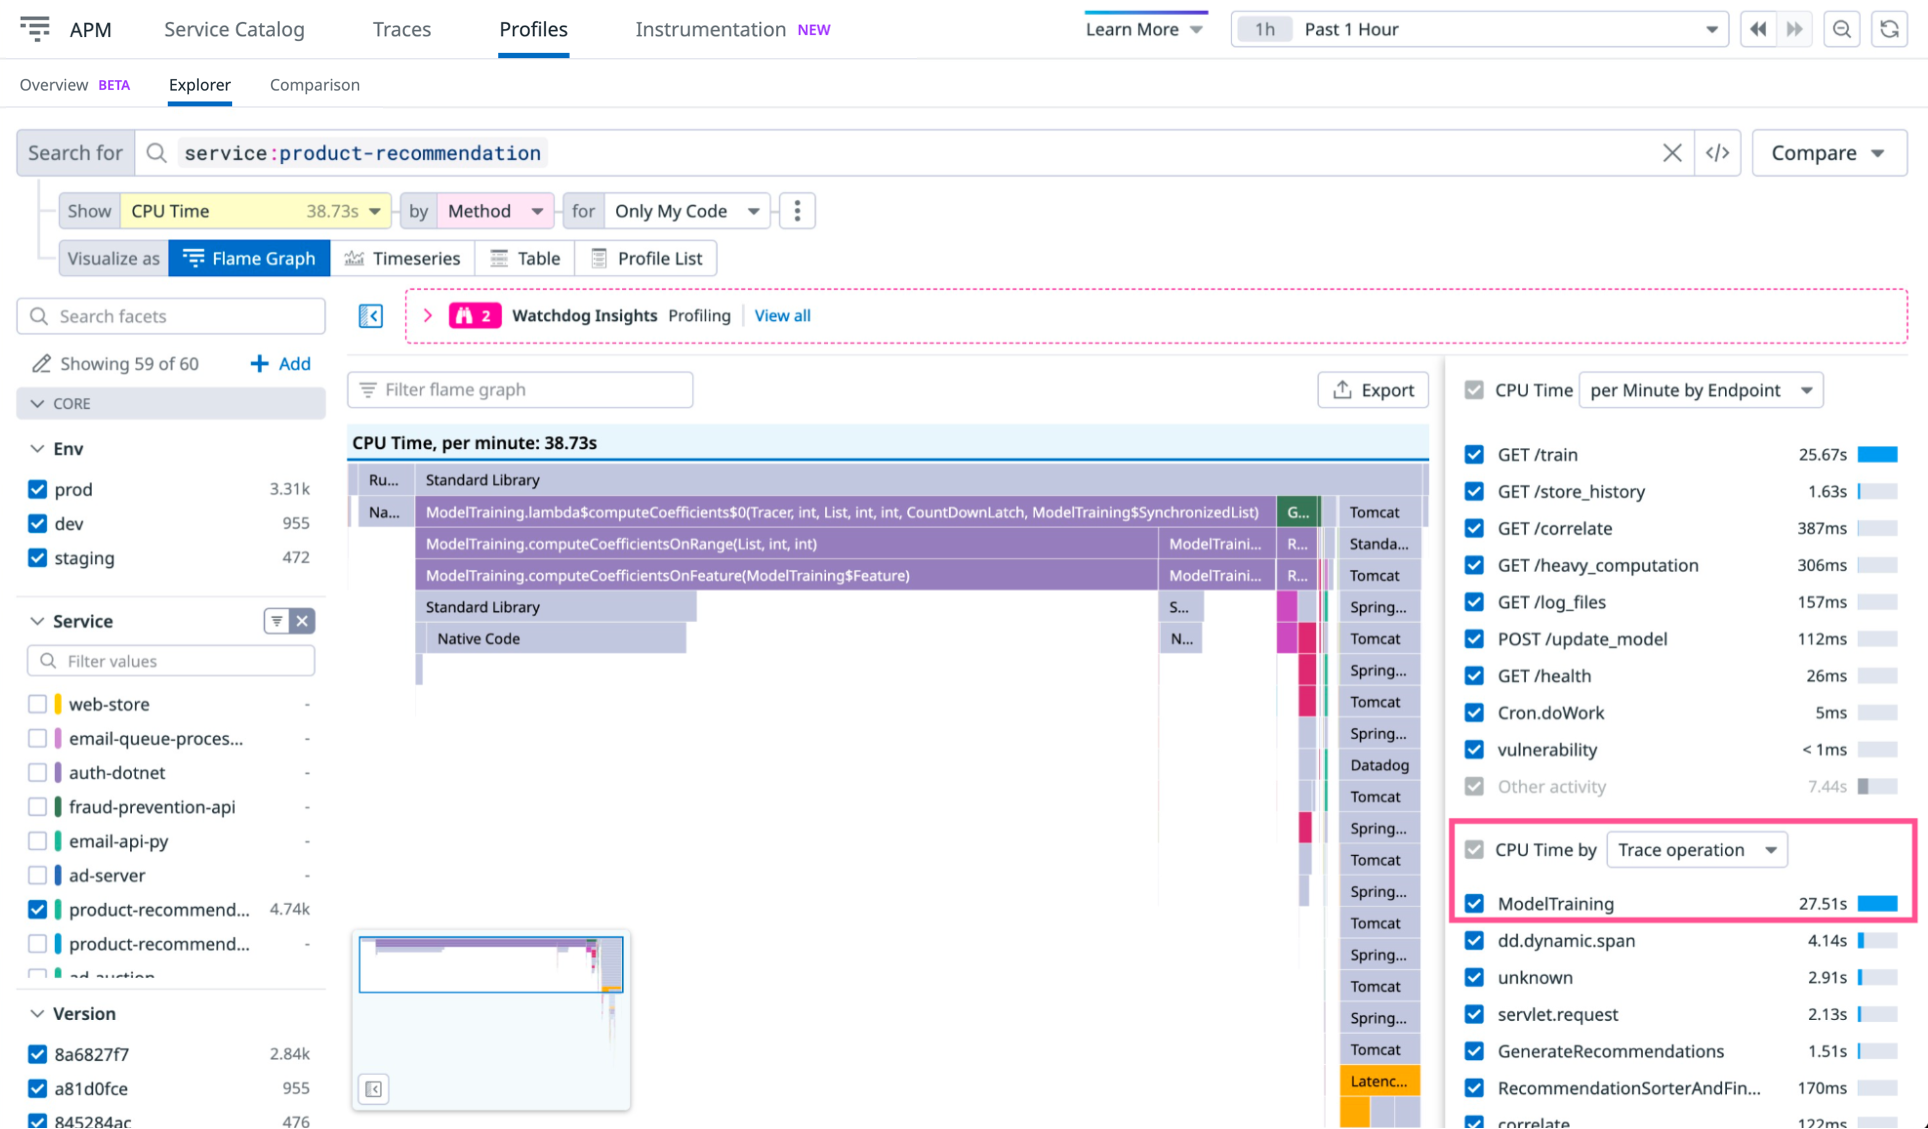
The APM Trace operation attribute lets you filter and group a flame graph with the same granularity as the traces for the selected endpoints. This is a good balance between the high granularity of threads or methods, and the low granularity of entire endpoints. To isolate operations, select Trace Operation from the CPU time by dropdown:
In the previous image, notice that the ModelTraining operation is taking more CPU time than its primary use in the GET /train endpoint, so it must be used elsewhere. Click the operation name to determine where else it is used. In this case, ModelTraining is also use by POST /update_model.
Isolate your own business logic
Endpoint and operation isolation is available in your profiles by default, but you may want to isolate a different piece of logic. For example, if the monolith is sensitive to specific customers, you can add a custom filter to the profiles:
Set a context value for the customer name like so:
try (var scope = Profiling.get().newScope()) {
   scope.setContextValue("customer_name", <the customer name value>);
   <logic goes here>
}
To specify which label keys you want to use for filtering, set the profiling.context.attributes configuration with one of the following:
- Environment variable:
DD_PROFILING_CONTEXT_ATTRIBUTES=customer_name - System setting:
-Ddd.profiling.context.attributes=customer_name
If you have multiple context keys, use a comma-separated string for the configuration (for example,-Ddd.profiling.context.attributes=customer_name,customer_group).
Then, open CPU, Exceptions, or Wall Time profiles for your service and select the customer_name value you’re interested in under the CPU time by dropdown.
The Go profiler supports custom annotations for your business logic as of version v1.60.0. To add annotations, use profiler labels like so:
pprof.Do(ctx, pprof.Labels("customer_name", <value>), func(context.Context) {
  /* customer-specific logic here */
})
To specify which label keys you want to use for filtering, add the WithCustomProfilerLabelKeys (or WithCustomProfilerLabelKeys v1) option when starting the profiler:
profiler.Start(
  profiler.WithCustomProfilerLabelKeys("customer_name"),
  /* other options */
)
Then, open CPU or goroutine profiles for your service and select the customer_name value you’re interested in under the CPU time by dropdown.
Further reading
Additional helpful documentation, links, and articles:
