Overview
The Network Analytics page provides insights into your overall network health and shows recommended queries at the top of the page. These recommended queries enable you to run common queries and see snapshots of relevant metrics, so that you can see changes in throughput, latency, DNS errors, and more. Clicking on a recommended query automatically populates the search bar, group bys, and summary graphs to provide you with relevant insights into your network.
Queries
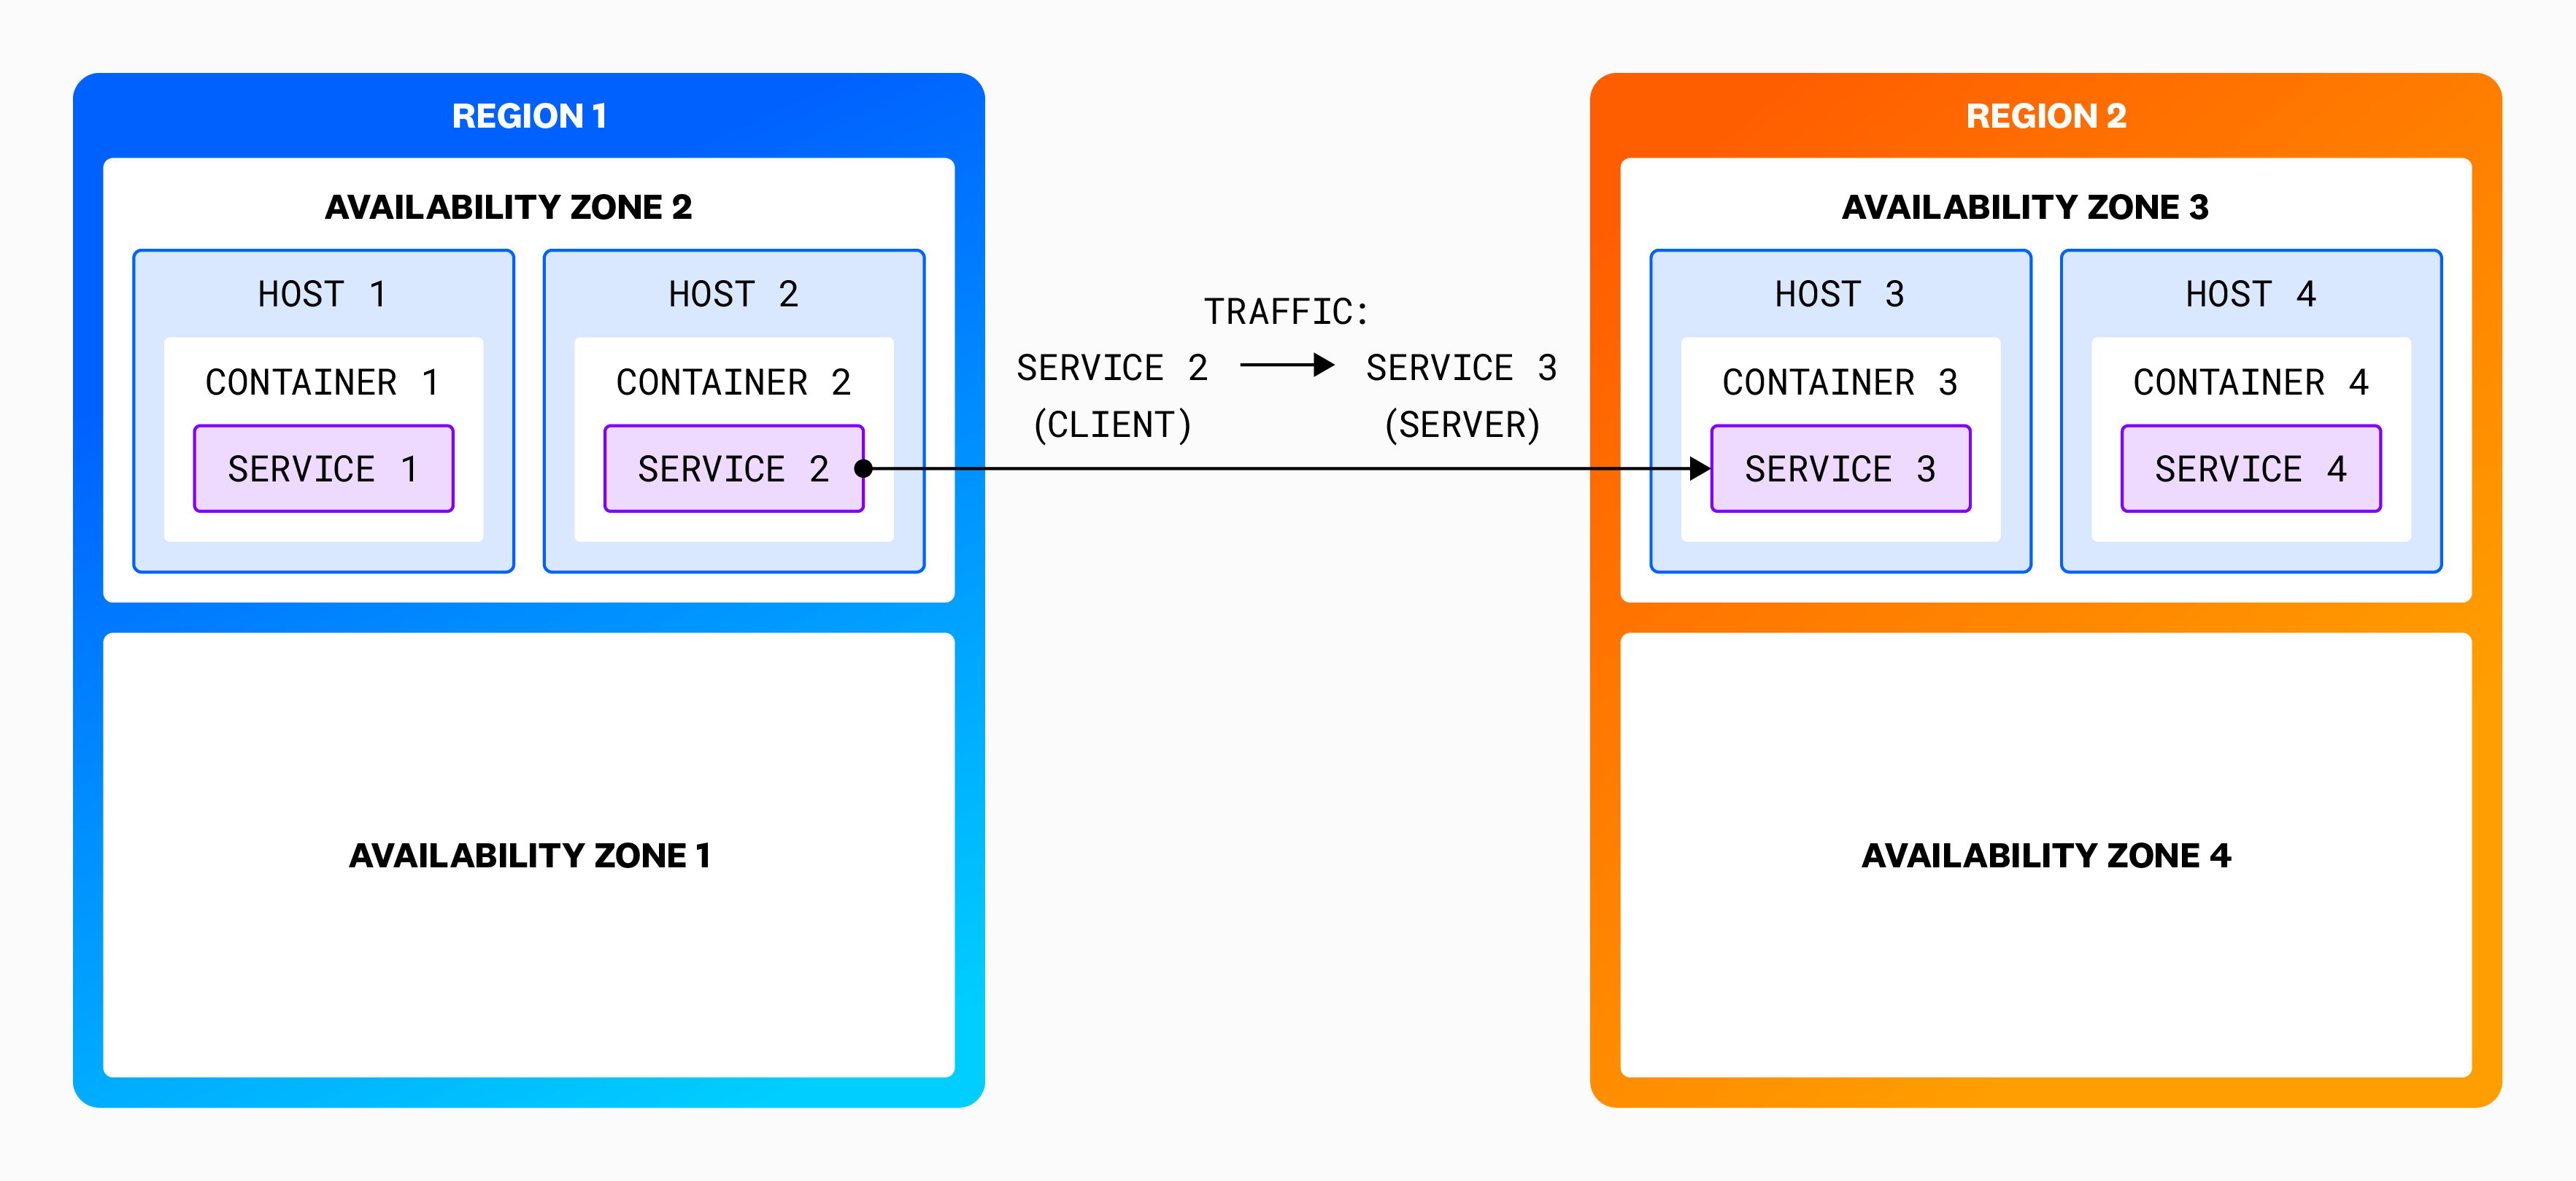
To refine your search to traffic between particular endpoints, aggregate and filter your network connections with tags. Tags from Datadog integrations or Unified Service Tagging can be used for aggregating and filtering automatically. When utilizing tagging in Network Monitoring, you can take advantage of how network traffic flows across availability zones for a particular service or for your entire infrastructure. Grouping by client and server tags visualizes the network flow between those two sets of tags.
Additionally, Datadog provides a list of default out-of-the-box tags that you can use to efficiently query and analyze the network traffic most relevant to your needs.
For example, if you want to see network traffic between your ordering service called orders-app and all of your availability zones, use client_service:orders-app in the search bar, and add the client_service and server_availability-zone tags in the Group By drop-down to visualize the traffic flow between these two sets of tags:
The default view aggregates the client and server by the service tag. Accordingly, each row in the table represents service-to-service aggregate connections when aggregated over a one hour time period. Select Auto-grouped traffic to see traffic bucketed into several commonly used tags such as service, kube_service, short_image, and container_name.
Note: For information on NA/Untagged traffic paths, see Unresolved traffic.
Understanding client and server roles in relation to traffic direction
The Network Analytics page shows directional traffic flows from clients in one zone to servers in another. These flows are not symmetrical and may not show equal “bytes sent” and “bytes received” when reversed.
In this context:
- Client refers to the side that initiates the connection.
- Server is the side that responds to that connection.
Datadog monitors traffic based on who opened the connection. The reverse direction (server to client) is shown as a separate flow and may have different volume metrics, or no data at all if no connections are initiated in that direction.
For example, if a client in us-east-1d talks to a server in us-east-1c, you may see significant traffic. However, if there is no server in us-east-1d, the reverse row (us-east-1c → us-east-1d) may show little or no data.
Note: Asymmetries in traffic can also result from application behavior or infrastructure elements (for example, proxies or NATs), or lack of connection initiation in one direction.
Recommended queries
Recommended queries allow you to begin investigating into your network—whether you’re troubleshooting a specific issue or gaining a better overall understanding of your network. The recommended queries help you find relevant network information without needing to search for or group the traffic. For example, the recommended query Find dependencies of service: web-store populates the search bar with the query client_service: web-store and displays the top services that the service web-store is sending traffic to within the network, and therefore its downstream dependencies.
Any available recommended queries are provided at the top of the Analytics page, and there are three recommended queries at the top of the DNS page. Use these queries to access commonly used data, and see any changes in that data in the last hour.
To run a recommended query, click on the tile. Hovering over the tile displays a description and summary of the data the query returns.
Facet panels
Use the facet panels to browse all available tags on your flows or filter traffic without needing to remember exact tag names. Facet panels mirror the tags in your search bar query. Use the Client and Server tabs to switch between facet panels.
Custom facets
Aggregate and filter your traffic data by any tags on the network analytics page. A list of included tags is located on the left side of the screen under the Client and Server tabs, and in the Group By dropdown menu.
Include listed tags are service, availability zone, env, environment, pod, host, ip, and port, among others. If you want to aggregate or filter traffic by a tag that is not already in the menu, add it as a custom Facet:
- Select the + Add button on the top right of the facet panels.
- Enter the relevant tag you want to create a custom facet upon.
- Click Add.
After the custom facet is created, use this tag to filter and aggregate traffic on the network analytics page and network map. All custom facets can be viewed in the bottom Custom section of the facet panels.
Wildcard search
To perform a multi-character wildcard search, use the * symbol as follows:
client_service:web* matches all client services that start with web.client_service:*web matches all client services that end with web.client_service:*web* matches all client services that contain the string web.
Wildcard searches work within facets with this syntax. This query returns all the client services that end with the string “mongo”:
client_service:*mongo
To learn more, see the search syntax documentation.
Neutral tags are tags that are not specific to a client or server, and instead apply to an entire flow. You can search for and filter on traffic with these neutral tags. For example, you can use these tags to filter for traffic that is TLS encrypted.
For a complete list of neutral tags and their descriptions, see Neutral tags in the Tags Reference.
Group by
Groups allow you to group your data by a given tag’s value. For example, if you select a grouping such as host, results are grouped by individual hosts. Additionally, you may have large chunks of data that are not tagged by the grouping you’re interested in. In these situations, you can use Auto-grouped traffic to group data by whichever tags are available.
If you want to investigate connections from all of your hosts in a single grouping, add the client_host and Auto-Grouped-Servers tags in the Group By dropdown.
The Auto-grouped traffic option can help you identify the source of your tags. For example, hover over the individual icons to display a tooltip that indicates the tag’s origin:
Summary graphs
The summary graphs are a condensed view of your network, which you can modify to display volume, throughput, connections, or latency as needed. Display up to three summary graphs at a time, and change the data and visualization type to suit your organization. To update a graph’s data source, click on the graph’s title and make a selection from the dropdown menu.
To change the visualization type, click on the pencil icon in the top right corner of the graph. Select from the options available, as shown in the screenshot below.
To hide a specific graph, click on the hide graph icon next to the pencil icon. You can display as little as one graph or as many as three graphs. To add graphs, click on the plus icon + on the right side of the summary graph and select the graph to add. You can also reset the graphs to the default graphs when adding a new graph.
Table
The network table breaks down the Volume, Throughput, TCP Retransmits, Round-trip Time (RTT), and RTT variance metrics between each source and destination defined by your query.
You can configure the columns in your table using the Customize gear icon (⚙️) at the top right of the table.
Configure the traffic shown with the Filter Traffic button at the top right of the page.
External traffic (to public IPs) and Datadog Agent traffic is shown by default. To narrow down your view, you can choose to toggle off the Show Datadog Traffic and Show External Traffic toggles.
Unresolved traffic
Unresolved client and server tags are marked as N/A. A traffic client or server endpoint may be unresolved because it lacks identifiable metadata, such as source or destination information. This can occur when Datadog cannot resolve the traffic to known entities like load balancers, cloud services, or specific IP addresses within the monitored infrastructure. Typically, unresolved traffic may arise due to:
- The host or container client or server IPs are not tagged with the client or server tags used for traffic aggregation.
- The endpoint is outside of your private network, and accordingly is not tagged by the Datadog Agent.
- The endpoint is a firewall, service mesh or other entity where a Datadog Agent cannot be installed.
- The destination has not been tagged with a service, or an IP has not been mapped to any service.
Monitoring unresolved traffic is essential for identifying blind spots in network visibility and ensuring all relevant traffic is accounted for in performance and security analysis.
Use the Show N/A (Unresolved Traffic) toggle in the upper right corner of the data table to filter out aggregate connections with unresolved (N/A) clients or servers.
Pivot to network path
Click the three dots menu in the analytics table to pivot to network path and see the paths between the source and destination specified in CNM.
Saved views
Organize and share views of traffic data. Saved Views make debugging faster and empower collaboration. For instance, you can create a view, save it for the future for common queries, and copy its link to share network data with your teammates.
- To save a view: click the + Save button and name the view to record your current query, table configuration, and graph metric selections.
- To load a view: click Views at the top left to see your Saved Views and select a view from the list.
- To rename a view: hover over a view in the Saved Views list and click the gear icon to Edit name.
- To share a view: hover over a view in the Saved Views list and click the link icon to Copy permalink.
To learn more, see the Saved Views documentation.
Sidepanel
The sidepanel provides contextual telemetry to help you debug network dependencies. Use the Flows, Logs, Traces, and Processes tabs to determine whether a high retransmit count or latency in traffic between two endpoints is due to:
- A spike in traffic volume from a particular port or IP.
- Heavy processes consuming the CPU or memory of the destination endpoint.
- Application errors in the code of the client endpoint.
The top of the sidepanel displays common client and server tags shared by the inspected dependency’s most recent connections. Use common tags to gain additional context into a faulty endpoint. For instance, when troubleshooting latent communication to a particular service, common destination tags surface the following:
- Granular context such as the container, task, or host to which traffic is flowing.
- Wider context such as the availability zone, cloud provider account, or deployment in which the service runs.
Security
The Security tab highlights potential network threats and findings detected by Workload Protection and Cloud Security Misconfigurations. These signals are generated when Datadog detects network activity that matches a detection or compliance rule, or if there are other threats and misconfigurations related to the selected network flow.
For a complete reference of default tags available for querying and filtering network traffic, see Tags Reference.
Network data
Network metrics are displayed through the graphs and the associated table. All sent and received metrics are displayed from the perspective of the source:
- Sent metrics: measure the value of something from the source to the destination from the source’s perspective.
- Received metrics: measure the value of something from the destination to the source from the source’s perspective.
Values displayed might be different for sent_metric(source to destination) and received_metric(destination to source) if there is a large number of packet drops. In this case, if the destination sends a lot of bytes to the source, the aggregate connections that originate at destination include those bytes, but the aggregate connections that originate at source do not see them as received.
Note: Data is collected every 30 seconds, aggregated in five minute buckets, and retained for 14 days.
Metrics
Network load
The following network load metrics are available:
| Metric | Description |
|---|
| Volume | The number of bytes sent or received over a period. Measured in bytes (or orders of magnitude thereof) bidirectional. |
| Throughput | The rate of bytes sent or received over a period. Measured in bytes per second, bidirectional. |
TCP
TCP is a connection-oriented protocol that guarantees in-order delivery of packets.
The following TCP metrics are available:
| Metric | Description |
|---|
| Closed Connections | The number of TCP connections in a closed state. Measured in connections per second from the client. |
| Established Connections | The number of TCP connections in an established state. Measured in connections per second from the client. |
| Host Unreachable | Indicates when the target host is offline or traffic is blocked by routers or firewalls. Available in Agent 7.68+. |
| Network Unreachable | Indicates local networking issues on the Agent’s host machine. Available in Agent 7.68+. |
| Connection Cancels | Tracks TCP connection cancellations and userspace connection timeouts in language runtimes such as Go and Node.js. Available in Agent 7.70+. |
| TCP Jitter | Measured as TCP smoothed round-trip time variance. |
| TCP Latency | Measured as TCP smoothed round-trip time, that is, the time between a TCP frame being sent and acknowledged. |
| TCP Refusals | The number of TCP connections that were refused by the server. Typically this indicates an attempt to connect to an IP/port that isn’t receiving connections, or a firewall/security misconfiguration. |
| TCP Resets | The number of TCP connections that were reset by the server. |
| TCP Retransmits | TCP Retransmits represent detected failures that are retransmitted to ensure delivery. Measured in count of retransmits from the client. |
| TCP Timeouts | The number of TCP connections that timed out from the perspective of the operating system. This can indicate general connectivity and latency issues. |
All metrics are measured from the client side of the connection when available, otherwise from the server side.
Cloud service autodetection
If you’re relying on managed cloud services like S3 or Kinesis, you can monitor the performance of traffic to those services from your internal applications. Scope your view to a particular AWS, Google Cloud, or Azure dependency to pinpoint latency, assess database performance, and visualize your network more completely.
For instance, you can:
- Visualize data flow from your internal Kubernetes cluster to
server_service:aws.s3 in the Network Map. - Pivot to the Network Page to isolate which pods are establishing the most connections to that service, and
- Validate that their request is successful by analyzing S3 performance metrics, which are correlated with traffic performance directly in the side panel for a given dependency, under the Integration Metrics tab.
CNM automatically maps:
- Network calls to S3 (which can broken down by
s3_bucket), RDS (which can be broken down by rds_instance_type), Kinesis, ELB, Elasticache, and other AWS services. - API calls to AppEngine, Google DNS, Gmail, and other Google Cloud services.
To monitor other endpoints where an Agent cannot be installed (such as public APIs), group the destination by the domain tag. Or, see the section below for cloud service resolution.
Cloud service enhanced resolution
With enhanced resolution configured for AWS or Azure, CNM filters and groups network traffic using resources collected from these cloud providers. The available tags vary by cloud provider and resource. Datadog automatically applies the tags listed below in addition to any user-defined tags.
Amazon Web Services
- name
- loadbalancer
- load_balancer_arn
- dns_name (format loadbalancer/dns:)
- region
- account_id
- scheme
- custom (user-defined) tags applied to AWS Loadbalancers
- gateway_id
- gateway_type
- aws_nat_gateway_id
- aws_nat_gateway_public_ip
- aws_account
- availability-zone
- region
- custom (user) tags applied to AWS Nat Gateways
- gateway_id
- gateway_type
- aws_internet_gateway_id
- aws_account
- region
- custom (user) tags applied to VPC Internet Gateways
- gateway_id
- gateway_type
- aws_vpc_endpoint_id
- custom (user) tags applied to VPC Internet Endpoints
Azure
- name
- loadbalancer
- cloud_provider
- region
- type
- resource_group
- tenant_name
- subscription_name
- subscription_id
- sku_name
- custom (user-defined) tags applied to Azure Loadbalancers and Application Gateways
Domain resolution
Starting with Agent 7.17+, the Agent resolves IPs to human-readable domain names for external and internal traffic. Domain allows you to monitor cloud provider endpoints where a Datadog Agent cannot be installed, such as S3 buckets, application load balancers, and APIs. Unrecognizable domain names such as DGA domains from C&C servers may point to network security threats. domain is encoded as a tag in Datadog, so you can use it in search bar queries and the facet panel to aggregate and filter traffic.
Note: DNS resolution is supported for hosts where the system probe is running on the root network namespace, which is usually caused by running the system-probe in a container without using the host network.
Network Address Translation (NAT)
NAT is a tool used by Kubernetes and other systems to route traffic between containers. When investigating a specific dependency (for example, service to service), you can use the presence or absence of pre-NAT IPs to distinguish between Kubernetes-native services, which do their own routing, and services that rely on external clients for routing. This feature does not include resolution of NAT gateways.
To view pre-NAT and post-NAT IPs, use the Show pre-NAT IPs toggle in the table settings. When this setting is toggled off, IPs shown in the Client IP and Server IP columns are by default post-NAT IPs. In cases where you have multiple pre-NAT IPs for one post-NAT IP, the top 5 most common pre-NAT IPs are displayed. pre_nat.ip is a tag like any other in the product, so you can use it to aggregate and filter traffic.
Network ID
CNM users may configure their networks to have overlapping IP spaces. For instance, you may want to deploy in multiple VPCs (virtual private clouds) which have overlapping address ranges and communicate only through load balancers or cloud gateways.
To correctly classify traffic destinations, CNM uses the concept of a network ID, which is represented as a tag. A network ID is an alphanumeric identifier for a set of IP addresses that can communicate with one another. When an IP address mapping to several hosts with different network IDs is detected, this identifier is used to determine the particular host network traffic is going to or coming from.
In AWS and Google Cloud, the network ID is automatically set to the VPC ID. For other environments, the network ID may be set manually, either in datadog.yaml as shown below, or by adding the DD_NETWORK_ID to the process and core Agent containers.
network:
   Id: <your-network-id>
Further Reading
Additional helpful documentation, links, and articles: