- Essentials
- Getting Started
- Agent
- API
- APM Tracing
- Containers
- Dashboards
- Database Monitoring
- Datadog
- Datadog Site
- DevSecOps
- Incident Management
- Integrations
- Internal Developer Portal
- Logs
- Monitors
- OpenTelemetry
- Profiler
- Session Replay
- Security
- Serverless for AWS Lambda
- Software Delivery
- Synthetic Monitoring and Testing
- Tags
- Workflow Automation
- Learning Center
- Support
- Glossary
- Standard Attributes
- Guides
- Agent
- Integrations
- Developers
- Authorization
- DogStatsD
- Custom Checks
- Integrations
- Create an Agent-based Integration
- Create an API Integration
- Create a Log Pipeline
- Integration Assets Reference
- Build a Marketplace Offering
- Create a Tile
- Create an Integration Dashboard
- Create a Monitor Template
- Create a Cloud SIEM Detection Rule
- OAuth for Integrations
- Install Agent Integration Developer Tool
- Service Checks
- IDE Plugins
- Community
- Guides
- OpenTelemetry
- Administrator's Guide
- API
- Partners
- Datadog Mobile App
- DDSQL Reference
- CoScreen
- CoTerm
- Cloudcraft (Standalone)
- In The App
- Dashboards
- Notebooks
- DDSQL Editor
- Reference Tables
- Sheets
- Monitors and Alerting
- Metrics
- Watchdog
- Bits AI
- Internal Developer Portal
- Error Tracking
- Change Tracking
- Service Management
- Actions & Remediations
- Infrastructure
- Cloudcraft
- Resource Catalog
- Universal Service Monitoring
- Hosts
- Containers
- Processes
- Serverless
- Network Monitoring
- Cloud Cost
- Application Performance
- APM
- APM Terms and Concepts
- Application Instrumentation
- APM Metrics Collection
- Trace Pipeline Configuration
- Correlate Traces with Other Telemetry
- Trace Explorer
- Recommendations
- Code Origins for Spans
- Service Observability
- Endpoint Observability
- Dynamic Instrumentation
- Live Debugger
- Error Tracking
- Data Security
- Guides
- Troubleshooting
- Continuous Profiler
- Database Monitoring
- Agent Integration Overhead
- Setup Architectures
- Setting Up Postgres
- Setting Up MySQL
- Setting Up SQL Server
- Setting Up Oracle
- Setting Up Amazon DocumentDB
- Setting Up MongoDB
- Connecting DBM and Traces
- Data Collected
- Exploring Database Hosts
- Exploring Query Metrics
- Exploring Query Samples
- Exploring Database Schemas
- Exploring Recommendations
- Troubleshooting
- Guides
- Data Streams Monitoring
- Data Jobs Monitoring
- Data Observability
- Digital Experience
- Real User Monitoring
- Synthetic Testing and Monitoring
- Continuous Testing
- Product Analytics
- Software Delivery
- CI Visibility
- CD Visibility
- Deployment Gates
- Test Optimization
- Quality Gates
- DORA Metrics
- Security
- Security Overview
- Cloud SIEM
- Code Security
- Cloud Security
- App and API Protection
- Workload Protection
- Sensitive Data Scanner
- AI Observability
- Log Management
- Observability Pipelines
- Log Management
- Administration
Detecting a Network Outage
Network outages are often disguised as infrastructure, application, or container issues, which makes them hard to detect. Without visibility into your regional network performance or that of third-party endpoints you rely on, it may take hours to detect third-party or cloud regional outages, which could ultimately affect your customers.
With Cloud Network Monitoring (CNM), you can detect network outages in minutes. By analyzing network flow data alongside process metrics, traces, logs, and infrastructure metrics, you can avoid making assumptions about the root of an issue, and instead use process of elimination (see the steps below) to determine whether you’re experiencing a network outage.
Traffic overloading the underlying infrastructure
Use CNM metrics to see whether your source endpoint may be sending an enormous amount of traffic or making a large number of open connections to the destination endpoint. When selecting a faulty dependency (for example, one with high latency), you can use the side panel graphs to spot such spikes in traffic. These spikes may overwhelm your receiving application to the point that it cannot (in the case of TCP) respond to all connections, leading to increased packet loss and thus, increased TCP latency.
CPU overconsumption of the underlying infrastructure
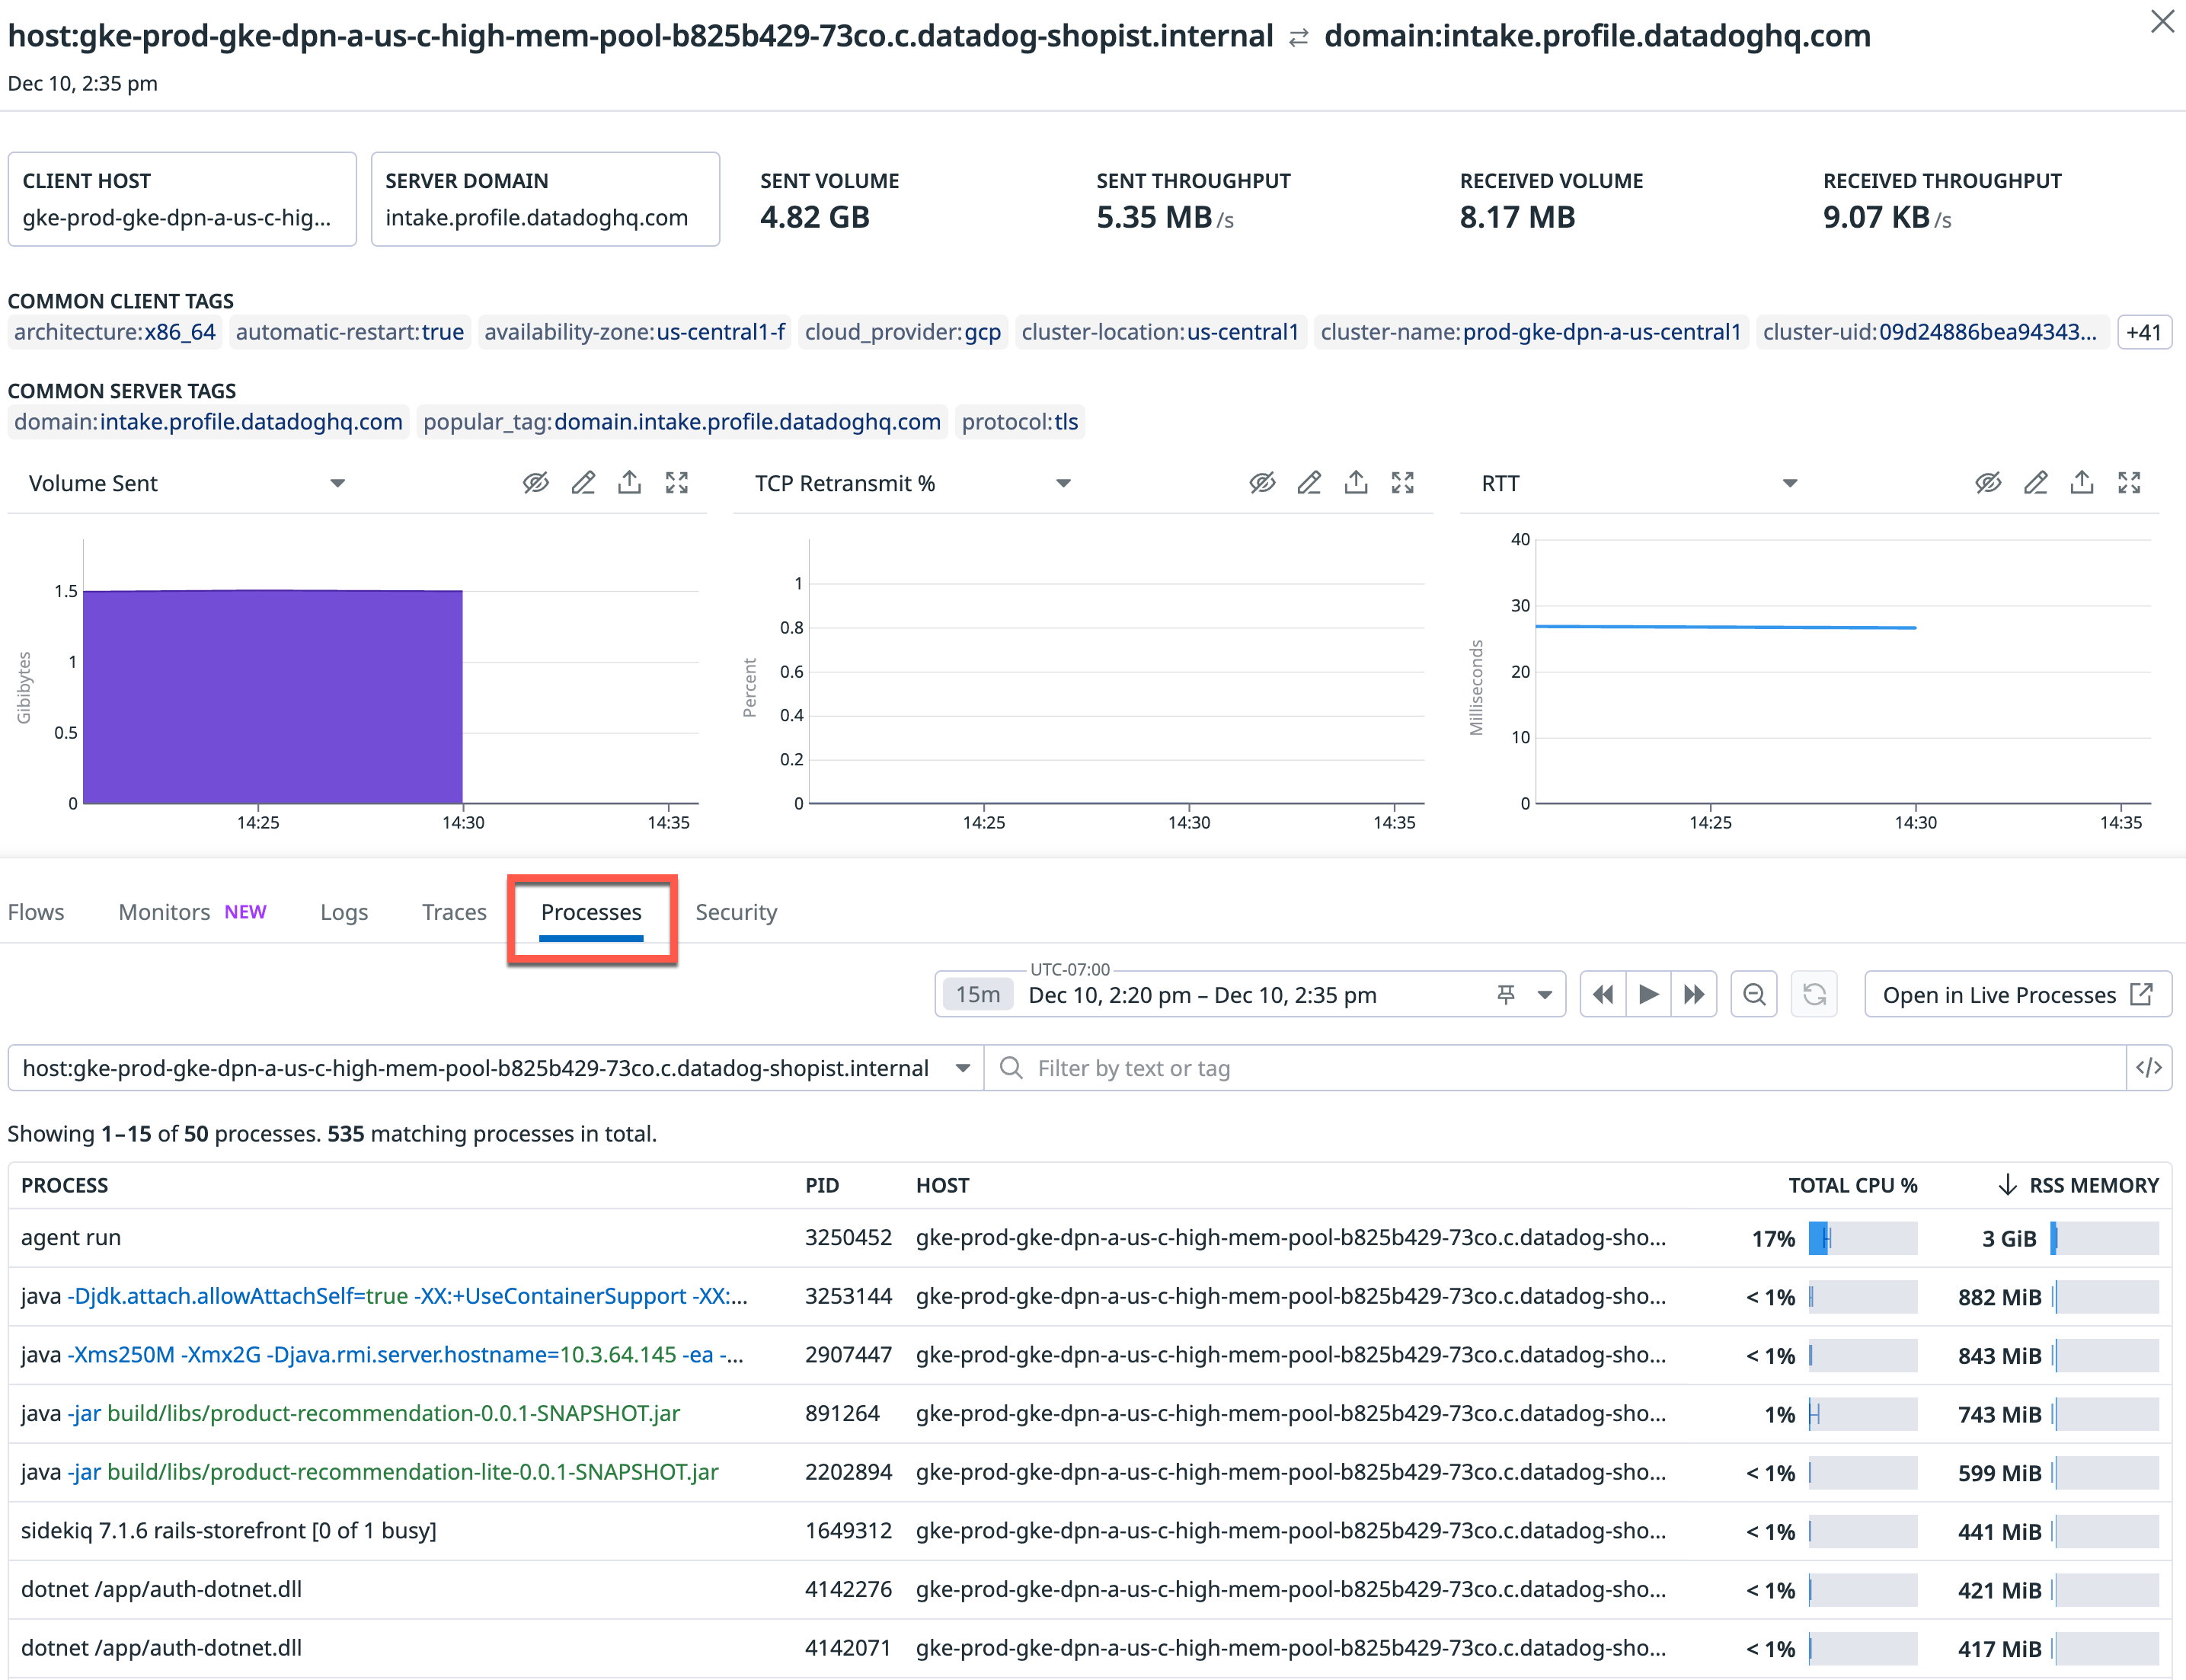
On the other hand, resource overconsumption of either the client or server endpoint could be the culprit of poor communication between the two. In the side panel Processes tab, scope your view to processes running on either the source or destination endpoints to spot any heavy software that may be degrading the performance of their underlying hosts or containers, thus reducing their ability to respond to network calls. In this case, in addition to knowing whether an underlying host is running hot and causing application latency, you will want to know why it is running hot. Grouping your process metrics by command gives you this granularity, since you can identify the particular workload that is consuming your CPU and memory resources.
Application errors in code
Network errors and latency can also be caused by client-side application errors. For instance, if your application is generating connections on loop unnecessarily, it could be overwhelming the endpoints that rely on it, leading to downstream application and network issues. To determine whether this is the case, look for application request errors in the Traces tab of a specific service in CNM > DNS, or the Network tab of a specific trace in APM Traces.
If none of these steps lead to a root cause, and you are seeing errors and latency for your dependencies scoped to a particular region, availability zone, or third-party domain endpoint, then you are experiencing a network outage. In this case, you can reach out to the relevant providers to report and resolve the issue.
Further reading
Additional helpful documentation, links, and articles:


