- Agents
- Essentials
- Getting Started
- Agent
- API
- APM Tracing
- Containers
- Dashboards
- Database Monitoring
- Datadog
- Datadog Site
- DevSecOps
- Incident Management
- Integrations
- Internal Developer Portal
- Logs
- Monitors
- Notebooks
- OpenTelemetry
- Profiler
- Search
- Session Replay
- Security
- Serverless for AWS Lambda
- Software Delivery
- Synthetic Monitoring and Testing
- Tags
- Workflow Automation
- Learning Center
- Support
- Glossary
- Standard Attributes
- Guides
- Agent
- Integrations
- Extend Datadog
- Authorization
- DogStatsD
- Custom Checks
- Integrations
- Build an Integration with Datadog
- Create an Agent-based Integration
- Create an API-based Integration
- Create a Log Pipeline
- Integration Assets Reference
- Build a Marketplace Offering
- Create an Integration Dashboard
- Create a Monitor Template
- Create a Cloud SIEM Detection Rule
- Install Agent Integration Developer Tool
- Service Checks
- Community
- Guides
- OpenTelemetry
- Administrator's Guide
- API
- Partners
- Datadog Mobile App
- DDSQL Reference
- CoScreen
- CoTerm
- Remote Configuration
- Cloudcraft (Standalone)
- In The App
- Dashboards
- Notebooks
- DDSQL Editor
- Reference Tables
- Sheets
- Monitors and Alerting
- Service Level Objectives
- Metrics
- Watchdog
- Bits AI
- Internal Developer Portal
- Error Tracking
- Change Tracking
- Event Management
- Incident Response
- Actions & Remediations
- Infrastructure
- Cloudcraft
- Resource Catalog
- Universal Service Monitoring
- End User Device Monitoring
- Hosts
- Containers
- Processes
- Serverless
- Network Monitoring
- Storage Management
- Cloud Cost
- Application Performance
- APM
- Continuous Profiler
- Database Monitoring
- Agent Integration Overhead
- Setup Architectures
- Setting Up Postgres
- Setting Up MySQL
- Setting Up SQL Server
- Setting Up Oracle
- Setting Up Amazon DocumentDB
- Setting Up MongoDB
- Setting Up ClickHouse
- Connecting DBM and Traces
- Data Collected
- Exploring Database Hosts
- Exploring Query Metrics
- Exploring Query Samples
- Exploring Database Schemas
- Exploring Recommendations
- Troubleshooting
- Guides
- Data Streams Monitoring
- Data Observability
- Digital Experience
- Real User Monitoring
- Synthetic Testing and Monitoring
- Continuous Testing
- Experiments
- Product Analytics
- Session Replay
- Software Delivery
- CI Visibility
- CD Visibility
- Deployment Gates
- Test Optimization
- Code Coverage
- PR Gates
- DORA Metrics
- Feature Flags
- Developer Integrations
- Security
- Security Overview
- Cloud SIEM
- Code Security
- Cloud Security
- App and API Protection
- AI Guard
- Workload Protection
- Sensitive Data Scanner
- AI Observability
- Log Management
- Observability Pipelines
- Configuration
- Sources
- Processors
- Destinations
- Packs
- Akamai CDN
- Amazon CloudFront
- Amazon VPC Flow Logs
- AWS Application Load Balancer Logs
- AWS CloudTrail
- AWS Elastic Load Balancer Logs
- AWS Network Load Balancer Logs
- Cisco ASA
- Cloudflare
- F5
- Fastly
- Fortinet Firewall
- HAProxy Ingress
- Istio Proxy
- Juniper SRX Firewall Traffic Logs
- Netskope
- NGINX
- Okta
- Palo Alto Firewall
- Windows XML
- ZScaler ZIA DNS
- Zscaler ZIA Firewall
- Zscaler ZIA Tunnel
- Zscaler ZIA Web Logs
- Search Syntax
- Scaling and Performance
- Monitoring and Troubleshooting
- Guides and Resources
- Log Management
- CloudPrem
- Administration
- Account Management
- Data Security
- Help
Getting Started with Device Profiles
This product is not supported for your selected Datadog site. ().
Overview
Device profiles define which metrics to collect and how to transform them into Datadog metrics. Each profile is expected to monitor a class of similar devices from the same vendor.
The SNMP Profile Manager template provides a guided, GUI-based experience to:
- Efficiently create and manage device profiles.
- Specify tags and metrics to be collected from your network devices.
- Verify the matching devices to each profile.
- Review a snapshot of the device profiles you created on the Inventory page.
For more information on advanced profile details, review the Profile Format Reference page.
Prerequisites
The minimum Agent version required is
7.65or higher.Remote Configuration enabled for your organization.
Permissions required:
- NDM Device Profiles View: Provides read-only access to the profile page. (Included in the Datadog Standard Role).
- NDM Device Profiles Edit: Allows editing of device profiles. (Included in the Datadog Admin Role).
To automatically apply created device profiles using Remote Configuration, enable the following setting in your
datadog-agent/conf.d/snmp.d/conf.yamlfile:init_config: loader: core use_device_id_as_hostname: true min_collection_interval: 15 use_remote_config_profiles: true instances: ......
Setup
Step 1: Profile details
Build your own NDM profile by navigating to Infrastructure > Network Devices > Configuration.
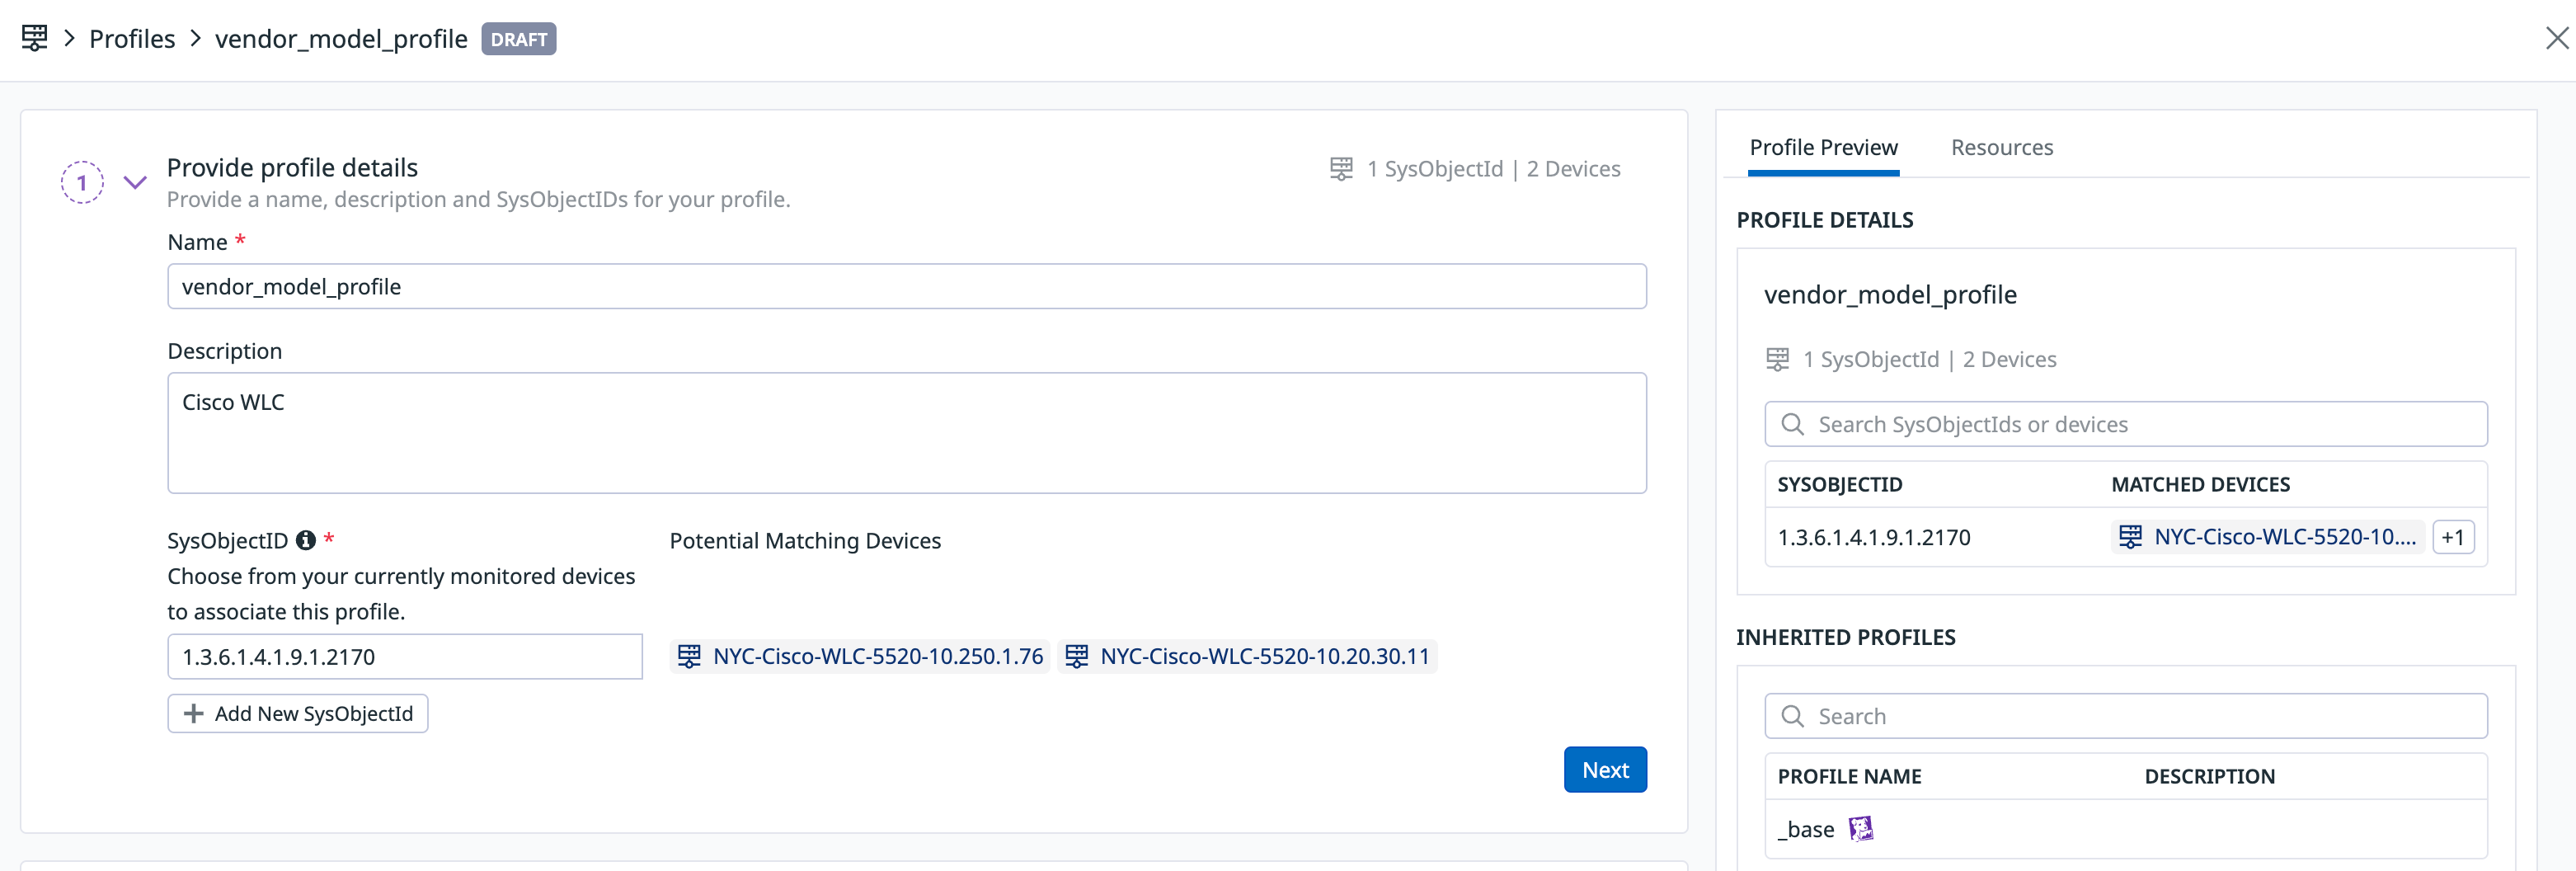
Click on SNMP Profile Manager > + Create New Profile. This brings you to the profile creation page shown below.
Provide your device profile with a name and description (optional).
Select the
SysObjectID. This parameter matches network devices to the device profiles.
Step 2: Profile inheritance
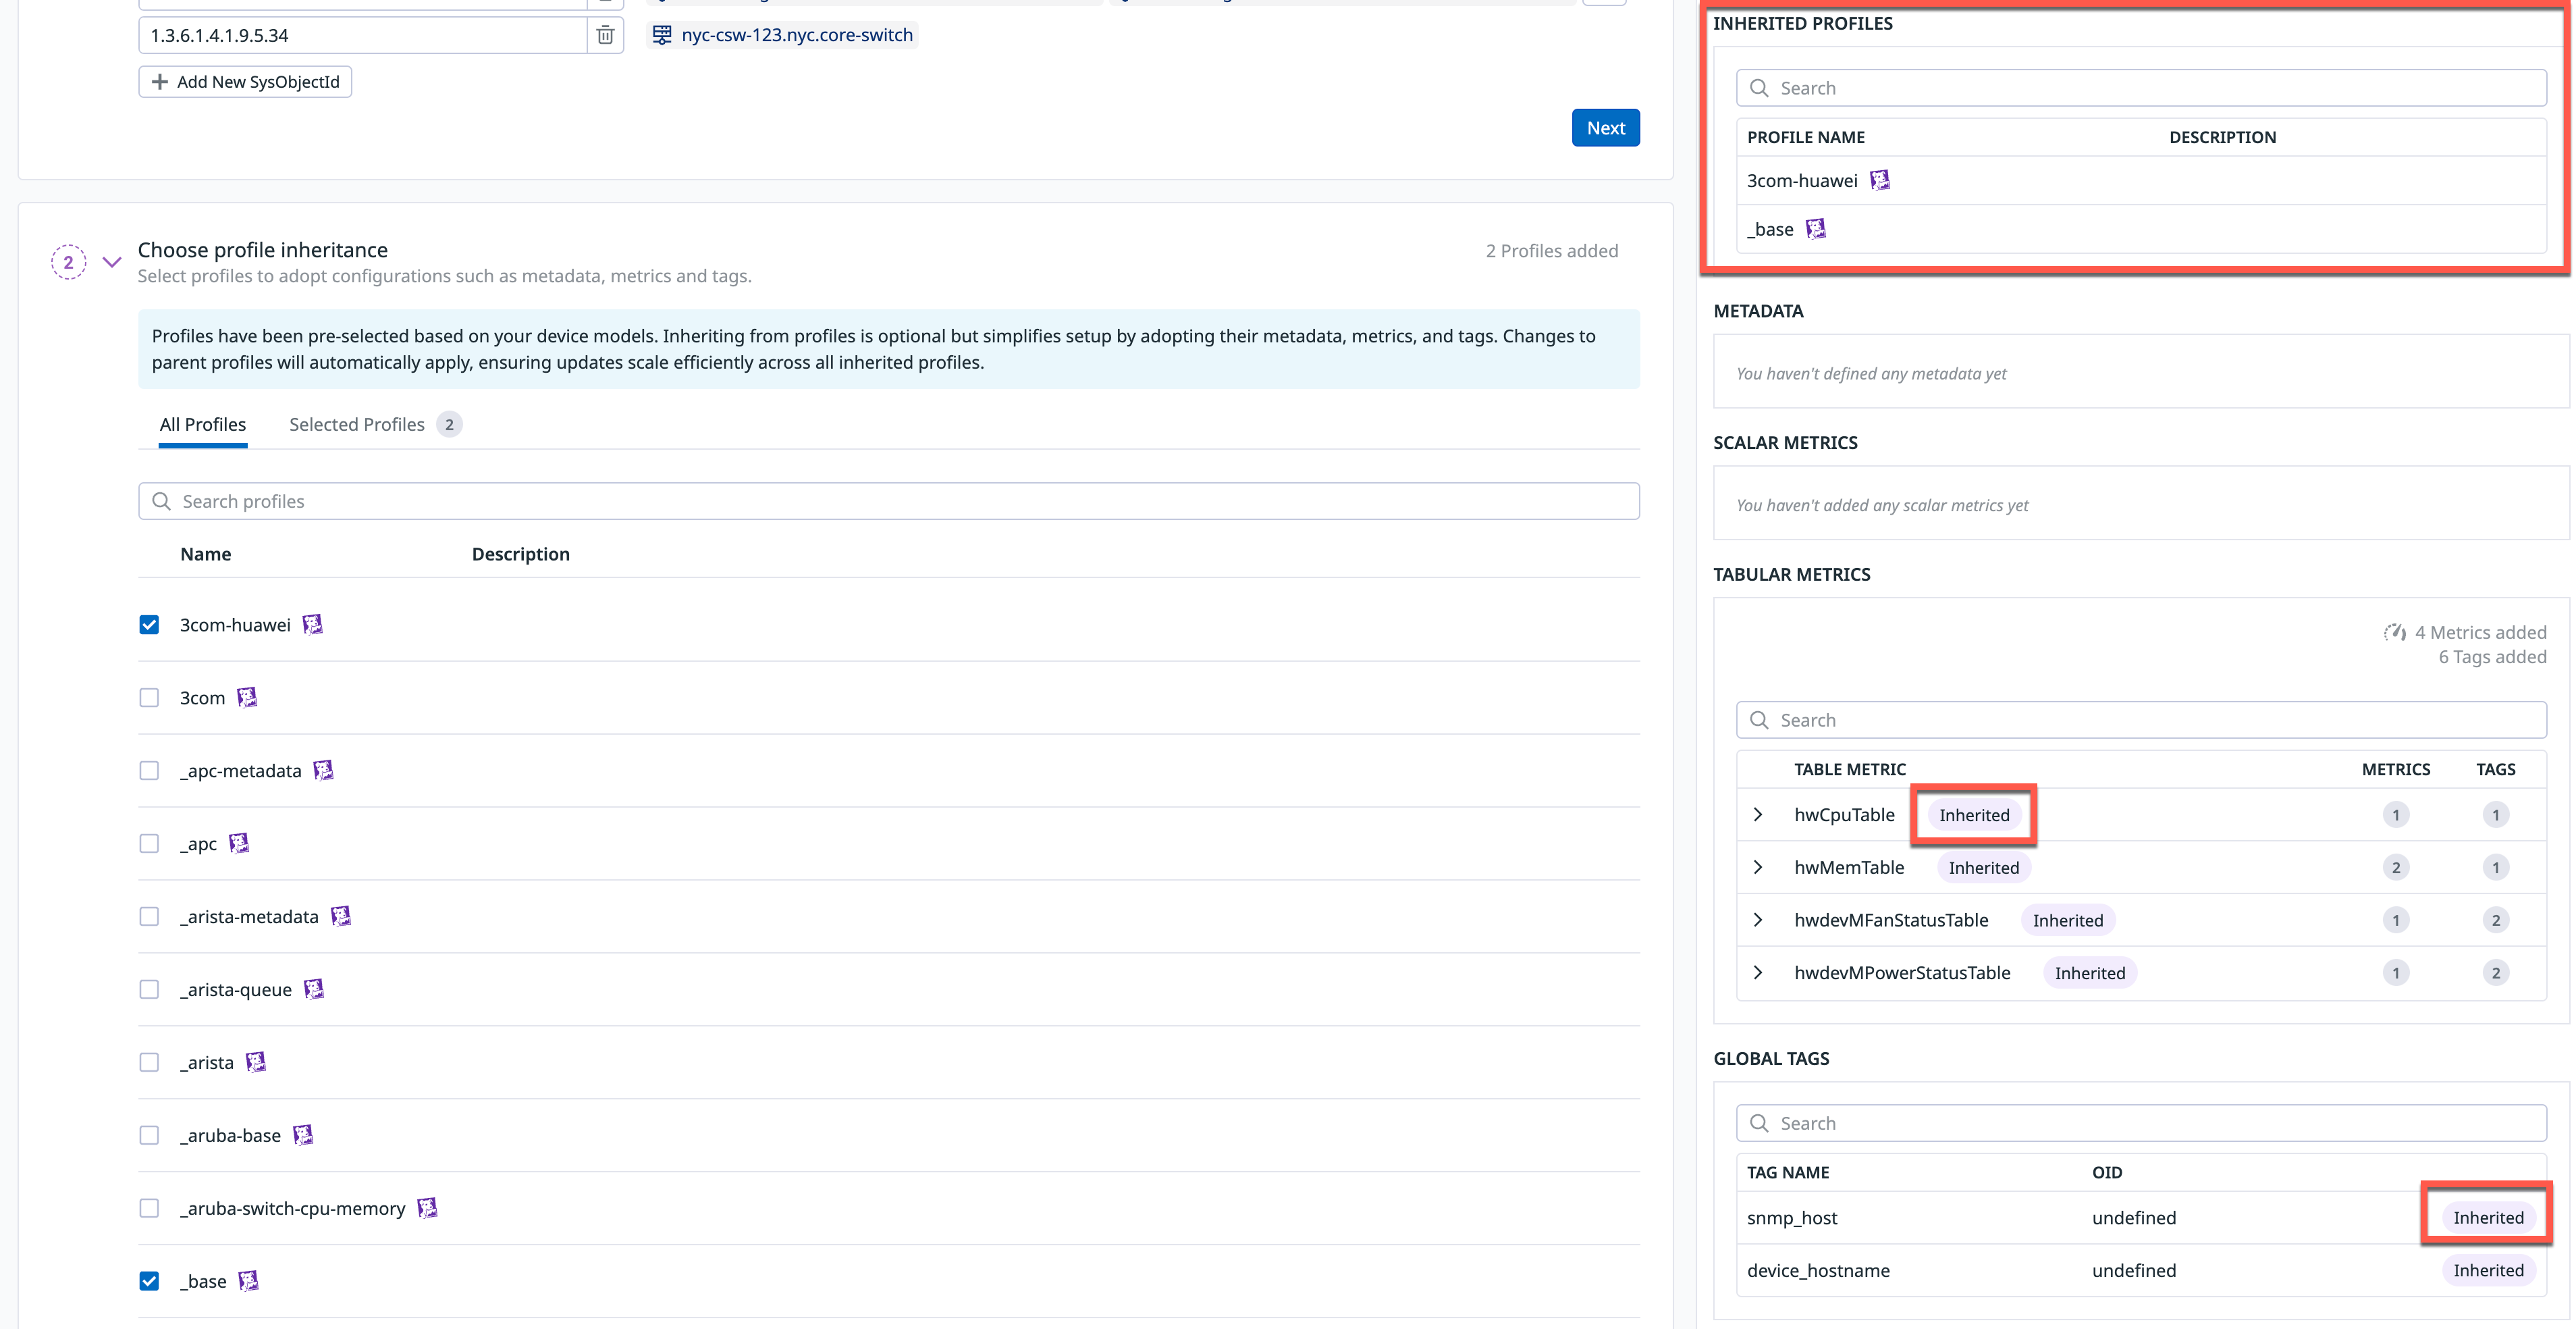
Use profile inheritance to adopt configurations such as metadata, metrics, and tags. This simplifies scaling your device profiles and allows you to build on existing ones. Datadog automatically includes some inherited profiles, (_base.yaml _generic-if.yaml, _generic-ip.yaml, _generic-ospf.yaml, _generic-tcp.yaml and _generic-udp.yaml), which are recommended not to be removed.
Reference the Supported Device Profiles for the full list of inherited profiles.
Keep the Datadog
_base.yamlprofile, and any other inherited Datadog profiles specific to your needs. Optionally, you can select additional profiles to inherit. The relevant fields appear on the right under Inherited Profiles, with anInheritedtag next to any inherited metrics, tags, or metadata:Note: Changes made to the parent profile automatically apply to the child profiles. If you need to adjust any inherited attributes in the child profiles, such as metrics, tags, or metadata, you must modify the parent profile.
Step 3: Select reference devices
Use reference devices to select which devices you want to gather A unique ID or address on a device that when polled returns the response code of that value. for your chosen device models. The reference devices field is pre-selected based on the SysObjectID you specified in the profile details.
Keep the current reference device selection to perform a device scan. Additionally, you can add more devices or change the current selection.
Click Scan Devices to proceed to Step 4, which initiates the scan.
Optionally, click Proceed Manually to proceed without performing a scan.
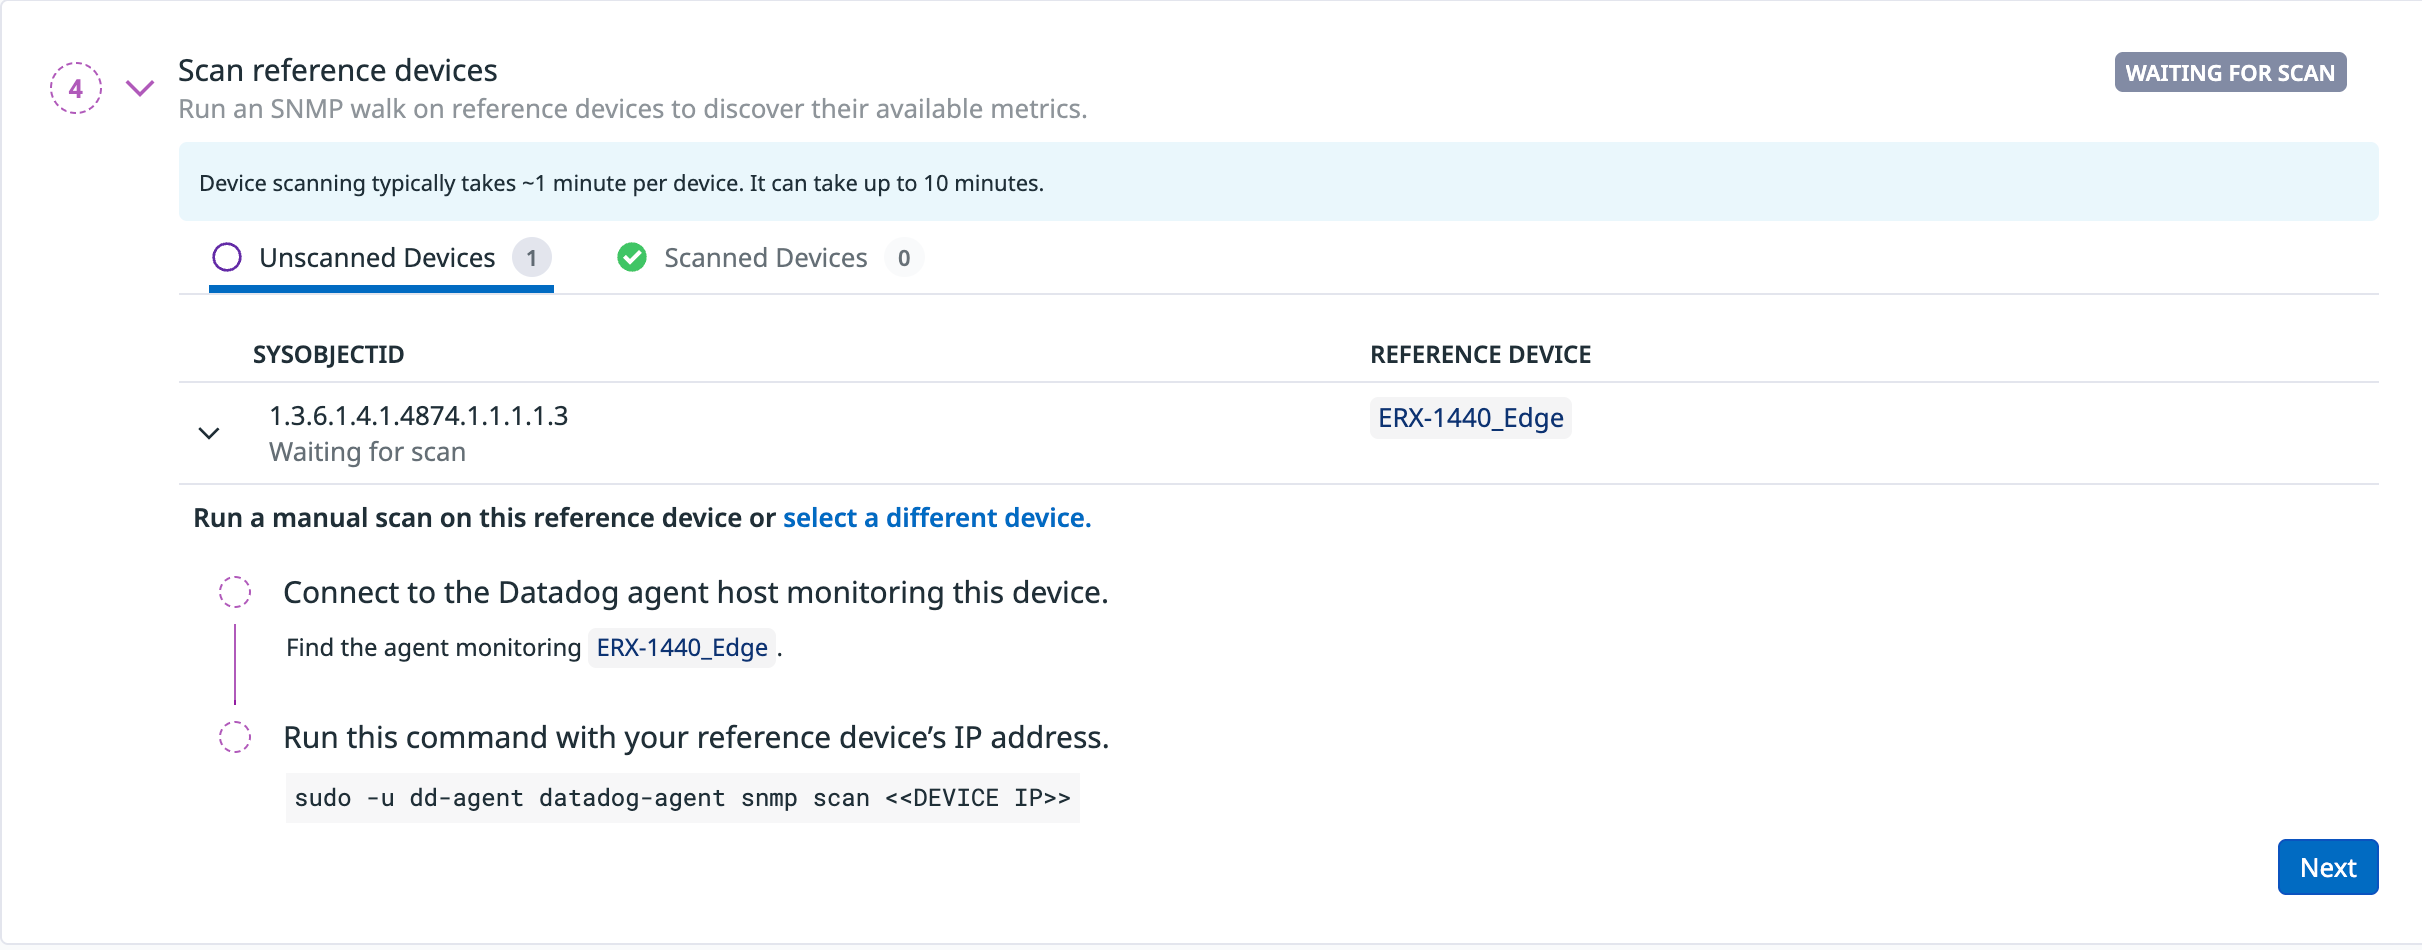
Step 4: Scan reference devices
This step scans your devices to discover their available metrics. Running a scan allows you to view all available metrics for your device, making it easier to fill in metrics, metadata, and tags. The scan performs an SNMP walk on your devices using Datadog Remote Configuration.
The Scanned Devices tab displays which devices were scanned with Remote Configuration or manually.
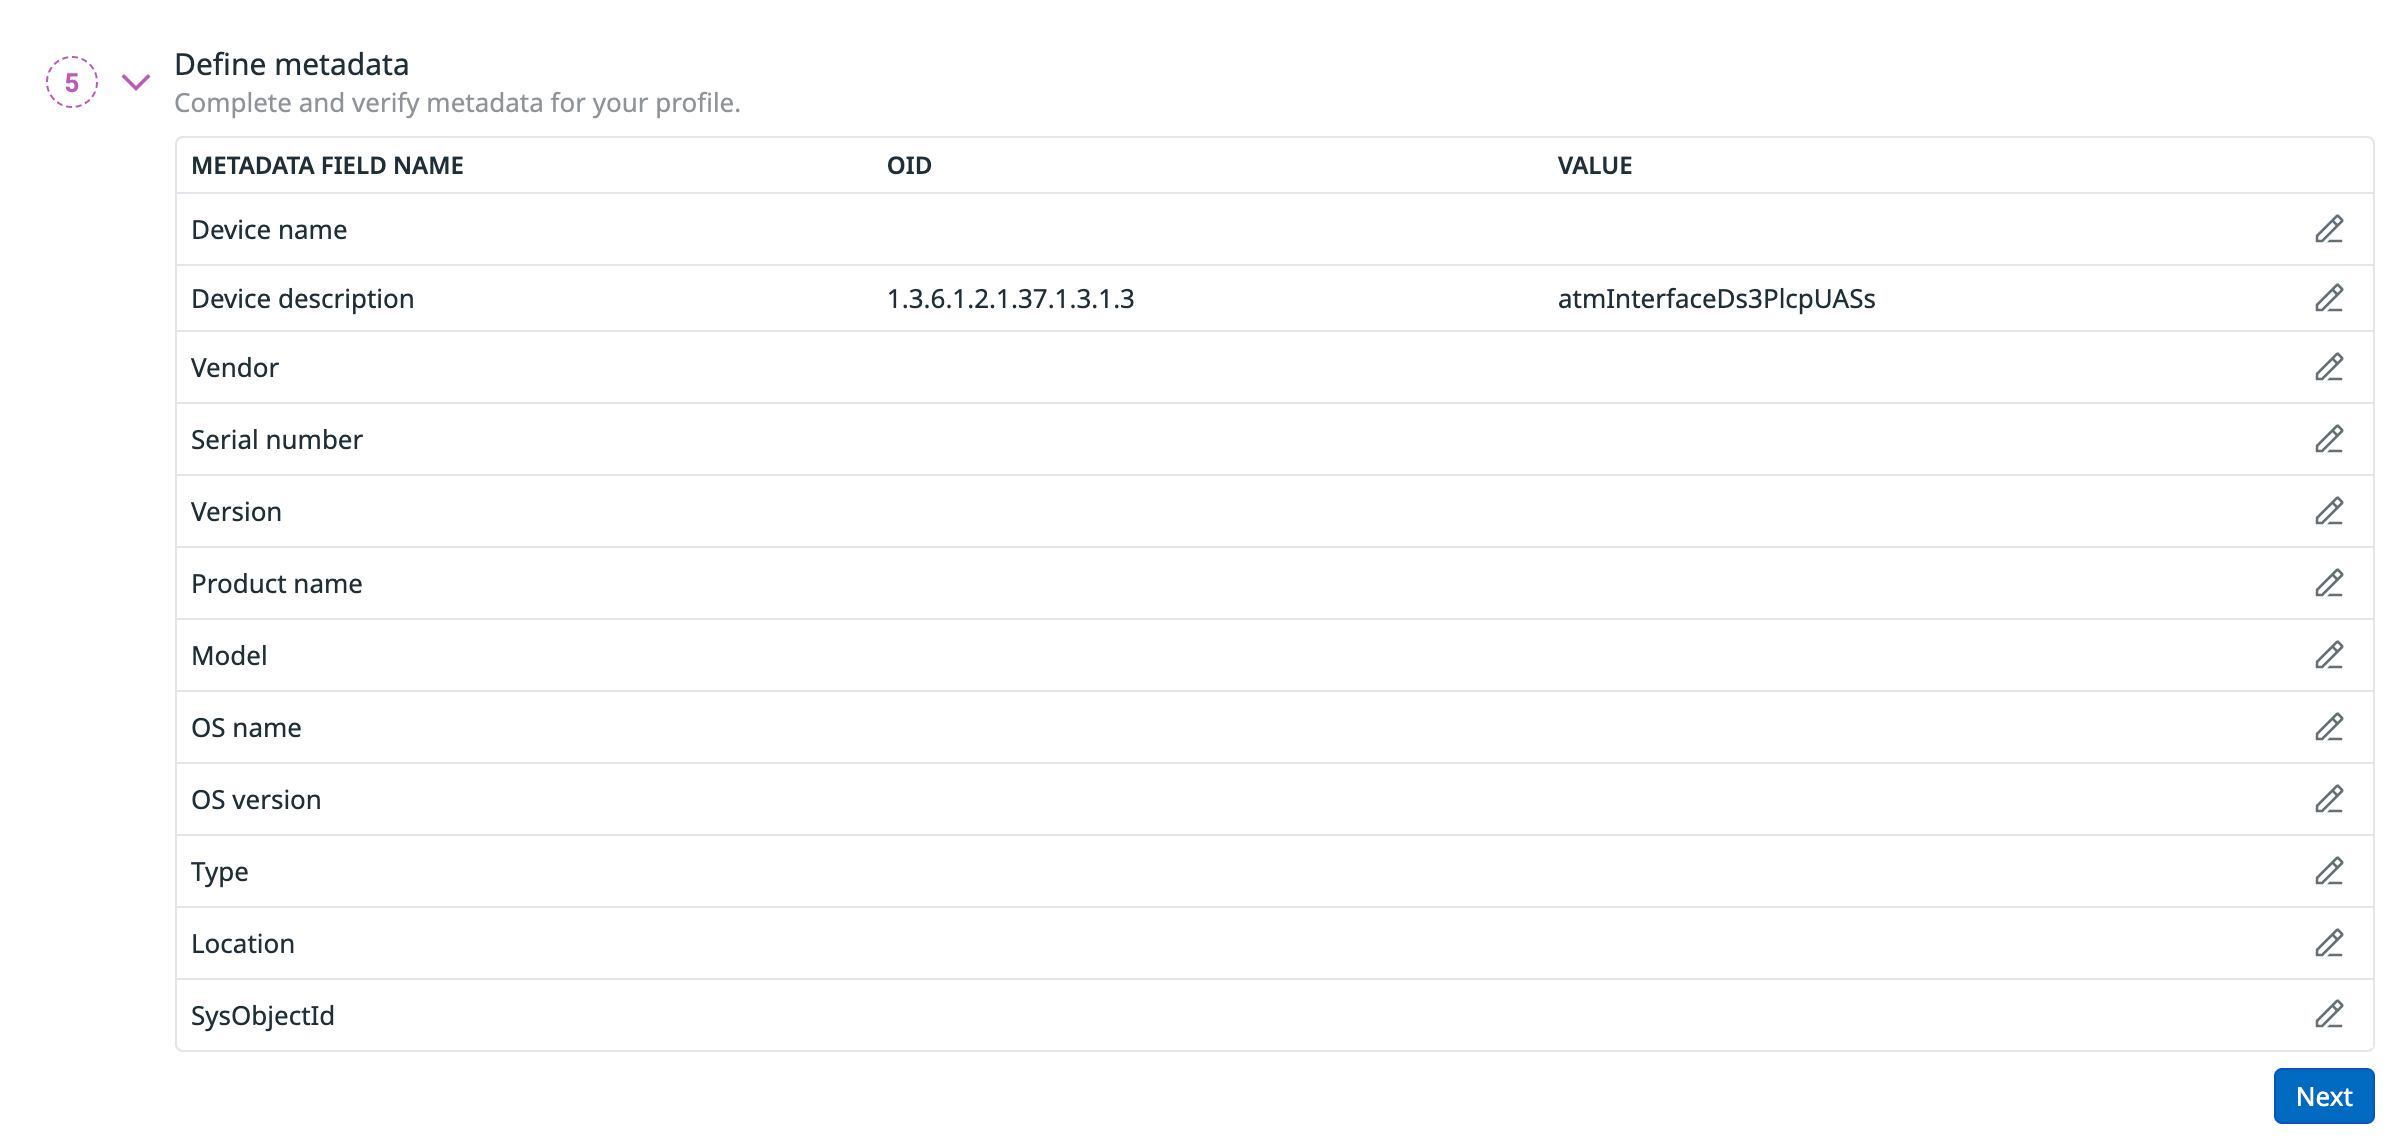
Step 5: Define metadata
Datadog provides reasonable defaults for most devices through out-of-the-box (OOTB) profiles, such as device and description. You can override these defaults in the Define Metadata section.
Click the pencil icon to edit and modify any of the default metadata fields.
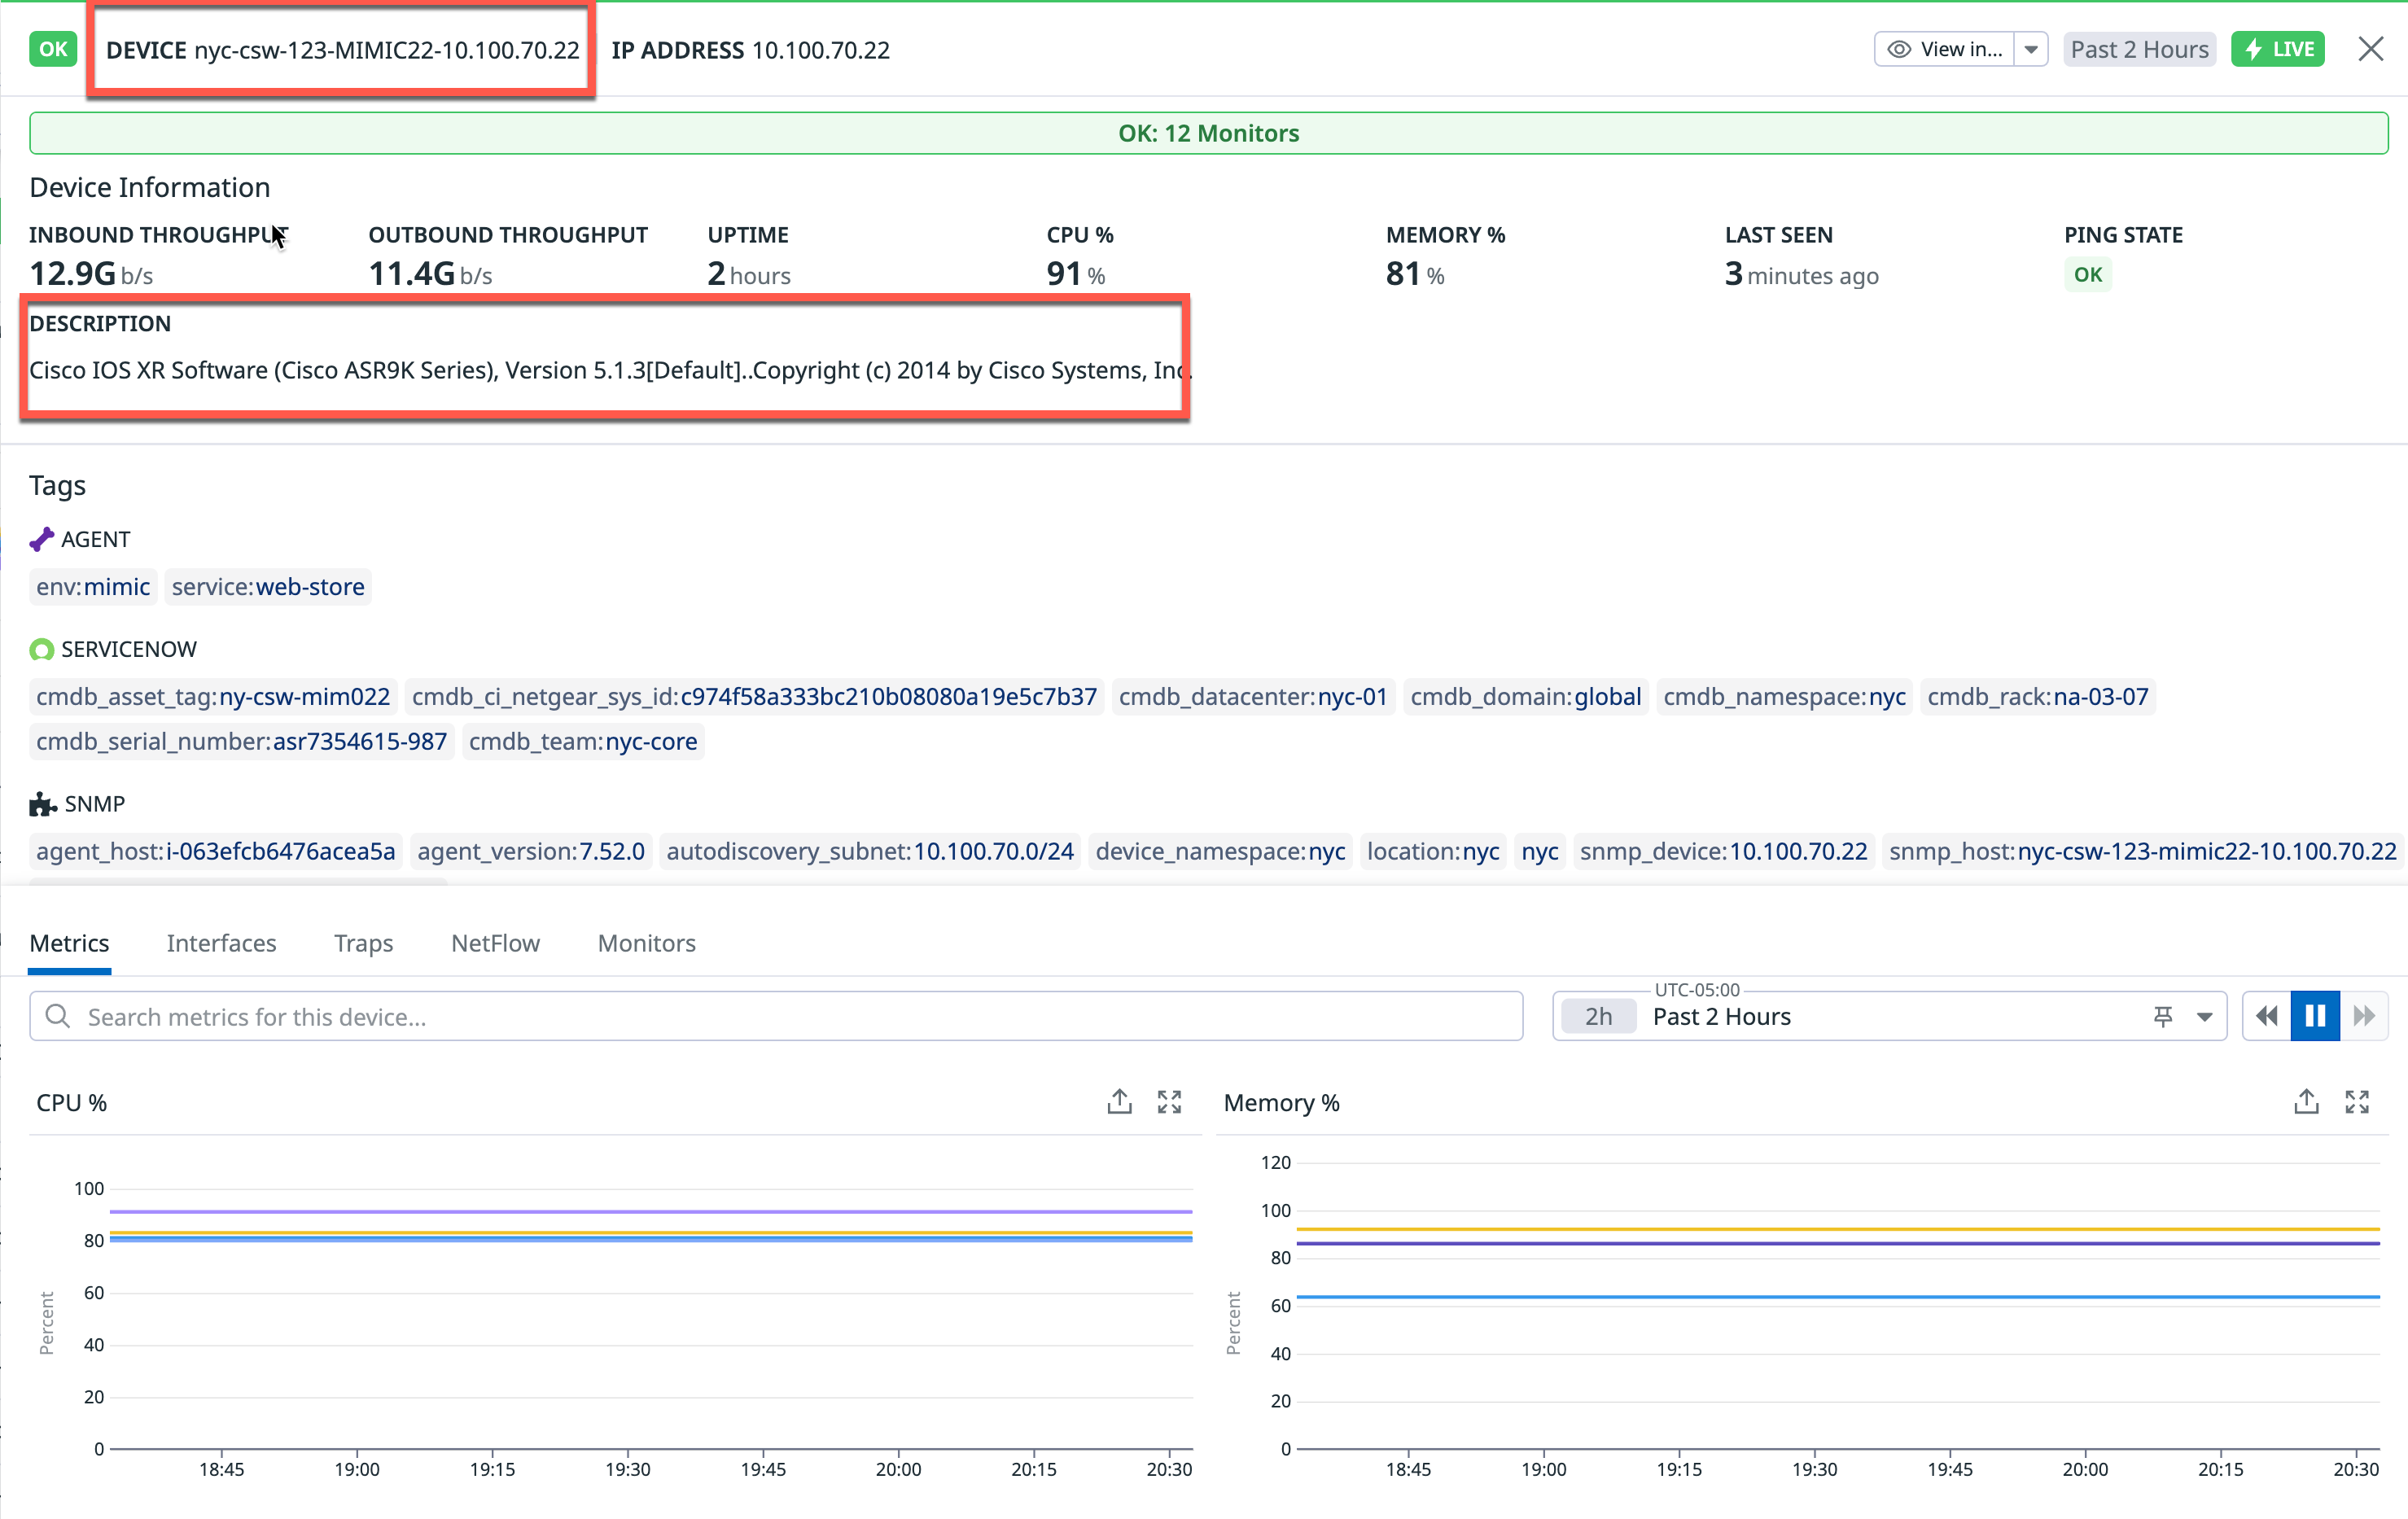
Metadata functionality is available and displayed on the Network Device Monitoring (NDM) page as searchable facets, and on the side panel of a selected device:
Step 6: Define metrics
Metrics can be added either from a device scan or by manually creating a new metric for the profile. Inherited metrics are highlighted in purple with the Inherited tag.
To define a metric using the Device Scan option, click Add Metrics. This opens a modal displaying all available metrics for the device.
Hover over metrics to see units and descriptions for easier selection.
Select the metrics you wish to add, then click Add Metric.
This returns you to the define metrics screen where you can see the new metric that was added.
- To define a metric using the Manual option, click Add Metrics. This opens a modal displaying all available metrics for the device.
- Click Create New Metric at the top of the modal.
- Specify the OID (Scalar, or Tabular).
- Click the dropdown in the search field to add the OID name. The search bar offers an autocomplete feature that suggests OIDs matching the searched value, or you can manually enter the name or OID.
- Select the metric type, scale factor, and extract value (regex pattern). See advanced options for scalar metrics and advanced options for tabular metrics for more information.
- Click Create to save the metric.
- This returns you to the define metrics screen where you can see the new metric that was added.
Note: To avoid a validation error for tabular metrics, at least one metric tag must be added on the Define metrics screen.
Advanced options scalar
Advanced options scalar
Scalar metrics
- Metric Type
- One of
gauge,rate,monotonic_count, ormonotonic_count_and_rate. - Scale Factor
- Before being transmitted to Datadog, the extracted value is multiplied by this factor.
- Extract Value
- This is the same as the advanced options for global tags.
Advanced options tabular
Advanced options tabular
Tabular metrics
Adding tags to tabular metrics is similar to adding global tags, with two additional options:
Select whether the tag value originates from an
OIDvalue or a segment of the table index. IfIndexis chosen as the source, an index position must be specified, which then becomes the tag.Example of using an Index position
Consider a table at
OID 1.2.3.1.1with two indices. Each row in this table includes a two-number index. Suppose column 3 of a row hasOID 1.2.3.1.1.3.55.12- here,1.2.3.1.1represents the table,.3is the column number within the table, and.55.12is the index of this specific row (all other columns for this row will also end with.55.12). If you establish a tag with the Source set toIndexandIndex Positionset to 1, the tag’s value for metrics from this table row will be55; if you set the index position to 2, it will be 12. If you use an index less than 1 or more than the number of indices in the table, the tag will not be populated.See Using an Index for more information.
Use Index Transformation when you need to tag a table metric value with a value from a different table that employs a subset of this table’s index. This is not a typical scenario. You configure this by adding one or more transformation segments, each with a start and end number. These numbers index into the original table’s index to create a new index value for the new table.
Example of using Index Transformation
Consider the
CPI-UNITY-MIBmodule. It has atable,cpiPduTable, with details about a specific PDU, and another table,cpiPduBranchTable, with information about specific PDU branches. The index of the main table is the PDU’s MAC address, such as6.0.36.155.53.3.246. The branch table’s index is abranch IDfollowed by thePDU MAC, therefore a branch table row index might be1.6.0.36.155.53.3.246. If you want to report the current on a PDU branch, you could addcpiPduBranchCurrent(OID 1.3.6.1.4.1.30932.1.10.1.3.110.1.3, from the branch table) as a tabular metric. To tag this metric with the PDU name, addcpiPduNameas a tag (OID 1.3.6.1.4.1.30932.1.10.1.2.10.1.3, from the main table), then add an index transform withstart:1andend:7. This means the branch current metric from the branch table indexed with1.6.0.36.155.53.3.246would be tagged using the name from the main table indexed with6.0.36.155.53.3.246.For more information see Using a column from a different table with different indexes.
Step 7: Global Tags
Add global tags to ensure the metadata, metrics, and global tags are applied to all matching devices. Global tags can be added either from a device scan or by manually creating a new tag for the profile. Additionally, the Inherited tag appears next to any global tags inherited from this profile.
To define a global tag using the Device Scan option, click + Add Tags. This opens a modal displaying all available tags for the device.
Select one or more tags you wish to add to the device profile, then click Add Tag.
This returns you to the define global tags screen where you can see and edit the new tag that was added.
To define a global tag using the Manual option, click + Add Tags. This opens a modal displaying all available tags for the device.
Click Create New Tag at the top of the modal.
Select the dropdown in the search field to add the OID name.
Click the Modification dropdown to add a modification. See advanced options.
Click Create to save the new tag.
This returns you to the define global tags screen where you can see the new tag that was added.
Advanced options
Advanced options
Global tags:
| Modification | Description |
|---|---|
| No Modification | The device’s returned value is used directly as the tag value. |
| Format | This can be mac_address or ip_address. |
| Extract Value | A regular expression used to extract the tag value from the SNMP value provided by the device. |
| Mapping | See the profile format reference. |
Apply a profile to created devices
After applying your configuration options to your device profile, click Save and Sync Agents to automatically apply this profile to all NDM agents. The configurations are applied to your devices with Remote Configuration. See prerequisites for more information.
- After you save a profile as a draft, navigate back to the profile home page, then select the Download All Profiles option. This allows you to download the
.zipbundle which contains theyamlfiles for the profiles you created. - Place the
yamlfiles in the profile directory on each of the relevant installed Agents. - Restart the Datadog Agent.
- To ensure the profiles you created are accurate, confirm that NDM is receiving metrics from the matched devices as expected.
Inventory page
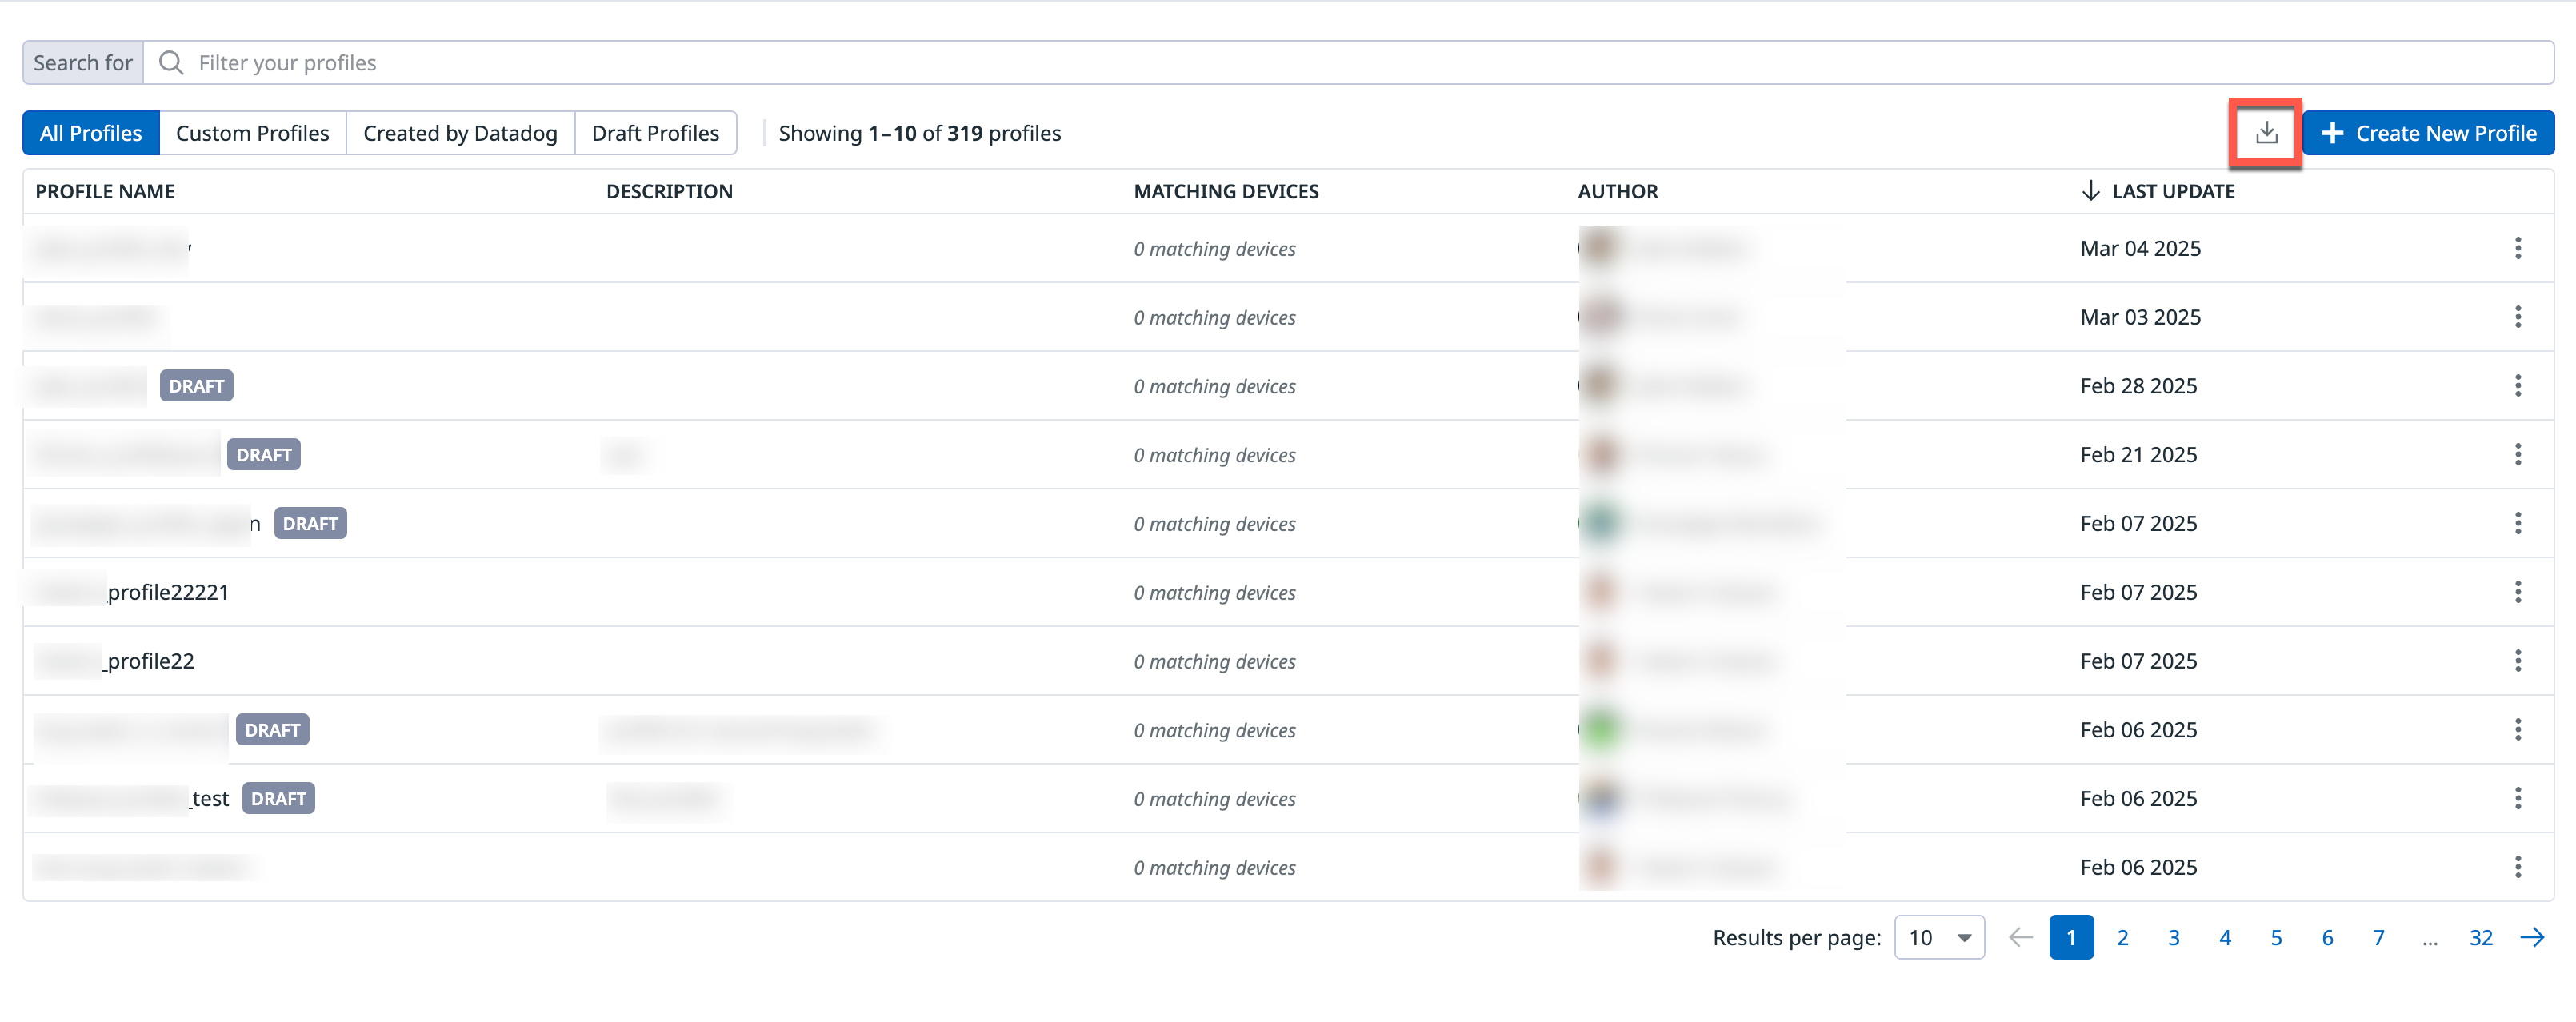
Navigate to Infrastructure > Network Devices > Configuration to view the device profile Inventory page. Here, you can view a summary of the out-of-the-box (OOTB) profiles, as well as the device profiles you created using the Device Profile Setup above.
This page includes the following features:
Draft status: Indicates a net new profile that has not yet been applied to the Agent. To apply a profile to the Agent, click into the profile and sync the Agent. Once a profile is applied, you cannot bring it back to draft status.
Filters: The filters include the following options:
- Custom Profiles - User created device profiles.
- Created by Datadog - Datadog out-of-the-box profiles that can be viewed and used to build your own custom profile.
- Draft Profiles - Devices profiles in that are in draft mode.
Create new profile and Download: The + Create New Profile button opens the profile creation form which allows you to build a new device profile. Clicking the download button generates and download a
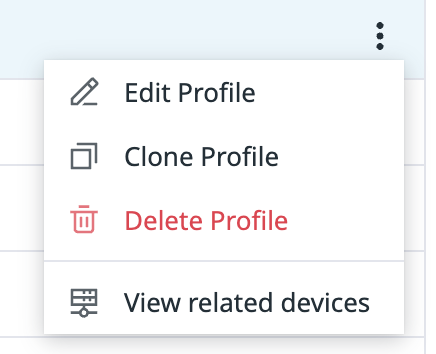
.zipbundle which contains theyamlfiles for the profiles you created.Kebab menu: Clicking the kebab menu to the right of a profile allows you to edit, clone, or delete the profile (for custom profiles only). You can also navigate to View related devices on the NDM page, filtered to the device(s) the profile is applied to.
Troubleshooting
What is a profile?
- A profile is a configuration file that defines the metadata, metrics, and tags to collect from a device. See metadata definition for more information.
What is a device scan?
- A device scan conducts a complete SNMP walk of the device, collecting all available data and forwarding it to Datadog for display in the UI. This process helps you identify the OIDs available on the device and add them to the profile for monitoring.
Why would I see no matching devices?
If no matching devices are found, it may be due to the following reasons:
- The profile is in Draft mode:
- Draft profiles are not applied to the Agent. To start monitoring devices with your profile, you must sync it to the Agent(s). This can be done by opening the profile and clicking on the Save & Sync Agents button.
- The profile is applied but is not matching any device(s):
- Profiles are matched to devices using their SysObjectID. Ensure that the SysObjectID specified in the profile matches one or more of your monitored devices.
- Multiple profiles have the same SysObjectID(s):
- Profiles are matched to devices using their SysObjectID. If multiple profiles share the same SysObjectID, it can cause matching conflicts at the Agent level. Ensure that each SysObjectID is assigned to only one profile.
Why would a device not be scanned?
- The device scan may take up to 10 minutes to complete. You can monitor the scan’s progress in the UI. If errors occur, try restarting the scan or selecting a different reference device.
What if I don’t have Remote Configuration enabled on my collectors?
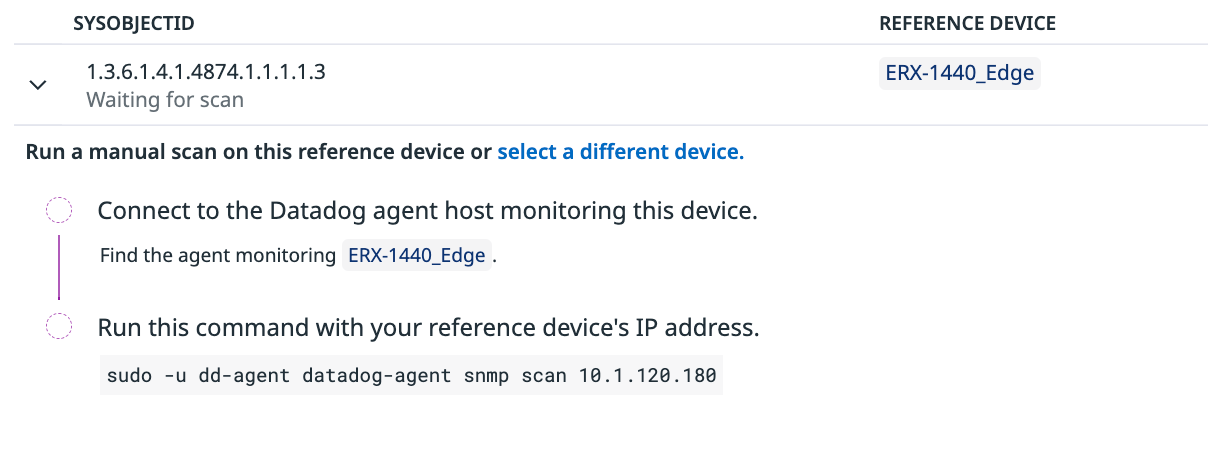
If you are using an Agent version earlier than
7.47.0and do not already have Remote Configuration manually enabled on your hosts, you will not be able to trigger device scans or sync profiles to the Agents through the UI. However, you can perform these steps manually.To scan a device, follow the instructions in the UI:
Or, to apply the profiles to your Agents manually:
- Save the profile.
- Click on the download button to save a zip file of all your profiles.
- Upload the zip file to your Agents by following the instructions in the manually apply a profile to created devices section.
Datadog strongly recommends enabling Remote Configuration to ensure a seamless, UI-based experience and to minimize unnecessary interactions with the Agent.
Further Reading
Additional helpful documentation, links, and articles:
